[Preprint]. 2023 Mar 10:2023.03.09.23285319.
doi: 10.1101/2023.03.09.23285319.

Evaluating targeted COVID-19 vaccination strategies with agent-based modeling

Affiliations

Evaluating targeted COVID-19 vaccination strategies with agent-based modeling

Thomas J Hladish et al. medRxiv. .

Update in

Abstract

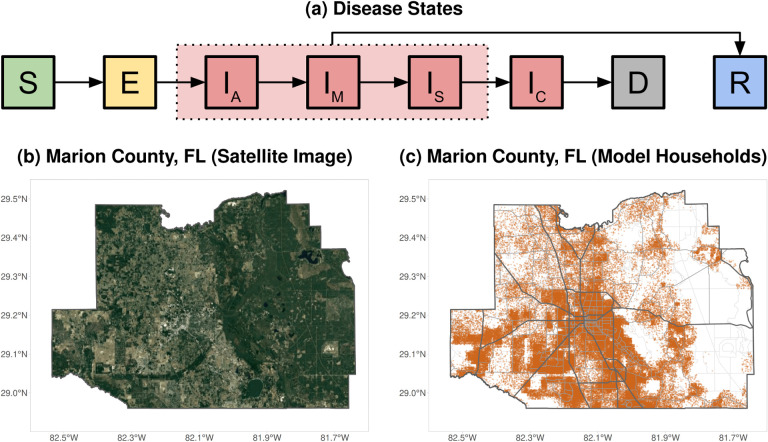
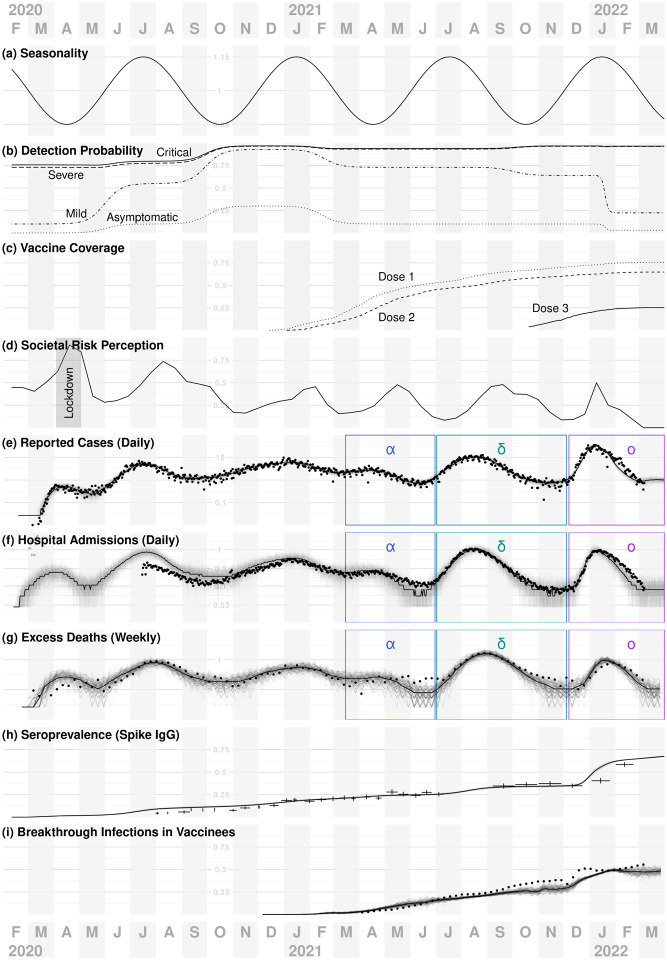
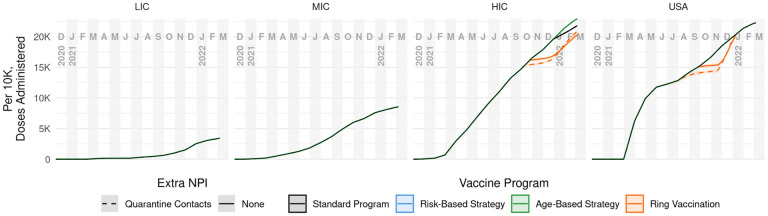
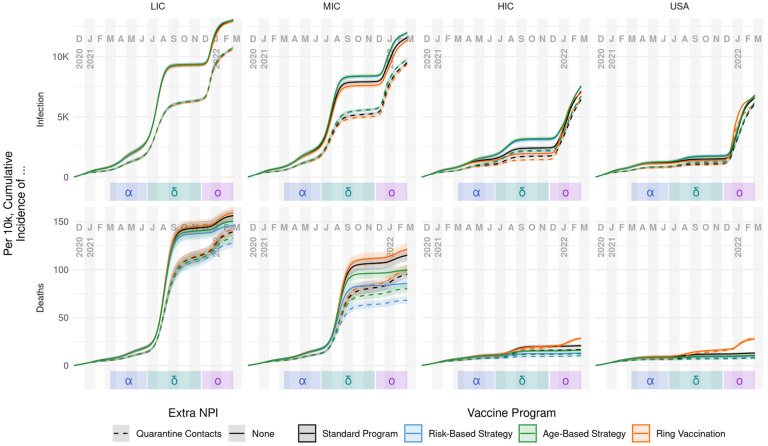
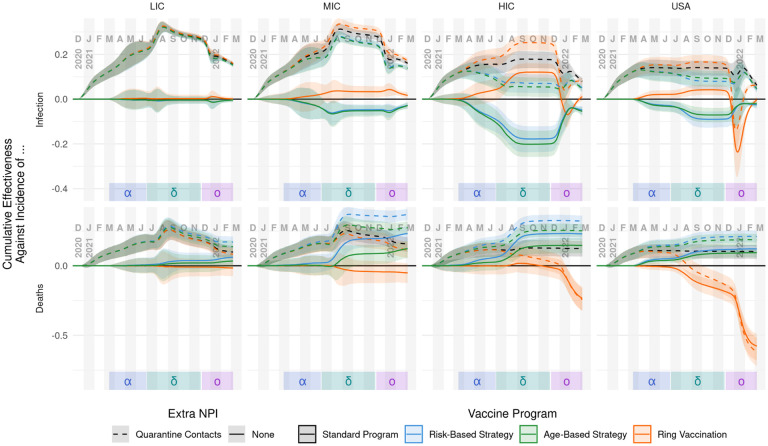
We evaluate approaches to vaccine distribution using an agent-based model of human activity and COVID-19 transmission calibrated to detailed trends in cases, hospitalizations, deaths, seroprevalence, and vaccine breakthrough infections in Florida, USA. We compare the incremental effectiveness for four different distribution strategies at four different levels of vaccine availability, reflecting different income settings' historical COVID-19 vaccine distribution. Our analysis indicates that the best strategy to reduce severe outcomes is to actively target high disease-risk individuals. This was true in every scenario, although the advantage was greatest for the middle-income-country availability assumptions, and relatively modest compared to a simple mass vaccination approach for rapid, high levels of vaccine availability. Ring vaccination, while generally the most effective strategy for reducing infections, ultimately proved least effective at preventing deaths. We also consider using age group as a practical, surrogate measure for actual disease-risk targeting; this approach still outperforms both simple mass distribution and ring vaccination. We also find that the magnitude of strategy effectiveness depends on when assessment occurs (e.g., after delta vs. after omicron variants). However, these differences in absolute benefit for the strategies do not change the ranking of their performance at preventing severe outcomes across vaccine availability assumptions.

Keywords: Agent-based Model; COVID-19; Florida; LMIC; Ring Vaccination; Vaccination.


Figures

Figure 1:
Figure 1:. Model disease states and spatial structure.
(a) Progression of the disease states in the model: susceptible (S) individuals may become exposed (E) to the virus, then progress to being infectious (initially asymptomatic [IA], possibly progressing to mild [IM], severe [IS] or critical [IC]), and finally recovering (R) or dying (D). Recovered individuals have strain-specific immunity that changes over time. (b) Satellite image of Marion County, FL, the region used for the model’s spatial structure. (c) Locations of the 115K model households (orange dots). Roads are shown for reference but are not modeled.
Figure 2:
Figure 2:. Individual interactions and behaviors in the model.
Interactions occur when people in the model are in the same location at the same time, and may occur in households, workplaces, schools, hospitals, and long-term care facilities (not shown). Households have an inherent risk tolerance (indicated by color), and probabilistically have inter-household connections homophilously based on that tolerance. The population overall has a time-varying perception of risk of COVID-19 infection that may be different from the actual risk. (a) When the societal perception of risk is lower than a household’s risk tolerance, household members engage in all their normal activities, including socializing with specific other households and patronizing specific high-transmission-risk workplaces like restaurants and bars. (b) When the societal perception of risk exceeds a given household’s risk tolerance, the household will cease high-risk activities (indicated with greyed arrows), while maintaining more essential activities like going to work, school, and patronizing low risk workplaces (e.g., grocery stores). (c, d) Employees and patrons interact in some workplace types, with interactions between employees more likely to result in transmission. (d) When perceived risk is high, risk-intolerant (blue) employees of high-transmission-hazard workplaces still go to work, while risk-intolerant patrons cease their patronage.
Figure 3:
Figure 3:. Time-varying model inputs and indicators of model performance.
Panels (a-d) show model inputs, and (e-i) compare model outputs to observed data. In (e-i), points and cross-hairs indicate observed values, solid lines median trends, and faded lines sample trajectories. Horizontal gridline values are plotted above October 2020. (a) Seasonal forcing has a 6-month period, peaking in January and July each year. (b) Detection and reporting probabilities by disease outcome. (c) Simulated first, second and third vaccine doses distributed statewide in Florida, used to calibrate the model (but not for evaluating strategies). (d) Societal risk perception, which drives personal protective behaviors in the model, is fitted so that cumulative reported cases in the model match empirical case data for FL (black dots in panel e). For approximately the month of April 2020, non-essential businesses were closed in the state, and thus are closed during this period in the model (gray “lockdown” shaded region). Not shown: schools in the model close during the summers and during spring 2020, and are 50% and 80% open during the 2020–2021 and 2021–2022 school years, respectively. (e–i) Simulated data closely track empirical data for incidence of reported cases (e), daily hospital admissions (f), excess deaths (g), seroprevalence (h), and the fraction of infections that occurred in vaccinees (i). Results in (e—g) are scaled to show values per 10,000 individuals, and VOC waves are labeled as alpha (α), delta (δ) and omicron (o). For empirical seroprevalance data in (h), horizontal bars indicate the dates covered by each data point and vertical lines indicate the 95% CI).
Figure 4:
Figure 4:. Cumulative vaccine doses administered per 10k over time, by supply level and distribution strategy.
For each combination of the four supply levels LIC, MIC, HIC and USA (columns) and quarantine policy (dashed lines), we considered four vaccination strategies: ring vaccination (i.e., infection-risk prioritization) (orange), risk prioritization (blue), age prioritization (green), and a standard mass vaccination (black). For LIC and MIC levels, all strategies use all available doses. For HIC and USA levels, the strategies sometimes differ in doses delivered due to shortages of individuals eligible for revaccination; only risk- and age-based strategies always use all available doses.
Figure 5:
Figure 5:. Cumulative incidence of infection and death per 10k people, by supply level and distribution strategy.
Columns represent vaccine supply scenarios. Rows represent infection (top) and death (bottom) outcomes. Central lines represent median values with a 90% interquantile range shown as the ribbon. For infections, the major effects are supply level (columns) and the policy of quarantining (dashed lines) or not quarantining (solid lines), whereas the four vaccination strategies perform similarly. For deaths, supply level and quarantine are again the strongest factors. However, a strong effect of vaccination strategy also emerges: relative to a standard vaccine roll-out (black), risk-based vaccination (blue) and age-based vaccination (green) are more effective at preventing deaths, whereas ring vaccination (orange) is less effective. See the text for further explanation.
Figure 6:
Figure 6:. Cumulative overall effectiveness against infection and death incidence, by supply level and strategy.
Columns represent vaccine supply scenarios. Against infections (top row), quarantining (dashed lines) significantly increases vaccination effectiveness. Central lines represent median values with a 90% interquantile range shown as the ribbon. Choice of strategy is less important in LIC and MIC scenarios, though in higher-income scenarios ring vaccination (orange) performs best until the omicron wave. Similarly, against deaths (bottom row), quarantining increases vaccination effectiveness overall; however, vaccination strategies are ranked more consistently. Risk- (blue) and age-based (green) strategies out-perform standard vaccination (black), while ring vaccination performs worst, especially in high-income settings during the omicron wave.
Figure 7:
Figure 7:. Cumulative effectiveness after variant waves.
Columns depict vaccine supply scenarios and rows separate infection and death results. “Waves” are defined generally as the time from when a VOC is introduced to when a new VOC is introduced (however the alpha period starts at the beginning of the simulation and omicron period ends at the end of the simulation). The non-quarantining, standard strategy is used as the baseline for all comparisons.

References

    1. Hladish T. J., et al. , Proceedings of the National Academy of Sciences 117, 3319 (2020). Publisher: National Academy of Sciences Section: Biological Sciences. - PMC - PubMed
    1. Chowell G., Viboud C., Wang X., Bertozzi S. M., Miller M. A., PLoS ONE 4, e8164 (2009). - PMC - PubMed
    1. Conway J. M., et al. , BMC Public Health 11, 932 (2011). - PMC - PubMed
    1. Assistant Secretary for Public Affairs (ASPA), COVID-19 Vaccines (2020).
    1. Ebola ça suffit ring vaccination trial consortium, British Medical Journal 351 (2015).

Publication types