[Preprint]. 2023 Mar 12:2023.03.09.531600.
doi: 10.1101/2023.03.09.531600.

A deep population reference panel of tandem repeat variation

Affiliations

A deep population reference panel of tandem repeat variation

Helyaneh Ziaei Jam et al. bioRxiv. .

Update in

  • A deep population reference panel of tandem repeat variation.
    Ziaei Jam H, Li Y, DeVito R, Mousavi N, Ma N, Lujumba I, Adam Y, Maksimov M, Huang B, Dolzhenko E, Qiu Y, Kakembo FE, Joseph H, Onyido B, Adeyemi J, Bakhtiari M, Park J, Javadzadeh S, Jjingo D, Adebiyi E, Bafna V, Gymrek M. Ziaei Jam H, et al. Nat Commun. 2023 Oct 23;14(1):6711. doi: 10.1038/s41467-023-42278-3. Nat Commun. 2023. PMID: 37872149 Free PMC article.

Abstract

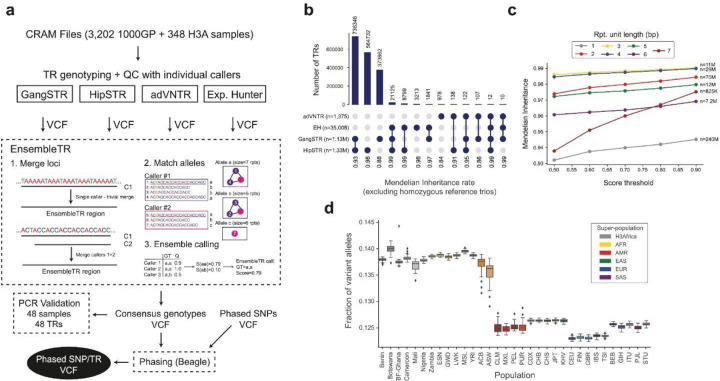
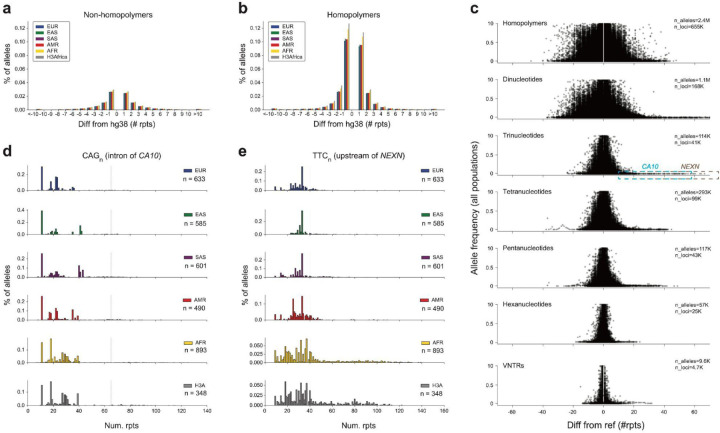
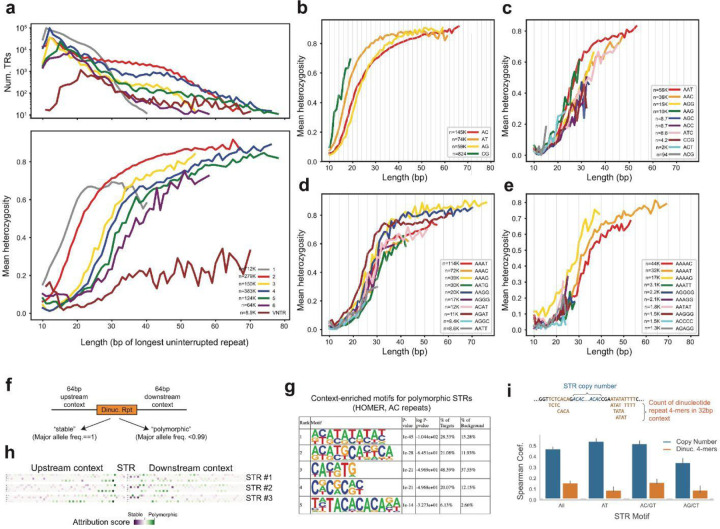
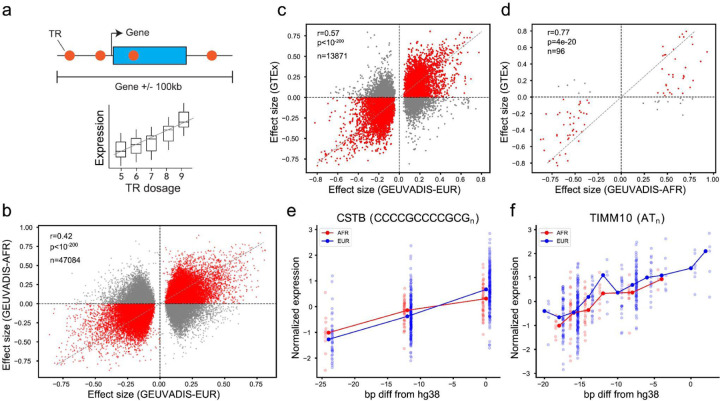
Tandem repeats (TRs) represent one of the largest sources of genetic variation in humans and are implicated in a range of phenotypes. Here we present a deep characterization of TR variation based on high coverage whole genome sequencing from 3,550 diverse individuals from the 1000 Genomes Project and H3Africa cohorts. We develop a method, EnsembleTR, to integrate genotypes from four separate methods resulting in high-quality genotypes at more than 1.7 million TR loci. Our catalog reveals novel sequence features influencing TR heterozygosity, identifies population-specific trinucleotide expansions, and finds hundreds of novel eQTL signals. Finally, we generate a phased haplotype panel which can be used to impute most TRs from nearby single nucleotide polymorphisms (SNPs) with high accuracy. Overall, the TR genotypes and reference haplotype panel generated here will serve as valuable resources for future genome-wide and population-wide studies of TRs and their role in human phenotypes.


Conflict of interest statement

Competing interests V.B. is a co-founder, consultant, SAB member and has equity interest in Boundless Bio, inc. and Abterra, Inc. The terms of this arrangement have been reviewed and approved by the University of California, San Diego in accordance with its conflict of interest policies.

Figures

Figure 1:
Figure 1:. A deep catalog of TR variation across human populations.
a. Overview of EnsembleTR workflow. Aligned reads (CRAMs) are input to four different TR genotyping tools (GangSTR, HipSTR, adVNTR, and ExpansionHunter). Quality filtered VCFs are input to EnsembleTR. EnsembleTR first identifies sets of mergeable loci (step 1). It then identifies sets of compatible alleles between callers (step 2). Finally, it uses a voting metric to score each possible diploid genotype (step 3) and outputs the best genotype and its corresponding score. The resulting VCF file is used for PCR validation of TR genotypes and in downstream analysis to generate a phased SNP+TR reference haplotype panel. b. Overlap of TRs called by each method. Annotations below the bars indicate the combination of methods a TR was called in. Numbers next to each method indicate the number of unique TRs in each category. Numbers below the plot indicate the Mendelian Inheritance rate across all calls in each category. Categories with fewer than 10 total TRs were excluded. c. Mendelian Inheritance as a function of EnsembleTR quality score. The x-axis gives the EnsembleTR quality score threshold used, and the y-axis gives the percent of genotyped trios which follow Mendelian Inheritance (MI). Line colors denote repeat unit lengths. Each trio/TR pair was only included in each category if all calls in the trio passed the score threshold. Trio/TR pairs for which all samples were homozygous for the reference allele were excluded from analysis, as these artificially inflate MI rates. d. Distribution of the fraction of non-reference alleles in individuals by population. Boxplots summarize the distribution of the fraction of variant alleles in each sample. Horizontal lines show median values, boxes span from the 25th percentile (Q1) to the 75th percentile (Q3). Whiskers extend to Q1–1.5*IQR (bottom) and Q3+1.5*IQR (top), where IQR gives the interquartile range (Q3-Q1). Homopolymer TRs are excluded. Box colors denote superpopulations.
Figure 2:
Figure 2:. Characterizing population-specific TR variation.
a-b. Distribution of variant allele sizes. Bars show the percent of variant alleles that have a specified difference in length compared to the hg38 reference. Positive numbers indicate expansions and negative numbers indicate contractions relative to the reference. Panel a shows data for all non-homopolymer TRs and b shows data for homopolymer TRs. c. Allele frequency vs. allele length. The x-axis shows allele lengths relative to the reference genome and the y-axis shows the frequency of each allele across all populations. Different panels denote different repeat unit lengths. Dots corresponding to expansion alleles highlighted in the text are annotated with dashed boxes. Only alleles with frequency at least 0.1% are shown. Alleles with the same length as the reference allele are excluded. d-e. Population-specific allele distributions at example loci. In each panel, the x-axis denotes allele length (number of repeats) and the y-axis denotes the frequency of each allele. Each panel shows a different superpopulation. Panel d shows a trinucleotide repeat in intron 4 of CA10. Panel e shows a trinucleotide repeat upstream of NEXN. Both repeats have expansion alleles common in African populations compared to non-Africans.
Figure 3:
Figure 3:. Sequence determinants of TR polymorphism
a. Heterozygosity is correlated with total TR length. The x-axis denotes the length of each TR in hg38 (in bp of the longest uninterrupted perfect repeat). The top panel gives the number of repeats in each category. The bottom panel shows the mean heterozygosity for TRs with each length. b-e are the same as the bottom panel of a, except for different repeat unit sequences (b=dinucleotides, c=trinucleotides, d=tetranucleotides, e=pentanucleotides). Homopolymers are not shown separately as the vast majority are of the same repeat unit (An). Vertical gray bars are shown every other bp in b, every third bp in c, every fourth bp in d, and every fifth bp in e. f. Schematic overview of approach to classify TRs as stable vs. polymorphic based on sequence context. We used two approaches (HOMER and convolutional neural networks) to classify dinucleotide TRs based on 64bp of sequence context upstream and downstream of the TR. g. Top HOMER motifs enriched in the context of AC dinucleotide TRs. All other discovered motifs were flagged as likely false positives by HOMER. h. Attribution scores of three example AC TRs most confidently predicted to be polymorphic. Each row denotes a different TR. Within each row, the matrix has a row for each nucleotide (A, C, G, T) and a column for each position (centered on the TR). Color denotes the attribution score of each base in each position, where green indicates a base positively contributed towards the model predicting polymorphic and purple indicates contributing towards the model predicting stable. i. Correlation of TR and context features with heterozygosity. Blue bars denote the Spearman correlation of total TR length (reference copy number) with heterozygosity. Orange denotes correlation of the counts of dinucleotide-like or homopolymer-like 4-mers in the context region (+/− 64bp) with heterozygosity. Error bars give 99% confidence intervals found by bootstrapping with 1,000 70% subsets.
Figure 4:
Figure 4:. TRs associated with gene expression in LCLs
a. Schematic overview of eTR detection. A separate association test between TR dosage (sum of repeat lengths) and expression is performed for each TR within 100kb of a gene. b. Comparison of effect sizes across populations. The x-axis gives effect sizes based on European samples and the y-axis gives effect sizes based on African samples from GEUVADIS. Each dot represents a TR-gene pair (eTR). eTRs with consistent effect directions are colored in red. Only eTRs reaching FDR<0.05 in at least one population are included. c-d. Comparison of effect sizes in GEUVADIS vs. GTEx. The x-axis gives effect sizes measured in GEUVADIS in Europeans (c) or Africans (d). The y-axis of each plot gives the effect sizes measured in Fotsing et al. in cultured fibroblasts. Each dot represents a TR-gene pair (eTR). Only eTRs with adjusted p-values <0.05 in the GEUVADIS analysis are shown. e. Example replication of a previously identified eTR. The x-axis gives the number of repeats of a TR upstream of the gene CSTB. The y-axis gives normalized CSTB expression. f. Example novel eTR. The x-axis gives the number of repeats of a TR near TIMM10. The y-axis gives normalized TIMM10 expression
Figure 5:
Figure 5:. Phasing and imputation at TRs
a. Imputation accuracy decreases with heterozygosity. The x-axis denotes TR heterozygosity. The y-axis denotes the mean concordance for TRs in each heterozygosity bin based on a Leave-One-Out analysis on chromosome 21. b. TRs are often tagged by common SNPs. The x-axis denotes the number of common alleles (frequency >0.01) for each TR. The y-axis denotes the mean LD (r2) of the best tag SNP for TRs in each bin. For a-b, colors denote 1000G superpopulation. c. Distribution of the distance between each TR and its best tag SNP. The y-axis is given on a log10 scale.

Similar articles

References

    1. 1000 Genomes Project Consortium et al. A global reference for human genetic variation. Nature 526, 68–74 (2015). - PMC - PubMed
    1. Byrska-Bishop M. et al. High-coverage whole-genome sequencing of the expanded 1000 Genomes Project cohort including 602 trios. Cell 185, 3426–3440.e19 (2022). - PMC - PubMed
    1. Whole-genome sequencing of the UK Biobank. Nature Preprint at 10.1038/d41586-022-01984-6 (2022). - DOI - PubMed
    1. Mallick S. et al. The Simons Genome Diversity Project: 300 genomes from 142 diverse populations. Nature (2016) doi:10.1038/nature18964. - DOI - PMC - PubMed
    1. Weber J. L. & Wong C. Mutation of human short tandem repeats. Hum. Mol. Genet. 2, 1123–1128 (1993). - PubMed

Publication types