[Preprint]. 2023 Jul 4:2023.03.06.531303.
doi: 10.1101/2023.03.06.531303.

Roles of microbiota in autoimmunity in Arabidopsis

Affiliations

Roles of microbiota in autoimmunity in Arabidopsis

Yu Ti Cheng et al. bioRxiv. .

Update in

Abstract

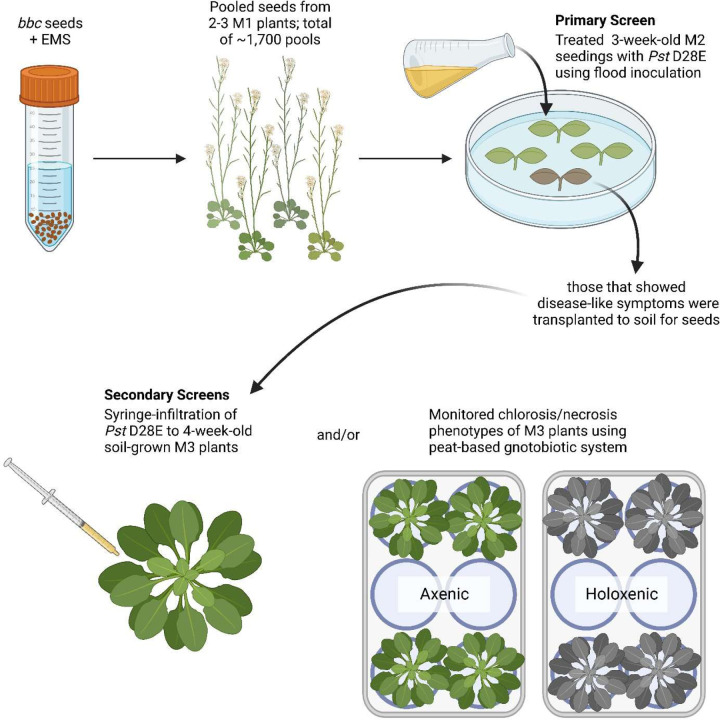
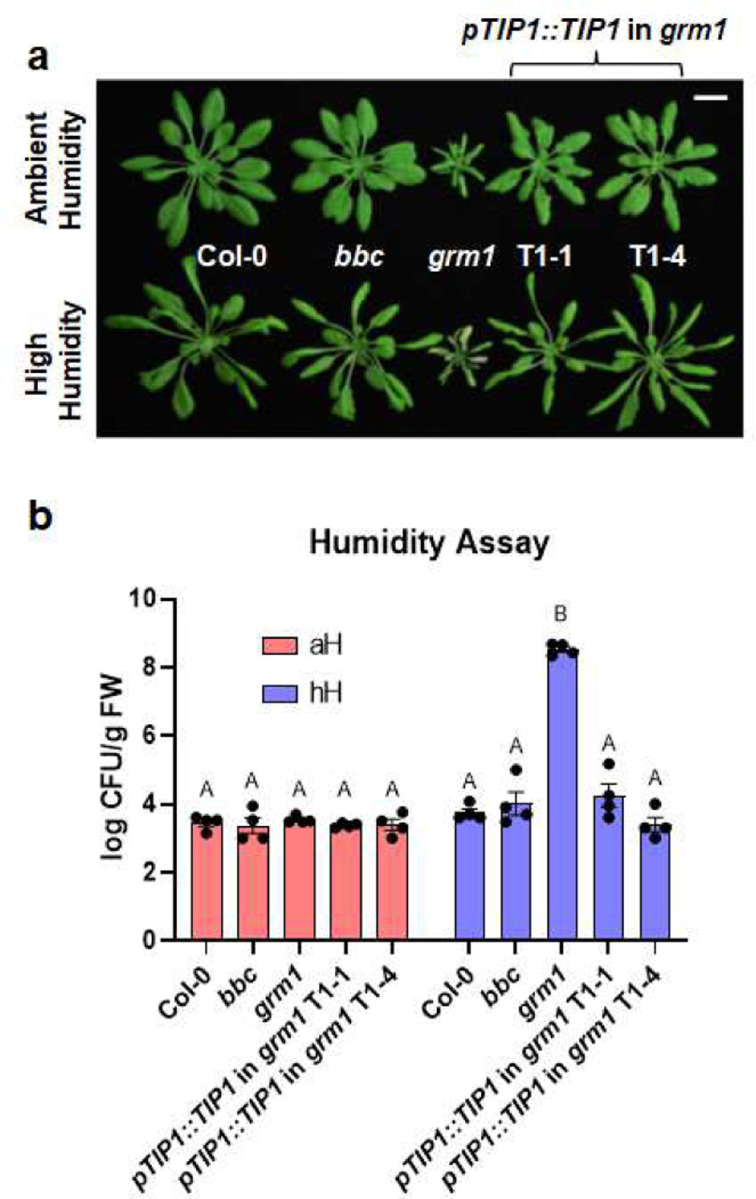
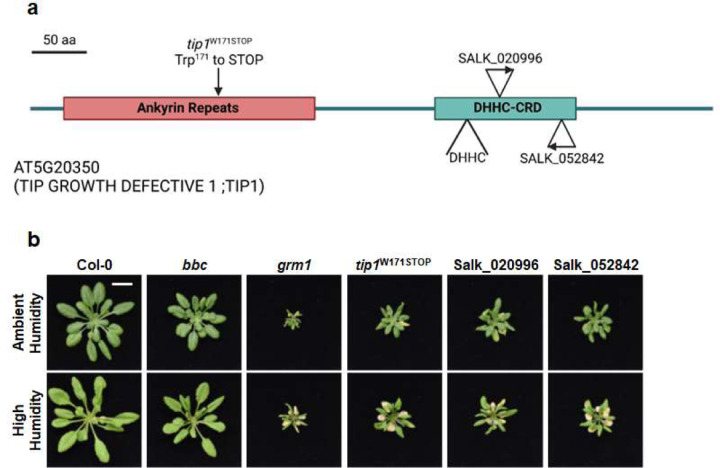
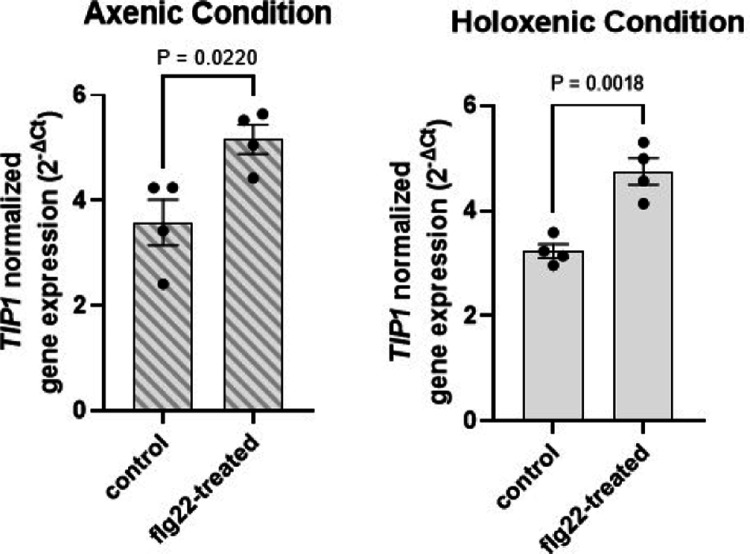
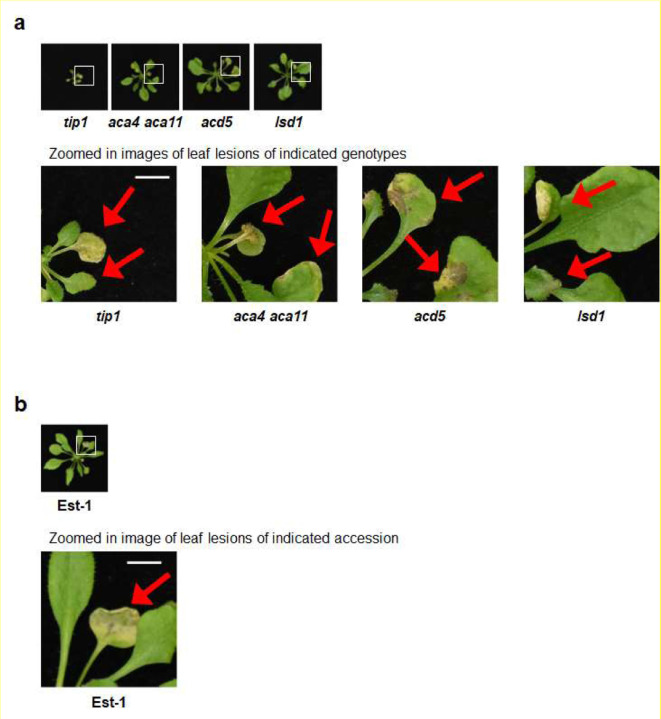
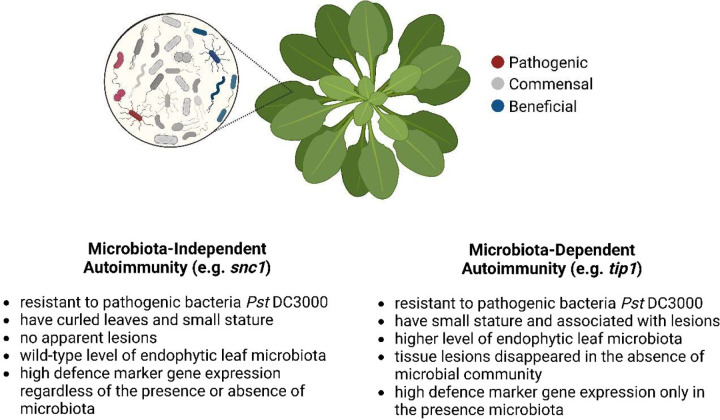
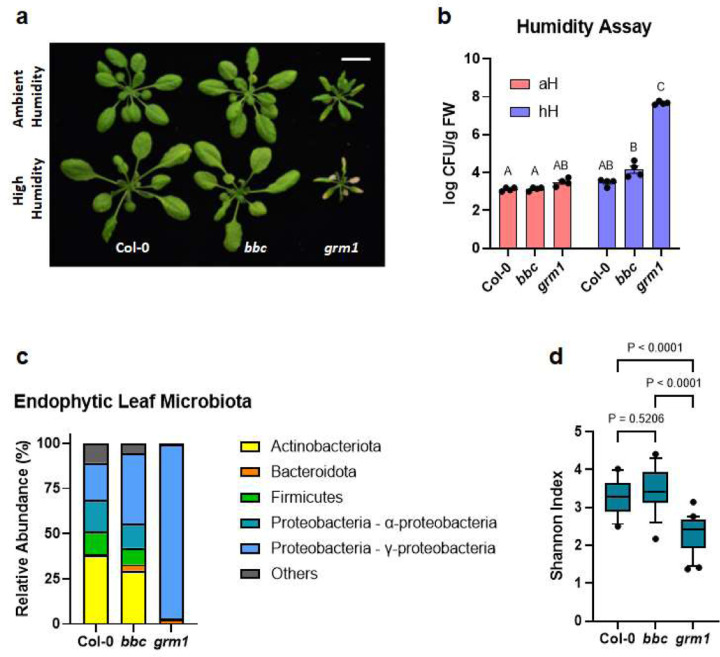
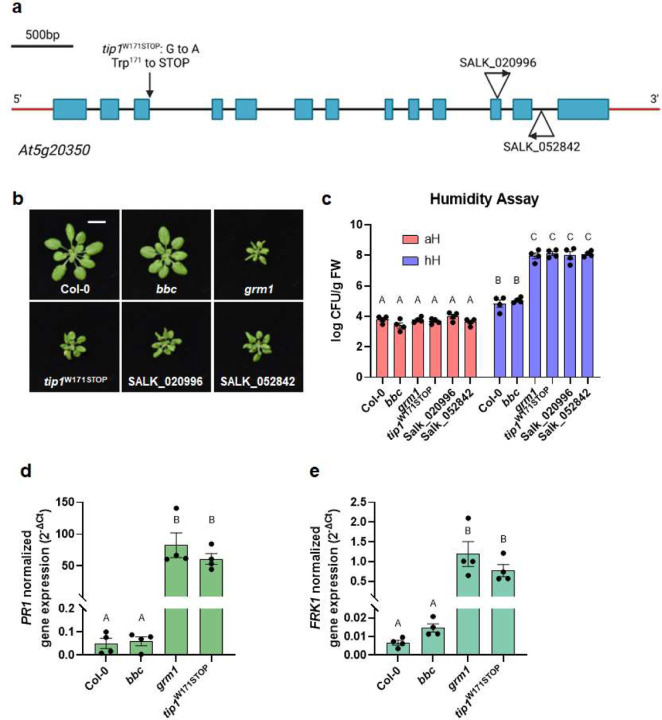
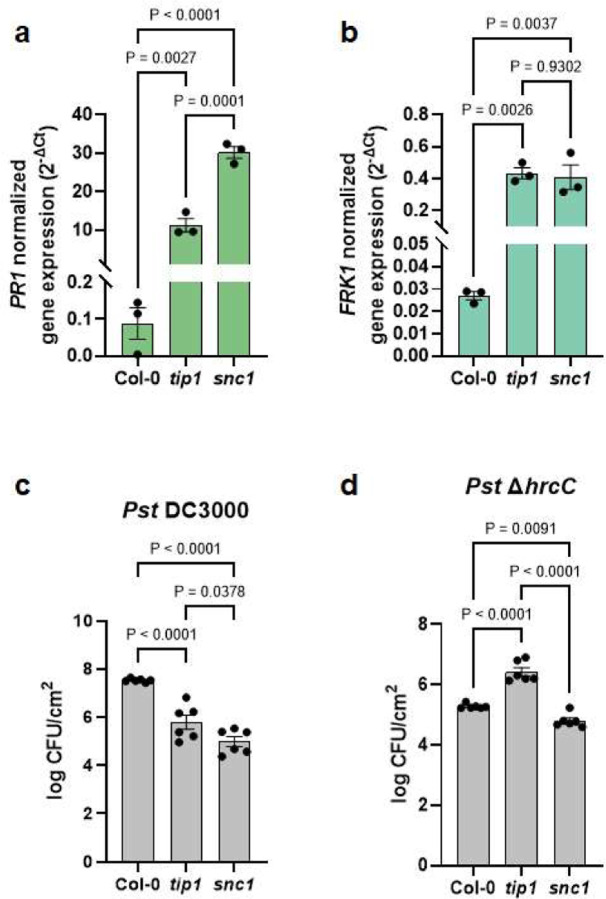
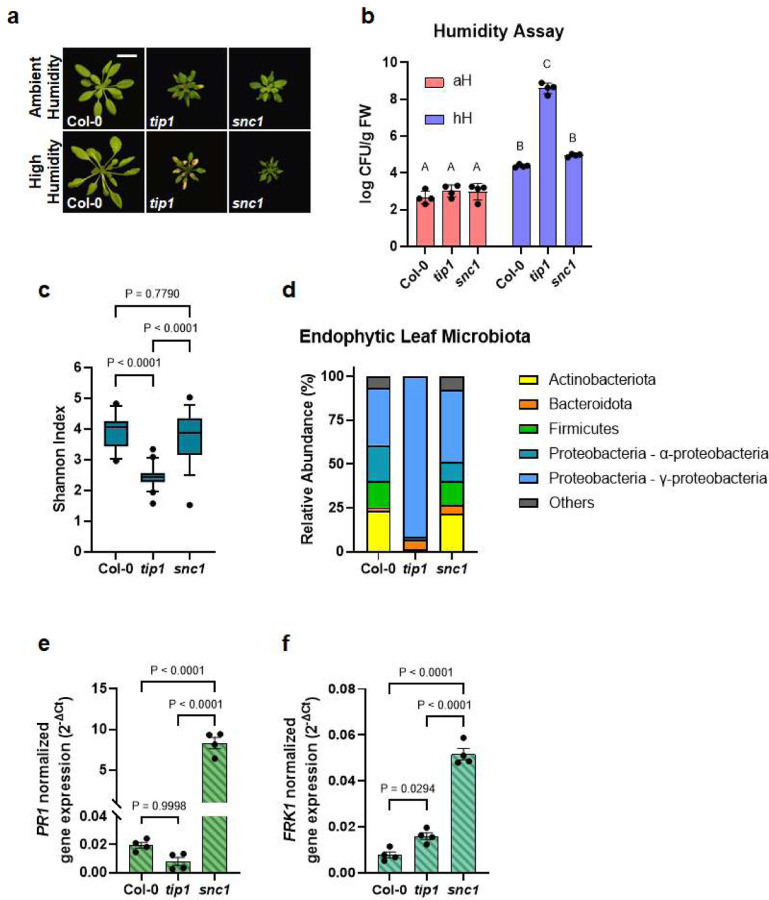
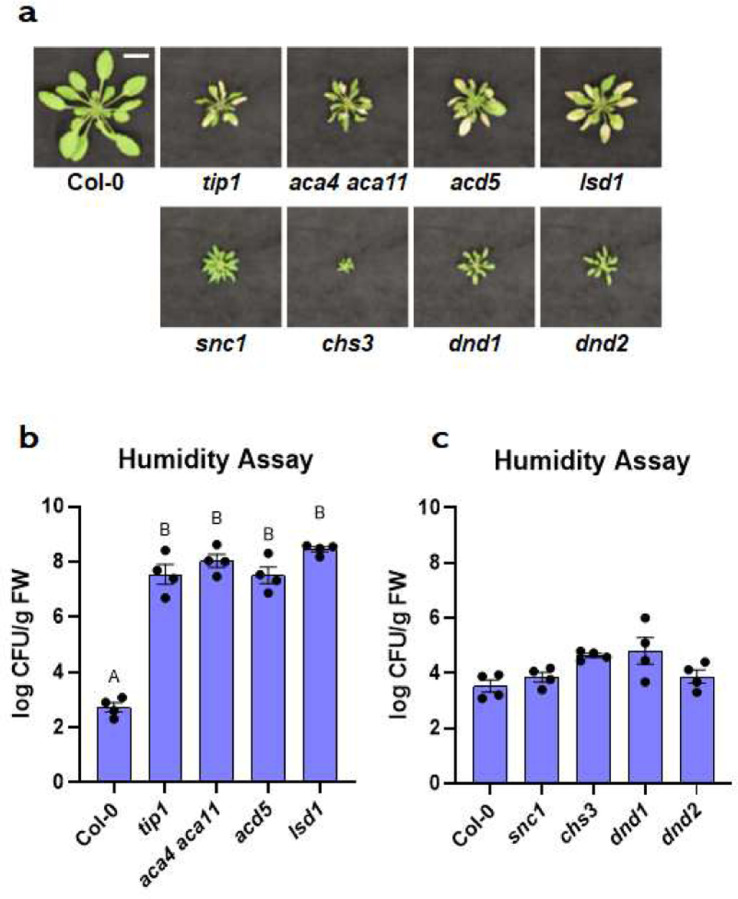
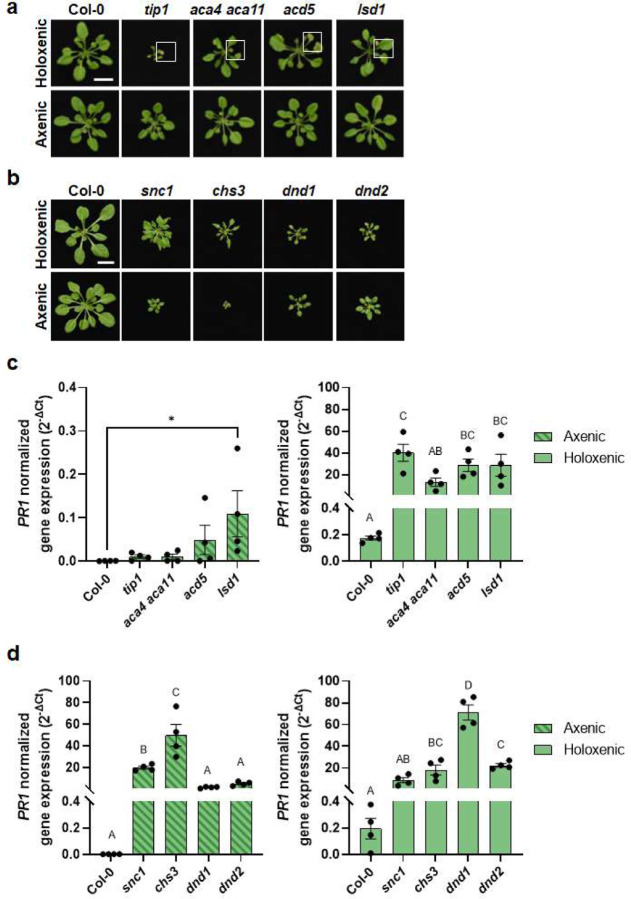
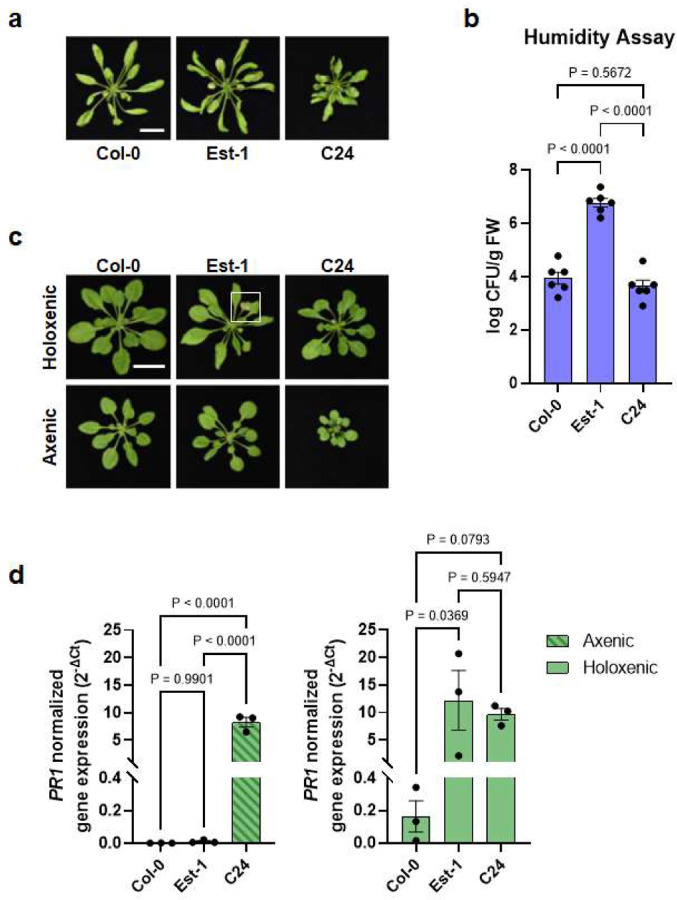
Over the past three decades, researchers have isolated plant mutants that display constitutively activated defense responses in the absence of pathogen infection. These mutants are called autoimmune mutants and are typically dwarf and/or bearing chlorotic/necrotic lesions. From a genetic screen for Arabidopsis genes involved in maintaining a normal leaf microbiota, we identified TIP GROWTH DEFECTIVE 1 (TIP1), which encodes a S-acyltransferase, as a key player in guarding leaves against abnormal microbiota level and composition under high humidity conditions. The tip1 mutant has several characteristic phenotypes of classical autoimmune mutants, including a dwarf stature, displaying lesions, and having a high basal level of defense gene expression. Gnotobiotic experiments revealed that the autoimmune phenotypes of the tip1 mutant are largely dependent on the presence of microbiota as axenic tip1 plants have markedly reduced autoimmune phenotypes. We found that the microbiota dependency of autoimmune phenotypes is shared by several "lesion mimic"-type autoimmune mutants in Arabidopsis. Interestingly, autoimmune phenotypes caused by mutations in NLR genes do not require the presence of microbiota and can even be partially alleviated by microbiota. Our results therefore suggest the existence of two classes of autoimmunity (microbiota-dependent vs. microbiota-independent) in plants. The observed interplay between autoimmunity and microbiota in the lesion mimic class of autoimmunity is reminiscent of the interactions between autoimmunity and dysbiosis in the animal kingdom.


Conflict of interest statement

Ethics declarations Competing interests The authors declare no competing interests.

Figures

Extended Data Figure 1.
Extended Data Figure 1.. A schematic diagram of the genetic screen workflow.
See Methods for detailed description of the genetic screen. Created with BioRender.com.
Extended Data Figure 2.
Extended Data Figure 2.. Mapping-by-sequencing to identify the causative mutation in the grm1 mutant.
a, grm1 genomic mapping. Red line represents allele frequency. Blue and purple lines denote 95% and 99% confidence intervals, respectively. b, RT-PCR products using primers flanking the grm1 mutation locus. Genomic (top panel) and complementary (bottom panel) DNA from indicated genotypes were used as templates.
Extended Data Figure 3.
Extended Data Figure 3.. Transgene complementation of the grm1 mutant.
a, Images of four-week-old, potting soil-grown Col-0, bbc, grm1 and two independent grm1 complementation lines under ambient humidity (~50% RH basal control condition; upper panel) or high humidity (~95% RH; bottom panel) for five days. Scale bar equals 2 cm. b, Transgene complementation of the grm1 mutant. Population sizes of leaf endophytic microbiota after five days of plant growth under ambient humidity (aH, ~50% RH basal control condition) or high humidity (~95% RH). Results represent the mean values ± SEM of four plants. Statistical analysis was performed using two-way ANOVA with Tukey’s HSD test. Experiment was independently performed twice with similar results.
Extended Data Figure 4.
Extended Data Figure 4.. Appearance of tip1 mutant alleles.
a, A schematic diagram illustrating various mutant alleles of TIP1 protein. tip1W171STOP is the allele isolated from this study which contains a G to A mutation at the splicing junction that is expected to cause a pre-mature STOP codon at amino acid residue Trp171 in the ankyrin-repeat domain. SALK_020996 and SALK_052842 have T-DNA insertions that would affect the DHHC cysteine-rich domain (DHHC-CRD). Created with BioRender.com. b, Images of four-week-old, potting soil-grown Col-0, bbc, grm1 and various tip1 single mutant plants under ambient humidity (~50% RH basal control condition; upper panel) or high humidity (~95% RH) for five days. Scale bar equals 2 cm.
Extended Data Figure 5.
Extended Data Figure 5.. TIP1 is induced by PTI elicitor flg22.
Expression of TIP1 after 90 minutes of 250 nM flg22 treatment. Plants were grown under axenic (left panel; with diagonal stripe pattern) or holoxenic (right panel) conditions in GnotoPots. Results represent the mean values ± SEM of four biological replicates. Statistical analysis was done by the Student’s t-test. Experiment was independently performed three times with similar results.
Extended Data Figure 6.
Extended Data Figure 6.. Appearance of 5-week-old, soil-grown Col-0, Est-1 and C24 plants.
Extended Data Figure 7.
Extended Data Figure 7.. Zoomed in images of leaf lesions on plants grown in holoxenic conditions.
a, Zoomed in images of indicated genotypes grown on GnotoPots under holoxenic conditions. Scale bar equals 0.5 cm. b, Zoomed in image of Est-1 grown on GnotoPots under holoxenic conditions. Scale bar equals 0.5 cm.
Extended Data Figure 8.
Extended Data Figure 8.. Characteristics of two types of autoimmunity in plants based on their microbiota dependency.
Created with BioRender.com.
Figure 1.
Figure 1.. The appearance and leaf microbiota phenotypes of the grm1 mutant.
a, Top panel, four-week-old soil-grown Col-0, bbc and grm1 plants under ambient humidity (~50% RH) for five days (basal condition, controls). Bottom panel, four-week-old soil-grown plants shifted to high humidity (~95% RH) for five days. Images were taken on day five of the treatments. Scale bar equals 2 cm. b, Population sizes of endophytic leaf microbiota after five days of indicated humidity conditions. aH = ambient humidity (~50% RH; basal condition, controls); hH = high humidity (~95% RH). Each column represents bacterial titer as log-transformed colony forming units (CFU) per gram of fresh weight (FW). Data are displayed as mean ± SEM (n=4 biological replicates; each biological replicate contains 1–3 leaves from one plant). Different letters represent significant differences (p < 0.05, two-way ANOVA with Tukey’s HSD test). Experiment was independently performed three times with similar results. c, Relative abundance of endophytic leaf bacteria at the phylum level and at the class level for Proteobacteria. d, Shannon indexes of endophytic leaf bacteria based on 16S rDNA amplicon sequence profiling of indicated genotypes. The center lines of the box plot represent means, the box edges are the 75th and 25th percentiles, whiskers extend to 10–90 percentiles, and dots are outliers.
Figure 2.
Figure 2.. Characterization of tip1 single mutant plants.
a, A schematic diagram showing various mutant alleles in the TIP1 gene. tip1W171STOP is the allele isolated from this study which contains a G to A mutation at the splicing junction that is expected to cause a pre-mature STOP codon at amino acid residue Trp171 in the ankyrin-repeat domain. SALK_020996 and SALK_052842 are T-DNA insertion alleles obtained from ABRC. Created with BioRender.com. b, Images of four-week-old, soil-grown Col-0, bbc, grm1 and tip1 single mutant plants. Scale bar equals 2 cm. c, Population sizes of endophytic leaf microbiota after five days under humidity conditions indicated. aH = ambient humidity (~50% RH; basal condition, controls); hH = high humidity (~95% RH). Results represent the mean values ± SEM (n=4 biological replicates; each biological replicate contains 1–3 leaves from one plant). Different letters represent a significant difference (p < 0.05, two-way ANOVA with Tukey’s HSD test). Experiment was independently performed three times with similar results. d,e, Expression levels of PR1 (d) and FRK1 (e) genes in four-week-old, soil-grown Col-0, bbc, grm1 and tip1 plants. PP2AA3 expression was used for normalization. Results represent the mean values ± SEM of four biological replicates. Each biological replicate is a pool of three plants. Different letters represent a significant difference (p < 0.05, one-way ANOVA with Tukey’s HSD test). Experiment was independently performed twice with similar results.
Figure 3.
Figure 3.. The autoimmune phenotypes of tip1 and snc1 mutants.
a,b, Expression level of PR1 (a) and FRK1 (b) genes in four-week-old, soil-grown Col-0, tip1 and snc1 plants. PP2AA3 was used for normalization. Results represent the mean values ± SEM of three biological replicates. Each biological replicate is a pool of three plants. Statistical analysis was performed using one-way ANOVA with Tukey’s HSD test. Experiment was independently performed twice with similar results. c,d, Total bacterial populations in Col-0, tip1 and snc1 leaves three days after Pst DC3000 (c) or five days after Pst ΔhrcC (d) infiltration. Humidity was kept at ~95% throughout the duration of the disease assay. Each column represents bacterial titer as log-transformed colony forming units (CFU) per cm2 and is the mean of six biological replicates; each biological replicate contains leaf discs from infiltrated leaves from one plant; total of six plants were infiltrated. Error bars indicate SEM. Statistical analysis was performed using one-way ANOVA with Tukey’s HSD test. Experiment was independently performed three times with similar results.
Figure 4.
Figure 4.. The distinct autoimmune phenotypes of tip1 and snc1 mutants.
a, Top panel, four-week-old, soil-grown Col-0, tip1 and snc1 plants under ambient humidity (~50% RH) for five days (basal condition, controls). Bottom panel, four-week-old, soil-grown plants shifted to high humidity (~95% RH) for five days. Images were taken on day five of the treatments. Scale bar equals 2 cm. b, Population sizes of endophytic leaf microbiota after five days of plant growth under humidity conditions indicated. aH = ambient humidity (~50% RH; basal condition, controls); hH = high humidity (~95% RH). Results represent the mean values ± SEM of four biological replicates; each biological replicate contains 1–2 leaves from one plant. Different letters represent a significant difference (p < 0.05, two-way ANOVA with Tukey’s HSD test). Experiment was independently performed three times with similar results. c,d, Shannon indexes (c) and relative abundance (d) of endophytic bacterial microbiota at the phylum level and at class level for Proteobacteria of in Col-0, tip1 and snc1 leaves based on 16S rDNA amplicon sequence profiling. The center lines of the box plot represent means, the box edges are the 75th and 25th percentiles, whiskers extend to 10–90 percentiles, and dots are outliers. e,f, Expression level of PR1 (e) and FRK1 (f) genes in 2.5-week-old plate-grown Col-0, tip1 and snc1 plants. PP2AA3 expression was used for normalization. Results represent the mean values ± SEM of four biological replicates. Each biological replicate is a pool of two seedlings. Statistical analysis by one-way ANOVA with Tukey’s HSD test. Experiment was independently performed twice with similar results.
Figure 5.
Figure 5.. The appearance and leaf microbiota phenotypes of Arabidopsis autoimmune mutants.
a, Images of four-week-old, soil-grown Arabidopsis autoimmune mutants exposed to high humidity (~95% RH) for five days. Top panel, Col-0, tip1 and three previously identified “lesion-mimic” autoimmune mutants; bottom panel, snc1 and three previously identified autoimmune mutants that showed no visible lesions. Scale bar equals 2 cm. b, Population sizes of endophytic leaf microbiota after five days of plant growth under high humidity condition (~95% RH) in tip1 and three previously identified “lesion-mimic” autoimmune mutants. c, Population sizes of endophytic leaf microbiota after five days of plant growth under high humidity in snc1 and three previously identified autoimmune mutants with no visible lesions. Results represent the mean values ± SEM of four biological replicates; each biological replicate contains 1–3 leaves from one plant. Different letters represent a significant difference (p<0.05, one-way ANOVA with Tukey’s HSD test). Experiment was independently performed three times with similar results.
Figure 6.
Figure 6.. Microbiota dependency for autoimmunity in Arabidopsis autoimmune mutants.
a, Five-week-old Col-0, tip1 and three previously identified lesion-mimic autoimmune mutants grown in GnotoPots under holoxenic (top panel) or axenic (lower panel) conditions. Scale bar equals 2 cm. Zoomed in images (white squares) on leaf lesions are shown in Extended Data Figure 7a. b, Five-week-old Col-0, snc1 and three previously identified autoimmune mutants that showed no visible lesions were grown in GnotoPots under holoxenic (upper panel) or axenic (lower panel) conditions. Scale bar equals 2 cm. c,d, PR1 expression in tip1 and three previously identified lesion-mimic autoimmune mutants (c) and snc1 and three autoimmune mutants (d) grown in GnotoPots under axenic (left; with diagonal stripe pattern) or holoxenic (right) conditions. Results represent the mean values ± SEM of four biological replicates. Each biological replicate is a pool of two plants. Different letters and “*” represent a significant difference (p<0.05, one-way ANOVA). Experiment was independently performed twice with similar results.
Figure 7.
Figure 7.. Microbiota dependency for autoimmunity in Arabidopsis natural accessions.
a, Images of five-week-old, potting soil-grown Arabidopsis accessions (Col-0, Est-1 and C24) exposed to high humidity (~95% RH) for seven days. Scale bar equals 2 cm. b, Population sizes of leaf endophytic microbiota after seven days of plant growth under high humidity condition (~95% RH). Results represent the mean values ± SEM of six plants. Statistical analysis was performed using one-way ANOVA with Tukey’s HSD test. Experiment was independently performed three times with similar results. c, Five-week-old Arabidopsis accessions grown using GnotoPots under holoxenic (upper panel) or axenic (lower panel) conditions. Scale bar equals 2 cm. Zoomed in image (white square) on Est-1 leaf lesions is shown in Extended Data Figure 7b. d, PR1 expression in Arabidopsis accessions grown in GnotoPots under axenic (left; with diagonal stripe pattern) or holoxenic (right) conditions. Results represent the mean values ± SEM of three biological replicates. Each biological replicate is a pool of two plants. Statistical analysis by one-way ANOVA with Tukey’s HSD test. Experiment was independently performed twice with similar results.

References

    1. Staskawicz B. J., Ausubel F. M., Baker B. J., Ellis J. G. & Jones J. D. Molecular genetics of plant disease resistance. Science 268, 661–667 (1995). 10.1126/science.7732374 - DOI - PubMed
    1. Jones J. D. & Dangl J. L. The plant immune system. Nature 444, 323–329 (2006). 10.1038/nature05286 - DOI - PubMed
    1. Ngou B. P. M., Ding P. & Jones J. D. G. Thirty years of resistance: Zig-zag through the plant immune system. Plant Cell 34, 1447–1478 (2022). 10.1093/plcell/koac041 - DOI - PMC - PubMed
    1. Lewis J. D., Guttman D. S. & Desveaux D. The targeting of plant cellular systems by injected type III effector proteins. Semin Cell Dev Biol 20, 1055–1063 (2009). 10.1016/j.semcdb.2009.06.003 - DOI - PubMed
    1. Dou D. & Zhou J. M. Phytopathogen effectors subverting host immunity: different foes, similar battleground. Cell Host Microbe 12, 484–495 (2012). 10.1016/j.chom.2012.09.003 - DOI - PubMed

Publication types