[Preprint]. 2023 Aug 25:2023.03.07.23286766.
doi: 10.1101/2023.03.07.23286766.

Mapping Dysfunctional Circuits in the Frontal Cortex Using Deep Brain Stimulation

Affiliations

Mapping Dysfunctional Circuits in the Frontal Cortex Using Deep Brain Stimulation

Barbara Hollunder et al. medRxiv. .

Update in

  • Mapping dysfunctional circuits in the frontal cortex using deep brain stimulation.
    Hollunder B, Ostrem JL, Sahin IA, Rajamani N, Oxenford S, Butenko K, Neudorfer C, Reinhardt P, Zvarova P, Polosan M, Akram H, Vissani M, Zhang C, Sun B, Navratil P, Reich MM, Volkmann J, Yeh FC, Baldermann JC, Dembek TA, Visser-Vandewalle V, Alho EJL, Franceschini PR, Nanda P, Finke C, Kühn AA, Dougherty DD, Richardson RM, Bergman H, DeLong MR, Mazzoni A, Romito LM, Tyagi H, Zrinzo L, Joyce EM, Chabardes S, Starr PA, Li N, Horn A. Hollunder B, et al. Nat Neurosci. 2024 Mar;27(3):573-586. doi: 10.1038/s41593-024-01570-1. Epub 2024 Feb 22. Nat Neurosci. 2024. PMID: 38388734 Free PMC article.

Abstract

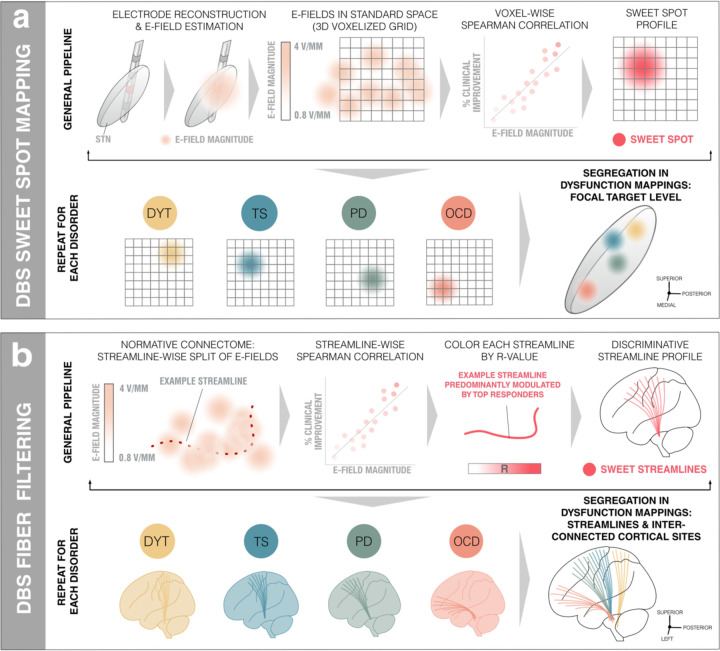
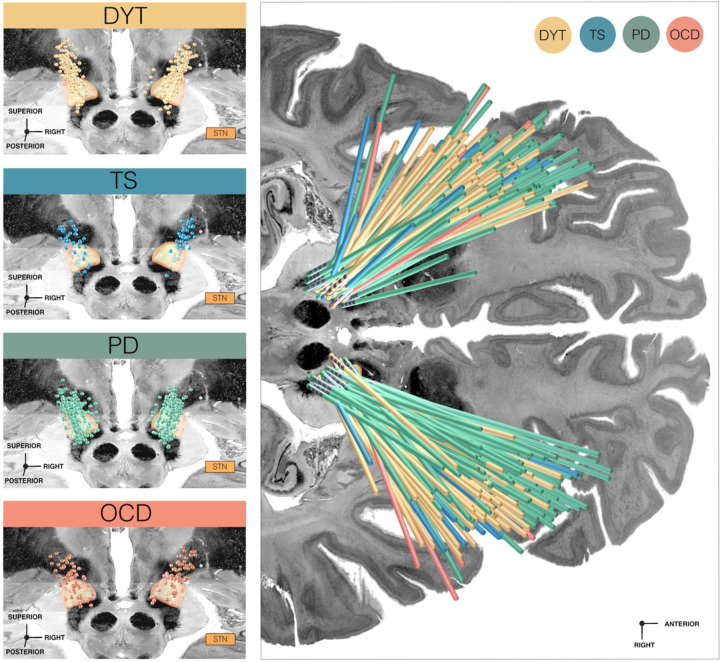
Frontal circuits play a critical role in motor, cognitive, and affective processing - and their dysfunction may result in a variety of brain disorders. However, exactly which frontal domains mediate which (dys)function remains largely elusive. Here, we study 534 deep brain stimulation electrodes implanted to treat four different brain disorders. By analyzing which connections were modulated for optimal therapeutic response across these disorders, we segregate the frontal cortex into circuits that became dysfunctional in each of them. Dysfunctional circuits were topographically arranged from occipital to rostral, ranging from interconnections with sensorimotor cortices in dystonia, with the primary motor cortex in Tourette's syndrome, the supplementary motor area in Parkinson's disease, to ventromedial prefrontal and anterior cingulate cortices in obsessive-compulsive disorder. Our findings highlight the integration of deep brain stimulation with brain connectomics as a powerful tool to explore couplings between brain structure and functional impairment in the human brain.

Keywords: Connectome; Deep Brain Stimulation (DBS); Dystonia; Obsessive-Compulsive Disorder (OCD); Parkinson’s disease (PD); Structural Connectivity; Subthalamic Nucleus (STN); Tourette’s syndrome (TS).


Conflict of interest statement

Declaration of Competing Interests J.L.O. reports research grant support from Medtronic and Boston Scientific and is a consultant for Abbott, outside of the submitted work. M.M.R. reports grant support and honoraria for speaking from Medtronic and Boston Scientific, outside of the submitted work. J.V. reports grants and personal fees from Medtronic Inc., grants, and personal fees from Boston Scientific, personal fees from Abbott, outside of the submitted work. H.B. is consultant of Alpha-Omega, outside of the submitted work. S.C. is consultant for Medtronic and Boston Scientific, outside of the submitted work. A.H. is a consultant for FxNeuromodulation and Abbott, and reports lecture fees from Boston Scientific, outside of the submitted work. B.H., I.A.S., N.R., S.O., K.B., C.N., P.R., P.Z., M.P., H.A., M.V., C.Z., B.S., P.N., F.-C.Y., J.C.B., T.A.D., V.V.-V., E.J.L.A., P.R.F., C.F., A.A.K., P.N., D.D.D., R.M.R., M.R.D., A.M., L.M.R., H.T., L.Z., E.M.J., P.A.S., and N.L. report no competing interests.

Figures

Fig. 1:
Fig. 1:. Overview of the two-fold group-level approach to (sub)cortical dysfunction mapping.
(a) DBS Sweet Spot Mapping . Patient-specific electrode reconstructions were first derived relative to their precise position within the subthalamic nucleus (STN) region and integrated with individual stimulation parameters to estimate electric field magnitudes (E-fields). Subsequently, rank-correlations between E-field magnitudes of the vector and clinical improvements were performed (separately for each disease). Applying this procedure across voxels resulted in a detailed grid of positively (sweet spot) and negatively (sour spot, not shown here) associated stimulation sites. (a) DBS Fiber Filtering . Each streamline within a predefined normative connectome was weighted by its ability to discern optimal from poor responders in each respective cohort. To do so, the peak E-field magnitudes among samples drawn along the course of each streamline were rank-correlated with clinical outcomes. Streamlines predominantly modulated by high E-field magnitudes of good responders received high positive weights (sweet streamlines) whereas those associated with high E-field magnitudes of poor responders were attributed high negative weights (sour streamlines, not shown here).
Fig. 2:
Fig. 2:. Overview of electrode placements relative to the subthalamic nucleus across discovery cohorts.
Left panels: Deep brain stimulation (DBS) electrode placement is shown in relation to a posterior view of the subthalamic nucleus (STN) in dystonia (DYT), Parkinson’s disease (PD), Tourette’s syndrome (TS), and obsessive-compulsive disorder (OCD) cohorts, respectively. Electrode contacts are visualized as point clouds. Right panel: Visualization of all DBS leads of discovery cohorts investigated in the present study are featured in the axial plane and colored according to indication. STN defined by the DBS Intrinsic Template (DISTAL) atlas , with an axial plane of the BigBrain template in 100 µm resolution displayed as a backdrop (y = −5 mm, z = −10 mm).
Fig. 3:
Fig. 3:. Segregation of dysfunction mappings at the subthalamic level by disease-specific stimulation effects.
Middle panel, center: The topographical organization of disorder-specific deep brain stimulation (DBS) sweet spots in dystonia (DYT), Tourette’s syndrome (TS), Parkinson’s disease (PD), and obsessive-compulsive disorder (OCD) is shown as a density cloud plot relative to a three-dimensional model of the left subthalamic nucleus (STN) in template space derived from the DBS Intrinsic Template (DISTAL) atlas . Sphere size and transparency indicate correlation strength between stimulation impact and clinical improvements at a given coordinate, with bigger and less transparent spheres coding for higher correlations. Below, binarized and thresholded sweet spot peaks are projected onto the STN surface. Upper and lower panels: Axial and coronal views of disease-specific sweet and sour spots are displayed relative to the left STN (black outlines), superimposed onto an 100 µm ex-vivo brain template . Voxels are color-coded by degree of correlation (warm colors for positive and cool colors for negative associations) between electric field magnitudes (E-fields) and clinical improvements. Middle panel, left and right: Correlation plots show amounts of clinical outcome variance explained by similarity in E-field peaks with disease-wise models of sweet spots across the cohort, with grey shaded areas representative of 95% confidence intervals. Abbreviations: CV, cross-validation.
Fig. 4:
Fig. 4:. Disease-specific sweet streamline models in each discovery cohort.
(a) Sweet streamlines in dystonia (DYT) (peak R = 0.36), Parkinson’s disease (PD) (peak R = 0.37), Tourette’s syndrome (TS) (peak R = 0.73) and obsessive-compulsive disorder (OCD) (peak R = 0.49) associated with beneficial stimulation outcomes were filtered from a population-based group connectome . The first row demonstrates the set of connections (in white) seeding from stimulation volumes across patients in each of the four disorders. Among these plain connections, only those were isolated via Deep Brain Stimulation (DBS) Fiber Filtering (highlighted in disease-specific color; second row) whose modulation correlated with clinical outcomes (third row). Results are shown against a sagittal slice (x = −5 mm) of the 7T MRI ex-vivo 100 µm human brain template , in conjunction with a three-dimensional model of the right subthalamic nucleus (STN) in template space from the DBS Intrinsic Template (DISTAL) atlas . (b) In-sample correlations and five-fold cross-validations (CV) are reported for models informed on four different normative connectomes. Plots in the top row represent the fitting of a linear model to determine the degree to which overlap of electric field magnitudes with selected HCP 985 Connectome streamlines explains clinical outcome variance across the cohort. Grey shaded areas indicate 95% confidence intervals. Abbreviation: MGH, Massachusetts General Hospital.
Fig. 5:
Fig. 5:. Topography of streamlines and interconnected cortical sites associated with therapeutic stimulation effects in each discovery cohort.
(a) Segregation into therapeutic networks is achieved by means of deep brain stimulation (DBS) Fiber Filtering in dystonia (DYT), Parkinson’s disease (PD), Tourette’s syndrome (TS) and obsessive-compulsive disorder (OCD). Disease-specific optimal streamlines were isolated from a high-resolution normative group connectome through association with clinical effects in each disorder and displayed against a sagittal slice (x = −5 mm) of a brain cytoarchitecture atlas in ICBM 2009b Non-linear Asymmetric (“MNI”) space . (b) Streamlines are shown in conjunction with a transparent brain in template space along with delineations that are color-coded by disease. (c) To derive the cortical topography of dysfunction mappings, smoothed density maps of sweet streamlines were projected onto a brain template in MNI space. Zoom-in circles show disease-wise interconnected cortical sites, anatomically characterized based on the Johns Hopkins University (JHU) atlas parcellation . Legend of relevant regions, with corresponding JHU atlas denominators in brackets: 1 (JHU: 23 & 24), postcentral gyrus; 2 (1 & 2), superior frontal gyrus (posterior segment); 3 (3 & 4), superior frontal gyrus (prefrontal cortex); 4 (25 & 26), precentral gyrus; 5 (5 & 6), superior frontal gyrus (frontal pole); 6 (9 & 10), middle frontal gyrus (dorsal prefrontal cortex); 7 (17 & 18), lateral fronto-orbital gyrus; 8 (13 & 14), inferior frontal gyrus pars orbitalis; 9 (15 & 16), inferior frontal gyrus pars triangularis.
Fig. 6:
Fig. 6:. Retrospective and prospective validations of therapeutic streamline targets.
To probe the validity of Parkinson’s disease (PD) and obsessive-compulsive disorder (OCD) streamline models, five validation experiments were carried out. (a) First and second, empirical outcomes of two additional independent datasets could significantly be estimated based on the degree of overlap of their stimulation volumes with the streamline models. (b) Third and fourth, prospective reprogramming was undertaken in two patients. In the PD patient, directional electrodes had been implanted, so the current was divided using a 70/30% rule based on the contacts with the strongest and second-to-strongest streamline overlaps. This led to an improvement of 71% on the Unified Parkinson’s Disease Rating Scale – Part III (UPDRS-III), compared to 60% using clinical settings. In the OCD case, the contact was selected based on visual inspection with the streamline model by the clinical team. This led to a reduction of 37% on the Yale-Brown Obsessive-Compulsive Scale (Y-BOCS), compared to 17% under clinician-selected parameters. (c) Fifth, a prospective case underwent streamline-guided deep brain stimulation (DBS) surgery. Electrodes were activated at the contact with the highest streamline overlaps (most ventral contacts on both sides), leading to a rapid Y-BOCS reduction of 77% already one month post-surgically. Depending on the respective target, reconstructed electrodes and stimulation volumes are featured relative to three-dimensional models of the subthalamic nucleus (STN) from the DBS Intrinsic Template (DISTAL) atlas , or of the nucleus accumbens (Nac) from the California Institute of Technology reinforcement learning (CIT168) atlas , and against anatomical slices of a 100 µm ex-vivo brain template .
Fig. 7:
Fig. 7:. Conserved segregation of dysfunction mappings among indirect pallido-subthalamic connections.
Disease-wise sweet streamlines retain a high degree of specificity along their indirect pathway trajectory interconnecting the subthalamic nucleus (STN) with the internal (GPi) and external pallidum (Gpe). Connectivity is modeled based on the Basal Ganglia Pathway Atlas . Sweet streamlines associated with optimal deep brain stimulation (DBS) outcomes in dystonia (DYT) are interconnected with sensorimotor (a), in Tourette’s syndrome (TS) with associative (b), in Parkinson’s disease (PD) with premotor (c), and in obsessive-compulsive disorder (OCD) with limbic (d) STN territories. Streamlines are displayed relative to several anatomical structures from the DBS Intrinsic Template (DISTAL) atlas and in conjunction with an axial slice (z = −10 mm) of the BigBrain template . Abbreviations: ass. STN, associative territory of the subthalamic nucleus; limb. STN, limbic territory of the subthalamic nucleus; motor STN, motor territory of the subthalamic nucleus; RN, red nucleus.

References

    1. Horn A. & Fox M. D. Opportunities of connectomic neuromodulation. Neuroimage 221, 117180 (2020). - PMC - PubMed
    1. Siddiqi S. H., Kording K. P., Parvizi J. & Fox M. D. Causal mapping of human brain function. Nat. Rev. Neurosci. 361–375 (2022) doi: 10.1038/s41583-022-00583-8. - DOI - PMC - PubMed
    1. Hollunder B. et al. Toward personalized medicine in connectomic deep brain stimulation. Prog. Neurobiol. 210, 102211 (2022). - PubMed
    1. Grill W. M., Snyder A. N. & Miocinovic S. Deep brain stimulation creates an informational lesion of the stimulated nucleus. Neuroreport 15, 1137–1140 (2004). - PubMed
    1. Bonelli R. M. & Cummings J. L. Frontal-subcortical circuitry and behavior. Dialogues Clin. Neurosci. 9, 141–151 (2007). - PMC - PubMed

Publication types