[Preprint]. 2023 Mar 8:2023.03.07.531525.
doi: 10.1101/2023.03.07.531525.

Dissecting embryonic and extra-embryonic lineage crosstalk with stem cell co-culture

Affiliations

Dissecting embryonic and extra-embryonic lineage crosstalk with stem cell co-culture

Yulei Wei et al. bioRxiv. .

Update in

Abstract

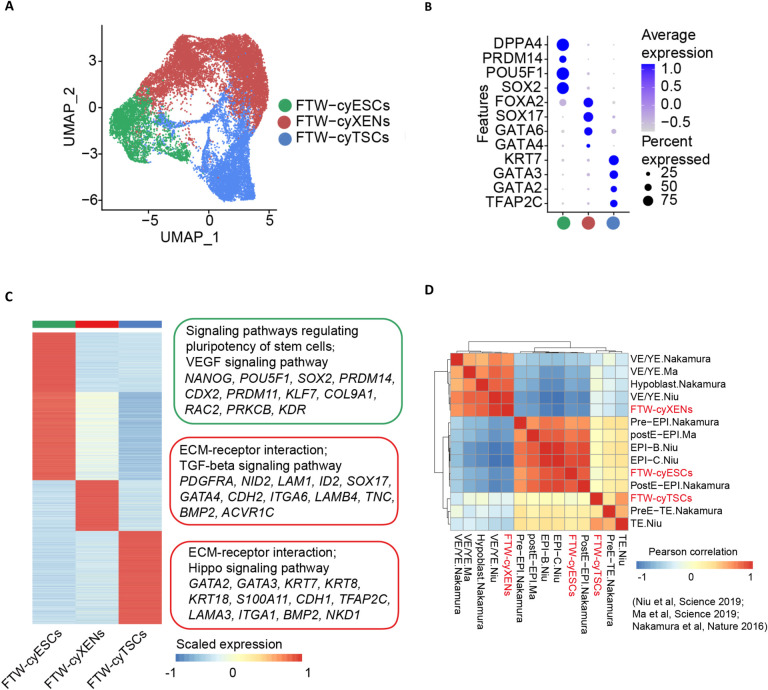
Faithful embryogenesis requires precise coordination between embryonic and extraembryonic tissues. Although stem cells from embryonic and extraembryonic origins have been generated for several mammalian species(Bogliotti et al., 2018; Choi et al., 2019; Cui et al., 2019; Evans and Kaufman, 1981; Kunath et al., 2005; Li et al., 2008; Martin, 1981; Okae et al., 2018; Tanaka et al., 1998; Thomson et al., 1998; Vandevoort et al., 2007; Vilarino et al., 2020; Yu et al., 2021b; Zhong et al., 2018), they are grown in different culture conditions with diverse media composition, which makes it difficult to study cross-lineage communication. Here, by using the same culture condition that activates FGF, TGF-β and WNT signaling pathways, we derived stable embryonic stem cells (ESCs), extraembryonic endoderm stem cells (XENs) and trophoblast stem cells (TSCs) from all three founding tissues of mouse and cynomolgus monkey blastocysts. This allowed us to establish embryonic and extraembryonic stem cell co-cultures to dissect lineage crosstalk during early mammalian development. Co-cultures of ESCs and XENs uncovered a conserved and previously unrecognized growth inhibition of pluripotent cells by extraembryonic endoderm cells, which is in part mediated through extracellular matrix signaling. Our study unveils a more universal state of stem cell self-renewal stabilized by activation, as opposed to inhibition, of developmental signaling pathways. The embryonic and extraembryonic stem cell co-culture strategy developed here will open new avenues for creating more faithful embryo models and developing more developmentally relevant differentiation protocols.


Conflict of interest statement

DECLARATION OF INTERESTS Y.W., L.Y., T.T. and J.W. are inventors on a patent application (applied through the Board of Regents of The University of Texas System, application number 63/488,401) entitled “Methods For the Derivation Culture Of Embryonic and Extra-Embryonic Stem Cells” arising from this work. The other authors declare no competing interests.

Figures

Figure 1.
Figure 1.. Derivation and characterization of embryonic and extraembryonic stem cells from mouse blastocyst.
(A) Schematic of derivation of FTW embryonic and extraembryonic stem cell lines from mouse blastocyst. (B) Representative bright field (BF) images of colonies of FTW-mXENs, FTW-mTSCs and FTW-mESCs. Scale bar, 100 μm. (C) Representative immunofluorescence (IF) images of extraembryonic endoderm (GATA6 and SOX17), trophoblast (EOMES and CDX2), and epiblast (SOX2 and OCT4) lineage markers in FTW-mXENs (top), FTW-mTSCs (middle), and FTW-mESCs (bottom), respectively. Scale bar, 100 μm. (D) and (F) Representative BF and fluorescence images showing chimera contribution of GFP-labeled FTW-mXENs (D) and FTW-mTSCs (F) to E11.5 mouse conceptuses. Scale bar, 1 mm. (E) IF staining of a chimeric yolk sac membrane for GFP, GATA6 and GATA4. (G) IF staining of a chimeric sagittal placental section for CK8 and GFP. Different layers of the placenta are delineated by dotted lines. Scale bar, 100 μm. See also Figure S1.
Figure 2.
Figure 2.. Transcriptomic analyses of mouse FTW stem cells.
(A) UMAP visualization of integrative analysis of FTW-mXENs, FTW-mTSCs, FTW-mESCs and published datasets of mPSCs(Bao et al., 2018; Cruz-Molina et al., 2017; Wu et al., 2015; Ye et al., 2018; Zhao et al., 2015), mTSCs(Cui et al., 2019; Kubaczka et al., 2015; Wu et al., 2011) and mXENs(Anderson et al., 2017; Zhong et al., 2018). (B) Correlation analysis of FTW-mXENs, FTW-mTSCs and FTW-mXENs with published scRNA-seq dataset of in vivo mouse embryos from different stages. (C) UMAP analysis of mouse blastocysts, blastocyst outgrowths, and stable (passage 10) FTW-mESCs, FTW-mXENs and FTW-mTSCs. (D) to (F) Heatmaps and GO terms analysis of stage-specific (blastocyst, blastocyst outgrowth and stable FTW stem cells) genes from three lineages during FTW stem cells derivation. See also Figure S2.
Figure 3.
Figure 3.. Proliferation restriction of FTW-mESCs by FTW-mXENs.
(A) Schematic of the establishment of FTW stem cell co-cultures to study cross-lineage communications. (B) Representative fluorescence and BF merged images of day 1 to day 5 separately cultured FTW-mESCs (green) and FTW-mESCs co-cultured with FTW-mXENs (red) and/or FTW-mTSCs (blue arrowheads), or proliferative mouse embryonic fibroblast. Scale bar, 100 μm. (C) Violin plot showing area multiplied by GFP intensity for each FTW-mESC colonies in day 5 separate and different co-cultures. (D) Growth curves of separate (FTW-mESCs) and co-cultures (mESCs/mXENs) from days 1 to 5 (mean ± SD, day 1, n = 2, day 2–5, n = 5, biological replicates). (E) Schematic of teratoma formation with FTW-mESCs only and FTW-mESCs co-injected with FTW-mXENs (mESCs:mXENs = 4:1). The same number (1 × 10⁶) of FTW-mESCs were injected in each condition. (F) Images of teratomas generated from FTW-mESCs injected with (bottom) and without (top) FTW-mXENs. (G) Lengths and widths of teratomas generated from FTW-mESCs injected with (orange) and without (green) FTW-mXENs. (H) Weight of teratomas generated from FTW-mESCs injected with (orange) and without (green) FTW-mXENs. (mean ± SD, n = 5, biological replicates). (I) Schematic of tissue dissection of E6.5–6.75 mouse conceptus. (J) Representative BF images showing ex vivo culture of EPI+VE (VE+) and EPI (VE−) tissues isolated from E6.5–6.75 mouse conceptuses at indicated time points. Scale bar, 100 μm. (K) Total cell number of VE+ and VE− tissues after 48 h ex vivo culture (mean ± SD, n = 10, biological replicates). N.S. not significant, ****P-value < 0.0001, P-values were calculated using two-tailed Student’s t test. See also Figure S3.
Figure 4.
Figure 4.. Mechanistic insights of growth inhibition.
(A) Schematic of RNA-seq experiments. (B) Bar graphs showing the number (left) and strength (right) of cell-cell interactions in co-cultures and separate cultures. (C) Circle plots showing the ratios of number (left) and strength (right) of cell-cell interactions between co-cultured and separately cultured samples. Red lines, increased interactions; blue lines, decreased interactions. (D) Heatmaps of outgoing signaling patterns (left) and incoming signaling patterns (right) in co-cultured mouse FTW stem cells. (E) Violin plot showing area multiplied by GFP intensity for each FTW-mESC colonies in day 5 separate and co-cultures (mESCs: mXENs = 2:1 or 1:1) as well as separate cultures supplemented with different ECM proteins. Matrigel_L: 0.5% (v/v), Matrigel_H: 2% (v/v), Laminin_L: 30 μg/ml, Laminin_H: 120 μg/ml, Collagen_L: 15 μg/ml, Collagen_H: 60 μg/ml, Vitronectin_L: 5 μg/ml, Vitronectin_H: 30 μg/ml. N.S. not significant. (F) Violin plot showing area multiplied by GFP intensity for each FTW-mESC colonies in different conditions. (G) Schematic summary of mechanistic insights of the observed proliferation inhibition of FTW-mESCs by FTW-mXENs. N.S. not significant, ****P-value < 0.0001. P-values were calculated using two-tailed Student’s t test. See also Figure S4.
Figure 5.
Figure 5.. Cynomolgus monkey embryonic and extraembryonic stem cells derivation
(A) Schematic of derivation of FTW embryonic and extra-embryonic stem cell lines from cynomolgus monkey blastocyst. (B) Representative BF images of a 10 d.p.f monkey blastocyst, day 12 outgrowth and stable FTW-cyXENs (passage 14). Scale bars, 50 μm. (C) Representative BF images of a 10 d.p.f monkey blastocyst, day 12 outgrowth and stable FTW-cyTSCs (passage 10). Scale bars, 50 μm. (D) Representative BF images of a 7 d.p.f monkey blastocyst, day 7 outgrowth, FTW-cyESCs, passage 7. Scale bars, 50 μm. (E) Representative IF images of monkey extra-embryonic endoderm (GATA6 and GATA4), trophoblast (GATA3 and CK7), and epiblast (OCT4 and SOX2) lineage markers in FTW-cyXENs (top), FTW-cyTSCs (middle), and FTW-cyESCs (bottom), respectively. Scale bar, 100 μm. (F) Representative IF co-staining images of COL6A1, FOXA1, and GATA4 in differentiated FTW-cyXENs at day 9. Blue, DAPI. Scale bars, 100 μm. (G) Representative IF co-staining images of GATA3 with the EVT maker HLAG in SCT-like cells differentiated from FTW-cyTSCs. (H) Representative IF co-staining images of GATA3 with the EVT makers HCG and HCGB in EVT-like cells differentiated from FTW-cyTSCs. See also Figure S5.
Figure 6.
Figure 6.. Transcriptomic analyses of cynomolgus monkey FTW stem cells.
(A) UMAP analysis of FTW-cyXENs, FTW-cyTSCs and FTW-cyESCs. (B) Bubble plot showing the expression patterns of lineage makers in FTW-cyXENs, FTW-cyTSCs and FTW-cyESCs. (C) A heatmap showing the DEGs of FTW-cyESCs, FTW-cyXENs and FTW-cyTSCs, Selected genes from the DEGs and top two enriched GO terms were shown on the right. (D) Correlation analysis of FTW-cyXENs, FTW-cyTSCs, FTW-cyESCs and published datasets from cynomolgus monkey conceptuses.
Figure 7.
Figure 7.. Cynomolgus monkey embryonic and extraembryonic stem cells co-cultures.
(A) Representative fluorescence and BF merged images of day 1 to day 5 separately cultured FTW-cyESCs (green) and FTW-mESCs co-cultured with FTW-cyXENs (red arrowheads) and/or FTW-cyTSCs (blue arrowheads), or proliferative fibroblast. Scale bar, 100 μm. (B) Violin plot showing area multiplied by GFP intensity for each FTW-mESC colonies in different conditions. (C) Heatmaps of outgoing signaling patterns (left) and incoming signaling patterns (right) in co-cultured cynomolgus FTW stem cells. (D) Violin plot showing area multiplied by GFP intensity for each FTW-cyESC colonies in day 5 separate and co-cultures (cyESCs: cyXENs = 1:3.5 or 1:7) as well as separate cultures supplemented with different ECM proteins. Matrigel_L: 0.5% (v/v), Matrigel_H: 2% (v/v), Laminin_L: 2.5 μg/ml, Laminin_H: 10 μg/ml, Collagen_L: 15 μg/ml, Collagen_H: 60 μg/ml. *P-value < 0.05, ****P-value < 0.0001. P-values were calculated using two-tailed Student’s t test. See also Figure S6.

Similar articles

References

    1. Aibar S., González-Blas C.B., Moerman T., Huynh-Thu V.A., Imrichova H., Hulselmans G., Rambow F., Marine J.-C., Geurts P., Aerts J., et al. (2017). SCENIC: single-cell regulatory network inference and clustering. Nature Methods 14, 1083–1086. 10.1038/nmeth.4463. - DOI - PMC - PubMed
    1. Anderson K.G.V., Hamilton W.B., Roske F.V., Azad A., Knudsen T.E., Canham M.A., Forrester L.M., and Brickman J.M. (2017). Insulin fine-tunes self-renewal pathways governing naive pluripotency and extra-embryonic endoderm. Nat Cell Biol 19, 1164–1177. 10.1038/ncb3617. - DOI - PubMed
    1. Angel P., Imagawa M., Chiu R., Stein B., Imbra R.J., Rahmsdorf H.J., Jonat C., Herrlich P., and Karin M. (1987). Phorbol ester-inducible genes contain a common cis element recognized by a TPA-modulated trans-acting factor. Cell 49, 729–739. 10.1016/0092-8674(87)90611-8. - DOI - PubMed
    1. Angel P., and Karin M. (1991). The role of Jun, Fos and the AP-1 complex in cell-proliferation and transformation. Biochim Biophys Acta 1072, 129–157. 10.1016/0304-419x(91)90011-9. - DOI - PubMed
    1. Artus J., Douvaras P., Piliszek A., Isern J., Baron M.H., and Hadjantonakis A.K. (2012). BMP4 signaling directs primitive endoderm-derived XEN cells to an extraembryonic visceral endoderm identity. Dev Biol 361, 245–262. 10.1016/j.ydbio.2011.10.015. - DOI - PMC - PubMed

Publication types