[Preprint]. 2023 Mar 10:2023.03.10.531987.
doi: 10.1101/2023.03.10.531987.

Leveraging Base Pair Mammalian Constraint to Understand Genetic Variation and Human Disease

Affiliations

Leveraging Base Pair Mammalian Constraint to Understand Genetic Variation and Human Disease

Patrick F Sullivan et al. bioRxiv. .

Update in

  • Leveraging base-pair mammalian constraint to understand genetic variation and human disease.
    Sullivan PF, Meadows JRS, Gazal S, Phan BN, Li X, Genereux DP, Dong MX, Bianchi M, Andrews G, Sakthikumar S, Nordin J, Roy A, Christmas MJ, Marinescu VD, Wang C, Wallerman O, Xue J, Yao S, Sun Q, Szatkiewicz J, Wen J, Huckins LM, Lawler A, Keough KC, Zheng Z, Zeng J, Wray NR, Li Y, Johnson J, Chen J; Zoonomia Consortium§; Paten B, Reilly SK, Hughes GM, Weng Z, Pollard KS, Pfenning AR, Forsberg-Nilsson K, Karlsson EK, Lindblad-Toh K. Sullivan PF, et al. Science. 2023 Apr 28;380(6643):eabn2937. doi: 10.1126/science.abn2937. Epub 2023 Apr 28. Science. 2023. PMID: 37104612 Free PMC article.

Abstract

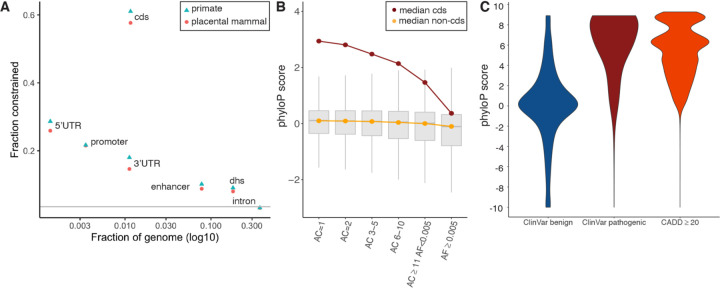
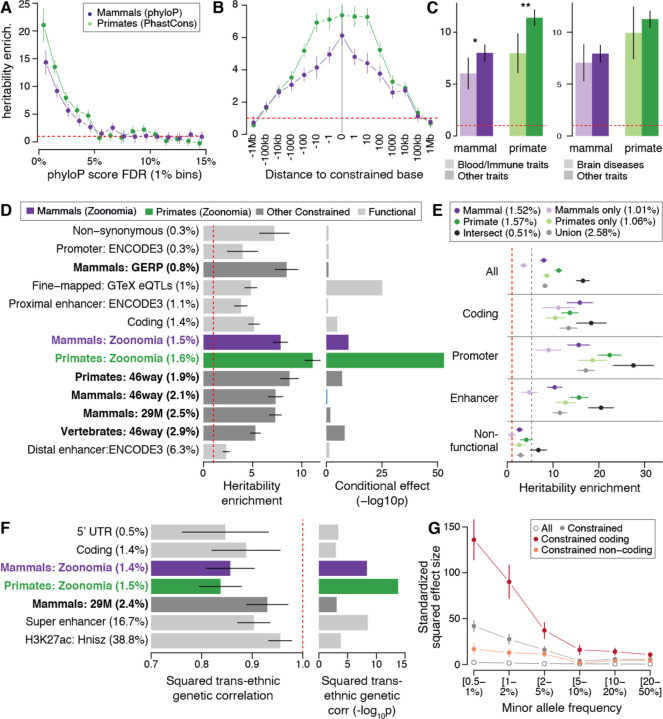
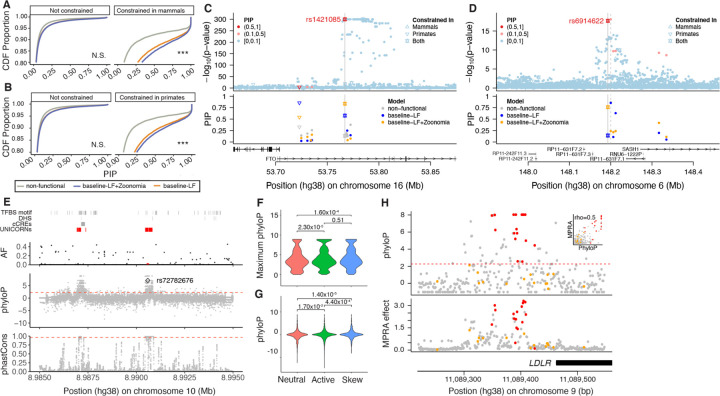
Although thousands of genomic regions have been associated with heritable human diseases, attempts to elucidate biological mechanisms are impeded by a general inability to discern which genomic positions are functionally important. Evolutionary constraint is a powerful predictor of function that is agnostic to cell type or disease mechanism. Here, single base phyloP scores from the whole genome alignment of 240 placental mammals identified 3.5% of the human genome as significantly constrained, and likely functional. We compared these scores to large-scale genome annotation, genome-wide association studies (GWAS), copy number variation, clinical genetics findings, and cancer data sets. Evolutionarily constrained positions are enriched for variants explaining common disease heritability (more than any other functional annotation). Our results improve variant annotation but also highlight that the regulatory landscape of the human genome still needs to be further explored and linked to disease.


Conflict of interest statement

Competing interests

PFS is a consultant and shareholder for Neumora.

Figures

Fig. 1.
Fig. 1.
(A) Evolutionary constraint in multiple genomic partitions. X-axis=fraction of the genome occupied by a partition, Y-axis=fraction of partition under constraint in placental mammals (orange circles) and primates (blue triangles), grey line is the genome mean (0.035). The greatest constraint is found in CDS and key regulatory regions (5’UTR, ENCODE promoter-like elements, and 3’UTR). This figure is a subset of fig. S1 which shows more biotypes, protein-coding gene parts, and regulatory regions. (B) Whisker plots of constraint in variants from TOPMed WGS, stratified by CDS (red, 6.14 million biallelic SNPs) and non-CDS variants (orange, 549.64 million biallelic SNPs). X=six allele count (AC) bins, from singletons (AC=1, 44.8%) to common variants (allele frequency, AF ≥ 0.005, 1.4%). (C) PhyloP score density for ClinVar benign (N=231,642), ClinVar pathogenic (N=73,885), and gnomAD WGS variant positions with CADD ≥ 20 (N=3,958,488).
Fig. 2.
Fig. 2.. SNP-heritability analyses of variants at constrained positions in human complex traits and diseases.
(A) Heritability enrichment of common SNPs in the top percentiles of constraint scores in placental mammals (phyloP) and primates (phastCons). (B) Heritability enrichment as a function of the distance to a constrained base. (C) Heritability enrichment of constrained annotations in 11 blood and immune traits and 9 brain diseases (light color) versus other types of traits (dark color). Asterisks indicate significance at P < 0.05 and double Asterisks indicate significance at P < 0.05 after Bonferroni correction (0.05/4). (D) Heritability enrichment of constrained and functional annotations (left), and corresponding significance of the conditional effect while considered in a joint model with 106 annotations (right). (E) Heritability enrichment of constrained annotations intersected together and stratified by their genomic function. The dashed grey line represents heritability enrichment in coding regions (plotted for comparison purposes). (F) Squared trans-ancestry genetic correlation enrichment (left) with corresponding significance (right) for 7 annotations with significant depletion of squared trans-ancestry genetic correlations. (G) Standardized squared effect sizes as a function of allele frequency. Results are meta-analyzed across 63 independent GWAS (A, B, C, E), 31 independent traits with GWAS available in European and Japanese populations (F), and 27 independent UK Biobank traits (G). Dashed red lines represent a null enrichment of 1 (A-E) and a null squared trans-ancestry genetic correlation (f). Error bars are 95% confidence intervals. Numerical results are reported in tables S2, S3, S4, S6, S7, S8, and S11.
Fig. 3.
Fig. 3.. Leveraging constraint to move from prioritization to function.
(A,B) We report the cumulative distribution function (CDF) of posterior inclusion probability (PIP) scores using functionally-informed fine-mapping with different models of functional annotations. Distribution functions are split into subpanels by whether the fine-mapped SNP overlaps high constraint scores in mammals (A) and primates (B). One-way Komolgorov-Smirnov tests that CDF for PIP obtained from the baselineLF model (gray) are lower (above) than the CDF for PIP obtained from the baseline-LF+Zoonomia model (orange) with Bonferroni correction for N=4 categories across panels (*** p/N < 0.0001, N.S. not significant). (C,D) Examples of constrained fine-mapped variants. We report GWAS P-values (upper panel) and corresponding PIP under different functionally informed fine-mapping models (lower panel). Shape of the dots corresponds to constraint information. (E) Fine-mapped variants are not limited to the annotated genome as exemplified by rs72782676 (red dot in AF panel) in the GATA3 UNannotated Intergenic COnstraint RegioN (UNICORN) locus. (F,G) Constraint is formally linked to function via massively parallel reporter assays (MPRAs) at the (F) regional oligo and (G) base pair level for neutral, active and allele specific skewed effect. (H) For the LDLR promoter locus, MPRA effect is strongly correlated with phyloP score. Constrained (red), and unconstrained (orange) ClinVar pathogenic variants are plotted to highlight known deleterious positions.
Fig. 4.
Fig. 4.. Evolutionary constraint, protein-coding genes, and human disease.
(A) Scatterplot of protein-coding (PC) gene clustering (UMAP and DBSCAN). X- and Y-axis are the UMAP coordinates. Each point is a PC gene (N = 19,386). Five clusters are labeled: A = 56 genes whose CDS bases are in complex regions that align poorly; B = 221 genes apparently human- or primate-specific; C=669 genes with good alignment and possible human-specific functions (e.g., five HLA genes and 14 interferon alpha genes); D=15 genes, all highly constrained; and E = all other 18,425 PC genes. Coloring shows fracCdsCons, grey = least and red = most constrained with an anticlockwise gradient in mammalian constraint from upper middle to lower right. (B, C) Gene constraint deciles versus external gene sets as “lollipop plots”. Each panel has 6 subgraphs for autosomal recessive genes, ClinGen level 3 genes, essential genes from Hart, essential genes in mouse, olfactory receptors, and severe haploinsufficiency genes. X-axis = constraint decile (0 = least,, 9=most constrained, 99 = missing). Y-axis = circles are the fraction of the PC genes in a gene set in each decile. (B) Zoonomia fracCdsCons and (C) recapitulates Figure 3 from ref. (3) with LOEUF decile reversed and showing missing data. (D, H) Gene heritability enrichment for SNPs linked to genes of each decile of fracCdsCons (D) and of SNPs linked to genes of decile of constraint in different gene gene features (H). Dashed red lines represent a null enrichment of 1. Error bars are 95% confidence intervals. (E) Spearman correlation of constraint fraction between the parts of PC genes. (F, G) Fraction of CDS constraint (fracCdsCons) vs. fraction or promoter constraint (F) and fraction of distal enhancer constraint (shrinked to values <0.3) (G). Each point is a PC gene, and HOX genes (purple) and defensin beta (DEFB) genes (green) are highlighted.
Fig. 5.
Fig. 5.. Cancer driver genes identified using NCCM rates.
(A) Distribution of the rates of NCCM for medulloblastoma. (B) An example set of the candidate driver genes found either in pediatric (orange) or adult (purple) samples. Age of diagnosis (years) of the patient is indicated together with the tumor subgroup. (C) ZFHX4 locus contains 9 NCCMs drawn from 8 patients.

References

    1. ENCODE Project Consortium, Moore J. E., Purcaro M. J., Pratt H. E., Epstein C. B., Shoresh N., Adrian J., Kawli T., Davis C. A., Dobin A., Kaul R., Halow J., Van Nostrand E. L., Freese P., Gorkin D. U., Shen Y., He Y., Mackiewicz M., Pauli-Behn F., Williams B. A., Mortazavi A., Keller C. A., Zhang X.-O., Elhajjajy S. I., Huey J., Dickel D. E., Snetkova V., Wei X., Wang X., Rivera-Mulia J. C., Rozowsky J., Zhang J., Chhetri S. B., Zhang J., Victorsen A., White K. P., Visel A., Yeo G. W., Burge C. B., Lécuyer E., Gilbert D. M., Dekker J., Rinn J., Mendenhall E. M., Ecker J. R., Kellis M., Klein R. J., Noble W. S., Kundaje A., Guigó R., Farnham P. J., Cherry J. M., Myers R. M., Ren B., Graveley B. R., Gerstein M. B., Pennacchio L. A., Snyder M. P., Bernstein B. E., Wold B., Hardison R. C., Gingeras T. R., Stamatoyannopoulos J. A., Weng Z., Expanded encyclopaedias of DNA elements in the human and mouse genomes. Nature. 583, 699–710 (2020). - PMC - PubMed
    1. GTEx Consortium, The GTEx Consortium atlas of genetic regulatory effects across human tissues. Science. 369, 1318–1330 (2020). - PMC - PubMed
    1. Karczewski K. J., Francioli L. C., Tiao G., Cummings B. B., Alföldi J., Wang Q., Collins R. L., Laricchia K. M., Ganna A., Birnbaum D. P., Gauthier L. D., Brand H., Solomonson M., Watts N. A., Rhodes D., Singer-Berk M., England E. M., Seaby E. G., Kosmicki J. A., Walters R. K., Tashman K., Farjoun Y., Banks E., Poterba T., Wang A., Seed C., Whiffin N., Chong J. X., Samocha K. E., Pierce-Hoffman E., Zappala Z., O’Donnell-Luria A. H., Minikel E. V., Weisburd B., Lek M., Ware J. S., Vittal C., Armean I. M., Bergelson L., Cibulskis K., Connolly K. M., Covarrubias M., Donnelly S., Ferriera S., Gabriel S., Gentry J., Gupta N., Jeandet T., Kaplan D., Llanwarne C., Munshi R., Novod S., Petrillo N., Roazen D., Ruano-Rubio V., Saltzman A., Schleicher M., Soto J., Tibbetts K., Tolonen C., Wade G., Talkowski M. E., Neale B. M., Daly M. J., MacArthur D. G., The mutational constraint spectrum quantified from variation in 141,456 humans. Nature. 581, 434–443 (2020). - PMC - PubMed
    1. Taliun D., Harris D. N., Kessler M. D., Carlson J., Szpiech Z. A., Torres R., Taliun S. A. G., Corvelo A., Gogarten S. M., Kang H. M., Pitsillides A. N., LeFaive J., Lee S.-B., Tian X., Browning B. L., Das S., Emde A.-K., Clarke W. E., Loesch D. P., Shetty A. C., Blackwell T. W., Smith A. V., Wong Q., Liu X., Conomos M. P., Bobo D. M., Aguet F., Albert C., Alonso A., Ardlie K. G., Arking D. E., Aslibekyan S., Auer P. L., Barnard J., Barr R. G., Barwick L., Becker L. C., Beer R. L., Benjamin E. J., Bielak L. F., Blangero J., Boehnke M., Bowden D. W., Brody J. A., Burchard E. G., Cade B. E., Casella J. F., Chalazan B., Chasman D. I., Chen Y.-D. I., Cho M. H., Choi S. H., Chung M. K., Clish C. B., Correa A., Curran J. E., Custer B., Darbar D., Daya M., de Andrade M., DeMeo D. L., Dutcher S. K., Ellinor P. T., Emery L. S., Eng C., Fatkin D., Fingerlin T., Forer L., Fornage M., Franceschini N., Fuchsberger C., Fullerton S. M., Germer S., Gladwin M. T., Gottlieb D. J., Guo X., Hall M. E., He J., Heard-Costa N. L., Heckbert S. R., Irvin M. R., Johnsen J. M., Johnson A. D., Kaplan R., Kardia S. L. R., Kelly T., Kelly S., Kenny E. E., Kiel D. P., Klemmer R., Konkle B. A., Kooperberg C., Köttgen A., Lange L. A., Lasky-Su J., Levy D., Lin X., Lin K.-H., Liu C., Loos R. J. F., Garman L., Gerszten R., Lubitz S. A., Lunetta K. L., Mak A. C. Y., Manichaikul A., Manning A. K., Mathias R. A., McManus D. D., McGarvey S. T., Meigs J. B., Meyers D. A., Mikulla J. L., Minear M. A., Mitchell B. D., Mohanty S., Montasser M. E., Montgomery C., Morrison A. C., Murabito J. M., Natale A., Natarajan P., Nelson S. C., North K. E., O’Connell J. R., Palmer N. D., Pankratz N., Peloso G. M., Peyser P. A., Pleiness J., Post W. S., Psaty B. M., Rao D. C., Redline S., Reiner A. P., Roden D., Rotter J. I., Ruczinski I., Sarnowski C., Schoenherr S., Schwartz D. A., Seo J.-S., Seshadri S., Sheehan V. A., Sheu W. H., Shoemaker M. B., Smith N. L., Smith J. A., Sotoodehnia N., Stilp A. M., Tang W., Taylor K. D., Telen M., Thornton T. A., Tracy R. P., Van Den Berg D. J., Vasan R. S., Viaud-Martinez K. A., Vrieze S., Weeks D. E., Weir B. S., Weiss S. T., Weng L.-C., Willer C. J., Zhang Y., Zhao X., Arnett D. K., Ashley-Koch A. E., Barnes K. C., Boerwinkle E., Gabriel S., Gibbs R., Rice K. M., Rich S. S., Silverman E. K., Qasba P., Gan W., NHLBI Trans-Omics for Precision Medicine (TOPMed) Consortium, Papanicolaou G. J., Nickerson D. A., Browning S. R., Zody M. C., Zöllner S., Wilson J. G., Cupples L. A., Laurie C. C., Jaquish C. E., Hernandez R. D., O’Connor T. D., Abecasis G. R., Sequencing of 53,831 diverse genomes from the NHLBI TOPMed Program. Nature. 590, 290–299 (2021). - PMC - PubMed
    1. Cooper G. M., Shendure J., Needles in stacks of needles: finding disease-causal variants in a wealth of genomic data. Nature Reviews Genetics. 12 (2011), pp. 628–640. - PubMed

Publication types