[Preprint]. 2023 Dec 12:2023.03.08.23286720.
doi: 10.1101/2023.03.08.23286720.

POTENTIATION OF CORTICO-SPINAL OUTPUT VIA TARGETED ELECTRICAL STIMULATION OF THE MOTOR THALAMUS

Affiliations

POTENTIATION OF CORTICO-SPINAL OUTPUT VIA TARGETED ELECTRICAL STIMULATION OF THE MOTOR THALAMUS

Jonathan C Ho et al. medRxiv. .

Update in

Abstract

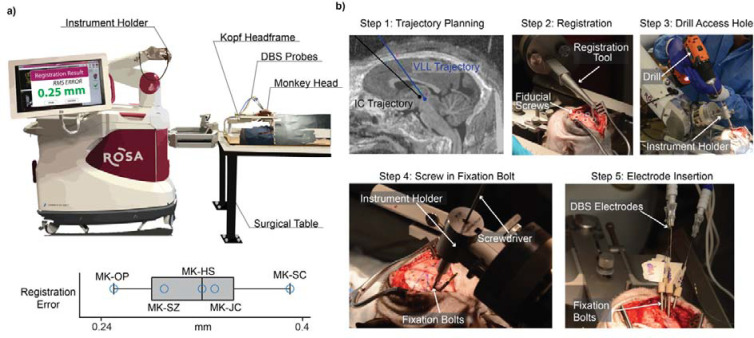
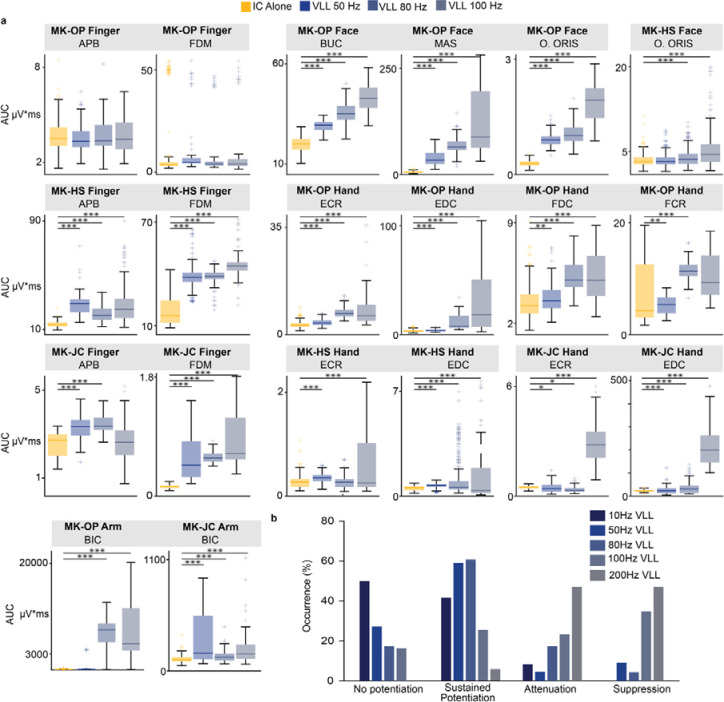
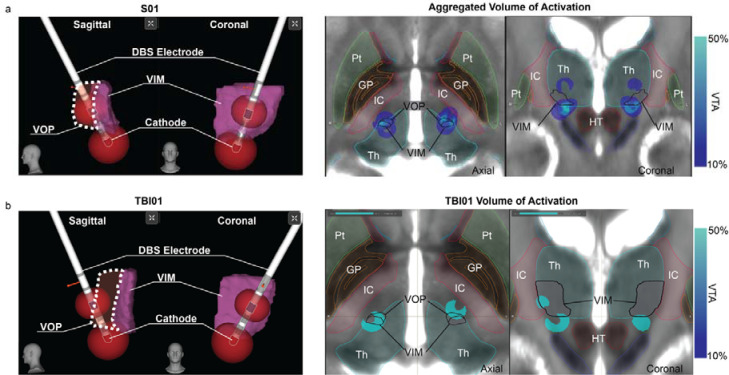
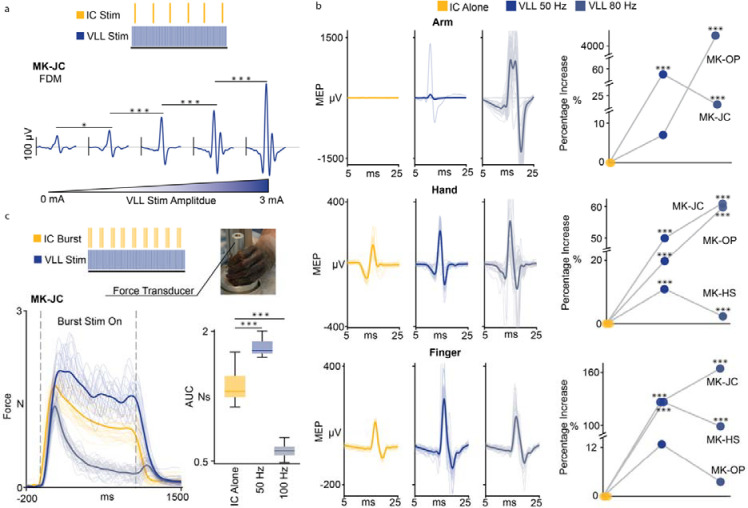
Cerebral white matter lesions prevent cortico-spinal descending inputs from effectively activating spinal motoneurons, leading to loss of motor control. However, in most cases, the damage to cortico-spinal axons is incomplete offering a potential target for new therapies aimed at improving volitional muscle activation. Here we hypothesized that, by engaging direct excitatory connections to cortico-spinal motoneurons, stimulation of the motor thalamus could facilitate activation of surviving cortico-spinal fibers thereby potentiating motor output. To test this hypothesis, we identified optimal thalamic targets and stimulation parameters that enhanced upper-limb motor evoked potentials and grip forces in anesthetized monkeys. This potentiation persisted after white matter lesions. We replicated these results in humans during intra-operative testing. We then designed a stimulation protocol that immediately improved voluntary grip force control in a patient with a chronic white matter lesion. Our results show that electrical stimulation targeting surviving neural pathways can improve motor control after white matter lesions.


Conflict of interest statement

Competing interests The authors declare no conflicts of interests in relation to this work.

Figures

Extended Data Fig. 1 |
Extended Data Fig. 1 |. ROSA Setup/Implantation Steps.
(a) Top: Rosa robot surgery setup. This panel was adapted from. Bottom: Root mean squared registration error after registration using the fiducial screws for n=5 animals. Co-registration errors were minimal (MK-SC: 0.39 mm, MK-SZ: 0.32 mm, MK-OP: 0.25 mm, MK-HS = 0.29 mm, MK-JC = 0.33 mm), consistent with our previous report, and similar to those observed in human surgeries (0.27 ± 0.07 mm), thus ensuring highly precise implantation. (b) Step 1: we plan the trajectories of each DBS probe in the ROSA One Brain planning software. Step 2: using the Rosa registration tool, we register the position of the brain with fiducial screws in the skull. Step 3: an access hole is drilled into the skull along the trajectory of the probe. Step 4: fixation bolts are screwed into the skull along the probe trajectory. Step 5: DBS and IC electrodes are inserted into fixation bolts at target depth.
Extended Data Fig. 2 |
Extended Data Fig. 2 |. VLL Stimulation amplifies MEP across arm, hand, fingers, and face muscles.
(a) Boxplots of AUC of MEPs across multiple muscles (APB: Abductor Pollicis Brevis, FDC: Flexor Digitorum Communis, FDM: Flexor Digiti Minimi, EDC: Extensor Digitorum Communis, ECR: Extensor Carpi Radialis, BIC: Biceps, Buc: Buccinator, Mas: Masseter, O. Oris: Orbicularis Oris) in n=3 animals (MK-OP, MK-HS, MK-JC) where EMG recordings were performed. MEPs were recorded during IC stimulation alone (MK-OP: n = 360, MK-HS: n = 237, MK-JC: n = 117) and then paired with VLL stimulation at 50 (MK-OP: n = 68, MK-HS: n = 222, MK-JC: n = 51), 80 (MK-OP: n = 72, MK-HS: n = 233, MK-JC: n = 90), and 100 Hz (MK-OP: n = 63, MK-HS: n = 234, MK-JC: n = 90). Muscles that did not show MEPs responses were not displayed. For all boxplots, the whiskers extend to the maximum spread not considering outliers, central, top, and bottom lines represent median, 25th, and 75th percentile, respectively. For all panels, statistical significance was assessed with two-tail bootstrapping with Bonferroni correction: p<0.05 (*), p<0.01 (**), p<0.001(***). (b) The occurrence of modulation patterns with respect to stimulation frequency for no potentiation, sustained potentiation, attenuation and suppression.
Extended Data Fig. 3 |
Extended Data Fig. 3 |. VLL stimulation potentiates movements of the arm and hand.
(a) Example kinematic trace from MK-SZ with IC alone and paired with VLL stimulation at 50 and 100 Hz. (b) Scatter plots for the hand (wrist marker) and fingers (thumb and index marker), representing the percentage of increase of the peak to peak amplitude, in n=3 animals (MK-SZ, MK-HS, MK-JC). Kinematics were recorded during IC stimulation alone and then with paired VLL stimulation at 50, 80, and 100 Hz. For all panels, statistical significance was assessed with two-tail bootstrapping with Bonferroni correction: p<0.05 (*), p<0.01 (**), p<0.001(***).
Extended Data Fig. 4 |
Extended Data Fig. 4 |. MEP responses from VLL stimulation.
(a) Example MEPs (30 traces for each plot) of one arm, hand, wrist, and face muscle elicited by VLL stimulation at either 10 Hz (top row) or 50 Hz (bottom row). (b) Boxplots of the AUC MEP responses to VLL stimulation at 10 and 50 Hz for arm (BIC: Bicep), hand (ABP: Abductor Pollicis Brevis and APL: Aductor pollicis longus), wrist (ECR: Extensor Carpi Radialis, EDC: Extensor Digitorum Communis, FCR: Flexor Carpi Radialis, FDC: Flexor digitorum superficialis, and FDM: Flexor digiti minimi brevis), and face (O. Oris: Orbicularis oris) muscles for three animals (MK-OP, MK-JC, MK-HS). For all boxplots, the whiskers extend to the maximum spread not considering outliers, central, top, and bottom lines represent median, 25th, and 75th percentile, respectively.
Extended Data Fig. 5 |
Extended Data Fig. 5 |. Radial nerve MEPs.
Boxplots of the AUC amplitudes of the EMG reflexes for ECR (top row) and EDC (bottom row) elicited by radial nerve stimulation alone and radial nerve stimulation paired with continuous VLL stimulation at 50 Hz for 3 animals (MK-JC, MK-OP, MK-HS). For all boxplots, the whiskers extend to the maximum spread not considering outliers, central, top, and bottom lines represent median, 25th, and 75th percentile, respectively. For all panels, statistical significance was assessed with one-tail bootstrapping with Bonferroni correction, however, in all cases the results were not significant.
Extended Data Fig. 6 |
Extended Data Fig. 6 |. Potentiation of MEP persists after CST lesions across arm, hand, fingers, and face muscles.
Boxplots of the AUC of MEPs across multiple muscles (APB: Abductor Pollicis Brevis, FDC: Flexor Digitorum Communis, FDM: Flexor Digiti Minimi, EDC: Extensor Digitorum Communis, ECR: Extensor Carpi Radialis, BIC: Biceps, Buc: Buccinator, Mas: Masseter, O. Oris: Orbicularis Oris) in n=3 animals (MK-OP, MK-HS, MK-JC) where EMG recordings were performed after lesion of the CST. MEPs were recorded during IC stimulation alone before (MK-OP: n = 237, MK-HS: n = 237, MK-JC n = 117) and after the CST lesion (MK-OP: n = 127, MK-HS: n = 169, MK-JC: n = 60) and then paired with VLL stimulation at 50 (MK-HS: n = 172, MK-JC: n = 60), 80 (MK-HS: n = 174, MK-JC: n = 28), and 100 Hz (MK-OP: n = 168, MK-HS: n = 173, MK-JC: n = 60). Muscles that did not show MEPs responses were not displayed. For all boxplots, the whiskers extend to the maximum spread not considering outliers, central, top, and bottom lines represent median, 25th, and 75th percentile, respectively. For all panels, statistical significance was assessed with two-tail bootstrapping with Bonferroni correction: p<0.05 (*), p<0.01 (**), p<0.001(***).
Extended Data Fig.7 |
Extended Data Fig.7 |. Potentiation of movements persists after CST Lesion.
(a) Example kinematic trace from MK-JC with IC alone and paired with VLL at 50, 80, and 100 Hz after lesion of the CST. (b) Scatter plots for the arm (wrist marker) and hand (thumb, index, and pinky marker), representing the percentage of increase of the peak to peak amplitude, in n=3 animals (MK-SZ, MK-HS, and MK-JC). Traces were created in DeepLabCut with markers placed on the thumb, index finger, pinky finger, and wrist. Kinematics was recorded during IC stimulation alone and IC stimulation paired with VLL stimulation at 50, 80, and 100 Hz.
Extended Data Fig. 8 |
Extended Data Fig. 8 |. Human DBS Volume of Tissues Activation.
(a) Left: Reconstructions of the VIM/VOP deep brain stimulation (DBS) electrode from S01. Simulated volume of tissue activation (VTA) at the cathode and anode (bipolar stimulation). Right: Aggregation of modeled VTAs from n=4 human participants (S01, S02, S03, S04). (b) Left: Reconstructions of VIM/VOP DBS electrodes and VTA from CST01. Right: modeled VTA from VIM/VOP DBS for CST01.
Extended Data Fig. 9 |
Extended Data Fig. 9 |. Stimulation of the motor thalamus potentiates MEPs across arm, hand, and fingers muscles in humans.
Box plots of MEPs AUC amplitudes of different muscles with DCS alone and DCS paired with VIM/VOP stimulation at 50, and/or 80 Hz and/or 100 Hz. All subjects (S01, S02, S03 and S04) are reported. Amplitudes refer to the current amplitudes for DCS. APB, abductor pollicis brevis, FLEX, flexors; EXT, extensors; BI, biceps; TRI, triceps. For all boxplots, the whiskers extend to the maximum spread not considering outliers, central, top, and bottom lines represent median, 25th, and 75th percentile, respectively. For all panels, statistical significance was assessed with two-tail bootstrapping with Bonferroni correction: p<0.05 (*), p<0.01 (**), p<0.001(***).
Extended Data Fig. 10 |
Extended Data Fig. 10 |. CST01 Lesion Segmentation.
Slices of T2-Flair MRI from CST01 with areas of lesion highlighted in red.
Fig. 1 |
Fig. 1 |. Identification of optimal target of stimulation.
(a) Schema of our hypothesis: motor thalamus stimulation potentiates motor output by increasing excitability of the motor cortex. The potentiation persists also after a lesion of the CST highlighted in red. (b) Top: High definition fiber tracking (HDFT) from VPL, VLL, and VAL nuclei (VPL: ventral posterolateral, VLL: ventral laterolateral, VAL: ventral anterolateral) of monkey motor thalamus to cortical regions (n=3) (S1: primary somatosensory cortex, M1: primary motor cortex, PMd: dorsal pre-motor cortex, SMA: supplementary motor area). Bottom: Volume of thalamocortical projections (mean ± standard error over 3 animals) from each nucleus to each cortical region normalized by the total volume of fibers projecting from each nucleus. (c) Acute experimental setup. First, a cuff electrode was implanted around the motor branch of the radial nerve for stimulation. Animals were then implanted with a DBS electrode in the internal capsule (IC) and one in the VLL using the ROSA robot and intracortical arrays over S1 and M1. An intraspinal probe was implanted at the C6 spinal segment to record spinal local field potentials and EMG needle electrodes were inserted in arm, hand, and face muscles. A force transducer was placed in the animal’s hand to measure grip force. Finally, a camera recorded the kinematic of the arm and hand. (d) Left: Example of VLL electrode implant location localized from post-mortem MRI (Cd: Caudate Nucleus, IC: Internal Capsule, Pt: Putamen). Right: Normalized volume HDFT projections from the area of stimulation to cortical regions (mean ± SE over animals, n=4).
Fig. 2 |
Fig. 2 |. Stimulation of the motor thalamus increases motor cortex excitability.
(a) Picture (left) and schematic (right) of the Implant location of M1 and S1 intracortical arrays. (b) Top: Example heatmap of average peak to peak amplitudes of cortical evoked potentials from VLL stimulation at 10 Hz across all channels over S1 and M1 for MK-HS. Center: Example stimulation triggered averages of cortical evoked potentials over S1 and M1 (n=40 traces). Bottom: Histogram of peak to peak amplitudes across all channels for S1 and M1 (n=48 channels per array). (c) Top: Example baseline corrected spike count heatmaps in S1 and M1 for MK-HS. Bottom: Average spike counts over time across all channels in S1 and M1 array (n=48 channels per array). (d) Top: Example traces of antidromic potentials in M1 from IC stimulation without (yellow) and with (blue) conditioning from a burst of VLL stimulation for MK-HS (n=40 traces). Boxplot of peak to peak amplitude of the antidromic potentials when IC stimulation is conditioned by VLL stimulation at various delays (2, 5, 10, and 50ms). In the boxplot, the whiskers extend to the maximum spread not considering outliers, central, top, and bottom lines represent median, 25th, and 75th percentile, respectively. For all panels, statistical significance was assessed with two-tail bootstrapping with Bonferroni correction: p<0.05 (*), p<0.01 (**), p<0.001(***).
Fig. 3 |
Fig. 3 |. Stimulation of the motor thalamus amplifies motor outputs.
(a) Average of binned Flexor Digitorum Minimi (FDM) MEPs generated by IC stimulation at 2 Hz paired with continuous VLL stimulation at 50 Hz with gradual ramp up of amplitude (0 to 3mA; bins: 0 to 0.6 mA, 0.7 to 1.2 mA, 1.3 to 1.8 mA, 1.9 to 2.4 mA, and 2.5 to 3 mA, each bin included n=9 responses). (b) Left panels: MEPs of one arm muscle (n=40, Biceps, Mk-OP), one hand muscle (n=40, Extensor Digitorum Communis, Mk-HS), and one finger muscle (n=40, Abductor Pollicus Brevis, MK-HS) with IC stim alone and then paired with VLL stimulation at 50 and 80 Hz. Right panels: percentage of increase of AUC of arm, hand, and finger MEPs between IC stimulation alone and paired with VLL stimulation at 50 and 80 Hz. For each monkey, the percentage of increase was calculated over the medians and averaged over all the muscles. See Extended Data Fig. 2 for box-plots for single muscles. (***), (**), or (*) was placed if muscles in each group show a significant increase (respective to p-values 0.001, 0.01, and 0.05). (c) Force transducer experimental setup and stimulation parameters (IC: 45–50 Hz burst, 1s ON, 2s OFF; VLL: 50 Hz continuous). Example force traces (n=20) and boxplots of AUC (IC alone, IC with VLL at 50 Hz, and IC with VLL at 100 Hz). For all boxplots, the whiskers extend to the maximum spread not considering outliers, central, top, and bottom lines represent median, 25th, and 75th percentile, respectively. For all panels, statistical significance was assessed with two-tail bootstrapping with Bonferroni correction: p<0.05 (*), p<0.01 (**), p<0.001(***).
Fig. 4 |
Fig. 4 |. Motor output potentiation is not through spinal circuits.
(a) Example of antidromic responses in the spinal cord from VLL stimulation at 10 Hz (n=30 traces) in MK-OP. (b) Left: Heatmaps of peak to peak amplitude of the antidromic responses in the spinal cord at the C6-C7 spinal level with dorsal-ventral alignments for n=3 animals. The dashed boxes are highlighting the putative intermediate-ventral zone where we see the greatest responses. Right: Boxplots of the antidromic response latency for each animal (n = 656 MK-OP, n = 596 MK-JC, n = 289 MK-HS). (c) MEPs of the wrist (ECR: Extensor Carpi Radialis, 30 traces for each animal) elicited by VLL stim at 10 Hz. (d) EMG reflexes and boxplots of the AUC of the EMG reflexes of the ECR muscle elicited by radial nerve stimulation and radial nerve paired with continuous VLL stimulation at 50 Hz (30 example traces each). For all boxplots, the whiskers extend to the maximum spread not considering outliers, central, top, and bottom lines represent median, 25th, and 75th percentile, respectively. Statistical significance was assessed with one-tail bootstrapping with Bonferroni correction, however, in all cases the results were not significant.
Fig. 5 |
Fig. 5 |. Responses are modulated in a frequency-dependent manner.
(a) Examples of frequency-dependent modulation of muscular responses. EMG responses were elicited by 2 Hz stimulation of the IC paired with different VLL stimulation frequencies (10, 50, 80, 100, and 200 Hz). (b) The occurrence of modulation patterns with respect to stimulation frequency. All patterns recorded in all muscles of 3 animals were included in the analysis (n= 24 patterns at 10 Hz, n=22 patterns at 50 Hz, n=23 patterns at 80 Hz, n=43 at 100 Hz, and n=17 patterns at 200 Hz). (c) Top: Example of spinal responses in the ventral zone for IC stimulation alone and IC stimulation paired with VLL stimulation at 80 and 100 Hz (n = 30 traces per plot). Bottom: Heatmaps of the AUC calculated from 5 to 10 ms after IC stimulation for all ventral channels for IC stimulation alone and IC stimulation paired with VLL stimulation at 10, 50, 80, and 100 Hz. (*) for significant potentiation and (+) for significant suppression. Bold represents p<0.001. (d) Top: Schematic of the experimental layout for testing frequency dependence within the motor cortex. Bottom: Example traces of the cortical evoked potential responses in the M1 array when stimulating the thalamus at different frequencies (10, 50, 80, and 100 Hz) (n = 30 traces). Boxplots of the peak to peak amplitudes of the cortical evoked potentials. Statistical significance was tested by comparing 50 Hz VLL stimulation to all other stimulation conditions for potentiation using one-tailed bootstrapping with Bonferroni correction: p<0.05 (*), p<0.01 (**), p<0.001(***). For all boxplots, the whiskers extend to the maximum spread not considering outliers, central, top, and bottom lines represent median, 25th, and 75th percentile, respectively.
Fig. 6 |
Fig. 6 |. Stimulation of the motor thalamus amplifies motor outputs after CST lesions.
(a) Top panels: T2-weighted post-mortem MRI of IC lesion and VLL location (axial plane). (Cu: Caudate Nucleus, IC: Internal Capsule, Pt: Putamen). Bottom panels: HDFT of the CST in intact and lesioned hemispheres. Volume of cumulative CST (mean +/− SE over animals) for both hemispheres normalized over the volume of the intact hemisphere. (b) Left panels: Example of post-lesion MEPs of one arm muscle (n=40, BIC: Biceps, MK-JC), one hand muscle (n=40, ECR: Extensor Communis Radialis, Mk-JC), and one finger muscle (n = 40, FDM: Flexor Digitorum Minimi, MK-JC) with IC stim alone and then paired with VLL stimulation at 50 and 80 Hz. Right panels: percentage of increase of arm, hand, and finger MEPs post-lesion between IC stimulation alone and paired with VLL stimulation at 50 and 80 Hz. For each monkey, the percentage of increase was calculated over the medians and averaged over all the muscles. See Extended Data Fig. 6 for box-plots for single muscles. (***), (**), or (*) was placed if muscles in each group show a significant increase (respective to p-values 0.001, 0.01, and 0.05). (c) Left panel: Example of force traces (n=20). Right panel: boxplot of AUC pre- and post-lesion for IC alone, and IC with VLL 50 Hz and VLL 80 Hz. For all boxplots, the whiskers extend to the maximum spread not considering outliers, central, top, and bottom lines represent median, 25th, and 75th percentile, respectively. For all panels, statistical significance was assessed with two-tail bootstrapping with Bonferroni correction: p<0.05 (*), p<0.01 (**), p<0.001(***).
Fig. 7 |
Fig. 7 |. Stimulation of the motor thalamus amplifies motor outputs in humans.
(a) Top: Experimental setup for human intraoperative experiments. Enlargement shows a schematic representing the subdural strip electrode placement over the primary motor (M1) and somatosensory (S1) cortices, and the phase reversal (PR) to identify the central sulcus. Needle electrodes were inserted in arm, wrist, and hand muscles to record MEPs and superficial electrodes were placed over the median nerve for SSEP. (b) Left: HDFT from the VIM/VOP to cortical regions. Right: Normalized volume (mean ± SE over n=4 subjects) of VIM/VOP projections to each cortical region normalized by the total volume of fibers. (c) Top: Example traces (n=122) of cortical evoked potentials elicited by VIM/VOP stimulation recorded over an S1 (left) and PR (right) contact for S04. Bottom: Box-plots of peak to peak amplitude of cortical evoked potentials at S1 and PR contact. From left to right, subjects 1 to 4 are shown (n=128, n=585, n=601, n=122 trials, respectively). (d) Example MEP traces (arm, biceps; hand, flexor; n=60) with VIM/VOP stimulation alone for S03. (e) Example MEP traces with DCS alone and DCS paired with VIM/VOP stimulation at 50 and 100 Hz (from left to right). Arm is S03 biceps (n=48 traces), fingers is S01 abductor pollicis brevis (n=16 traces). (f) Box plots of AUC for MEPs of the arm and fingers (biceps and abductor pollicis brevis respectively; n=58) with DCS alone and DCS paired with VIM/VOP stimulation at 50 and 100 Hz. (g) Scatter plots for arm, hand, and fingers muscles of all subjects, representing the percentage of AUC increase calculated over the means, with respect to DCS alone, for all the different VIM/VOP stimulation frequencies (50, 80, and 100 Hz). For all boxplots, the whiskers extend to the maximum spread not considering outliers, central, top, and bottom lines represent median, 25th, and 75th percentile, respectively. For all panels, statistical significance was assessed with two-tail bootstrapping with Bonferroni correction: p<0.05 (*), p<0.01 (**), p<0.001(***).
Fig. 8 |
Fig. 8 |. Stimulation of the motor thalamus improves voluntary motor control after lesions of the CST.
(a) White-matter fibers damage estimation for CST01. Top panel: Differential tractography with regions of white matter tract lesion highlighted in red. Bottom panels: Proportion of lesioned tracts for left and right hemispheres (CST: corticospinal tract, CBT: corticobulbar tract, DRT: dentatorubrothalamic tract, ML: medial lemniscus). See Extended Data Fig. 10 for lesion segmentation. (b) Box-plots of peak to peak amplitude of cortical EPs over S1 and PR contact from VIM/VOP stimulation at 10 Hz (n = 599). (c) Left: Example of MEPs with DCS alone and DCS paired with VIM/VOP stimulation at 50 and 100 Hz for fingers (APB) and hand (flexor) (n = 18). Right: box plots of MEPs AUC of ABP and flexor with DCS alone and DCS paired with VIM/VOP stimulation at 50 and 100 Hz. (d) Schema of the motor task performed by CST01. (e) Left: Example of force traces without (top) and with (bottom) VIM/VOP stimulation at 55 Hz. Yellow and blue intensity represent different repetitions. Right: bar plot of the root-mean-square error of the force without (yellow) and with (blue) VIM/VOP stimulation at 55 Hz (mean +/− standard deviation over trials). Statistical significance was assessed with two-tail bootstrapping with Bonferroni correction: p<0.05 (*), p<0.01 (**). (f) Top: average power spectrums from 1 to 12 Hz calculated over the hold periods of the task without (yellow) and whit (blue) stimulation at 55Hz. Bottom: boxplots of the average power spectrum over the clinical observed range for tremor (6–12Hz). No statistically significant difference was found between stimulation ON and OFF (one-tail bootstrapping with Bonferroni correction). For all boxplots, the whiskers extend to the maximum spread not considering outliers, central, top, and bottom lines represent median, 25th, and 75th percentile, respectively.

References

    1. Lemon R. N. Descending pathways in motor control. Annu. Rev. Neurosci. 31, 195–218 (2008). - PubMed
    1. Skolarus L., Meurer W., Burke J., Bettger J. P. & Lisabeth L. Effect of insurance status on postacute care among working age stroke survivors. Neurology 78, 1590–1595 (2012). - PMC - PubMed
    1. Zaloshnja E., Miller T., Langlois J. A. & Selassie A. W. Prevalence of long-term disability from traumatic brain injury in the civilian population of the United States, 2005. The Journal of head trauma rehabilitation 23, 394–400 (2008). - PubMed
    1. Clayton E., Kinley-Cooper S., Weber R. & Adkins D. Brain stimulation: Neuromodulation as a potential treatment for motor recovery following traumatic brain injury. Brain research 1640, 130–138 (2016). - PMC - PubMed
    1. Simonetta-Moreau M. Non-invasive brain stimulation (NIBS) and motor recovery after stroke. Annals of physical and rehabilitation medicine 57, 530–542 (2014). - PubMed

Publication types