[Preprint]. 2023 Oct 14:2023.03.03.530970.
doi: 10.1101/2023.03.03.530970.

A role for retro-splenial cortex in the task-related P3 network

Affiliations

A role for retro-splenial cortex in the task-related P3 network

Diptyajit Das et al. bioRxiv. .

Update in

Abstract

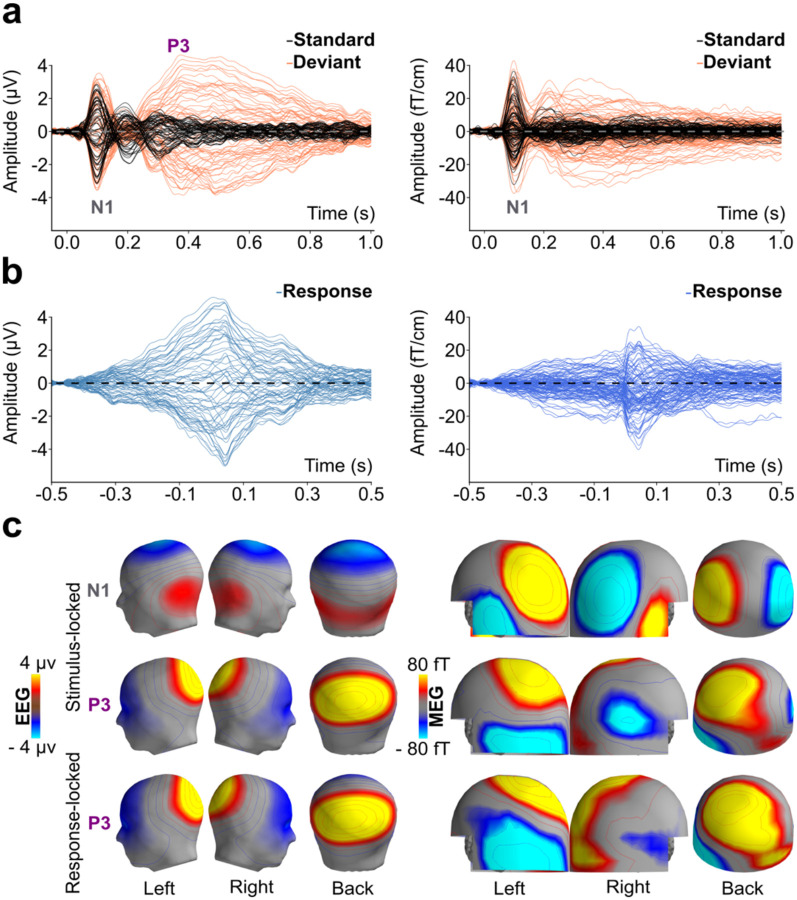
Objective: The P3 is an event-related response observed in relation to task-relevant sensory events. Despite its ubiquitous presence, the neural generators of the P3 are controversial and not well identified.

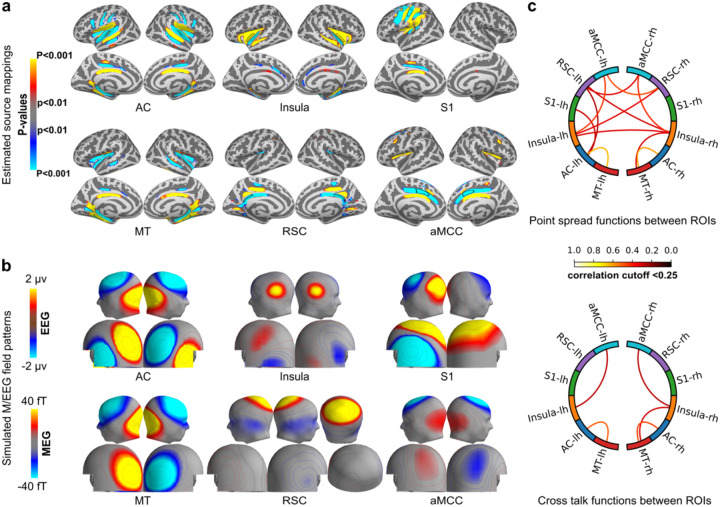
Methods: We compared source analysis of combined magneto- and electroencephalography (M/EEG) data with functional magnetic resonance imaging (fMRI) and simulation studies to better understand the sources of the P3 in an auditory oddball paradigm.

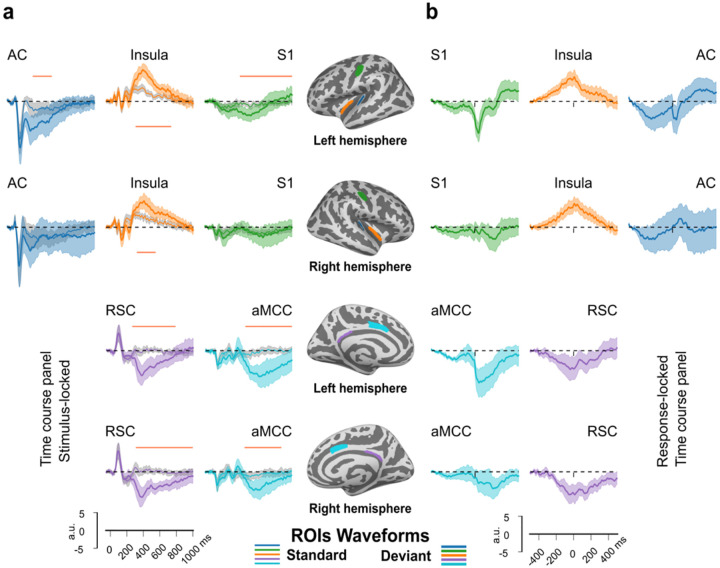
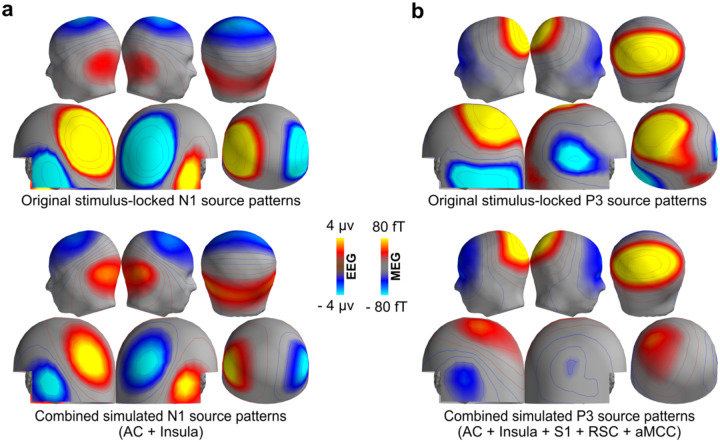
Results: Our results suggest that the dominant source of the classical, postero-central P3 lies in the retro-splenial cortex of the ventral cingulate gyrus. A second P3 source in the anterior insular cortex contributes little to the postero-central maximum. Multiple other sources in the auditory, somatosensory, and anterior midcingulate cortex are active in an overlapping time window but can be functionally dissociated based on their activation time courses.

Conclusion: The retro-splenial cortex is a dominant source of the parietal P3 maximum in EEG.

Significance: These results provide a new perspective for the interpretation of the extensive research based on the P3 response.

Keywords: EEG; MEG; P300; fMRI; insular cortex; source analysis.


Conflict of interest statement

Declaration of interest: None of the authors have potential conflicts of interest to be disclosed.

Figures

Fig. 1.
Fig. 1.
Grand-average evoked-response waveforms and maps. (a) Stimulus-locked EEG waveforms (left) and MEG waveforms (right) for standards (black) and deviants (coral). While the N1 is observed for standards and deviants alike, activity in the P3 time window from 300 – 600 ms is only observed for deviants. (b) Waveforms averaged to the button presses for detected deviants. While the EEG (left) is dominated by an increasing signal slightly beyond the button press, the MEG (right) shows a particularly strong, steeply rising response after the button press. (c) Grand average EEG maps (upper) and reconstructed MEG magnetometer maps (lower) are based on maps calculated at the individual peak latency of the N1 at electrode Cz (left), the P3 at electrode Pz (middle), and the response-locked average at electrode Pz (right).
Fig. 2.
Fig. 2.
Cortical M/EEG and fMRI activation maps. (a) Dynamic statistical parametric maps (dSPM) based on the combined M/EEG for deviants (upper), standards (middle), and the contrast deviants – standards (lower) in three different time windows (n=12; p<0.01). The early 75 – 125 ms time window (T1) is focused on the N1, the middle 300 – 500 ms time window (T2) on the P3, and the late 500 – 800 ms time window (T3) on the late frontal negativity. Because the dSPMs are based on a fixed-effects statistic, the number of standard trials was reduced to the number of deviant trials for this analysis. (b) dSPMs for the response-locked average in the time window 50 ms before (T4) and 50 ms after (T5) the button press. (c) fMRI maps for the contrast deviants – standards (n=12; p<0.05, corrected for multiple comparison with the false-discovery-rate method), based on a random-effects statistic.
Fig. 3.
Fig. 3.
Region-of-interest (ROI) based source waveforms (average across participants, n=12; shaded area indicates 95% confidence interval). Source waveforms are based on dynamic statistical parametric maps (dSPM), calculated for the ROIs shown in the middle column with the same color code as the waveforms. The ROIs include auditory cortex (AC), anterior insular cortex (insula), primary somatosensory cortex (S1), retro-splenial cortex (RSC), and anterior midcingulate cortex (aMCC). (a) stimulus-locked source time courses, averaged relative to tone onset. Typical P3 source waveforms are observed in RSC (purple) and insula (orange). The coral color bar indicates the time interval in which the deviant and standard responses are significantly different from each other (cluster-based permutation test, see methods for details). (b) response-locked source time courses shown in similar configuration.
Fig. 4.
Fig. 4.
Simulated M/EEG and analysis of spread. (a, b) The data represent an average of n=12 individual simulations, based on bilateral, individually morphed regions of interest (ROIs) in auditory cortex (AC), Insula, medial temporal cortex (MT), retro-splenial cortex (RSC), and anterior midcingulate cortex (aMCC). The simulation of the primary somatosensory cortex (S1) is based on the left hemisphere ROI, only. Source polarity with respect to the cortical surface was chosen to match the pattern observed in the N1 (AC, MT) or P3 (insula, S1, RSC, aMCC) time window as shown in Fig. 2. (a) dynamic statistical parametric map (dSPM) of the simulated M/EEG data (p<0.01). (b) Maps of the scalp EEG (upper) and virtual magnetometer maps of the MEG based on the grand average of the simulated data, same scaling for all conditions. (c) Point-spread analysis (upper circle) and cross-talk analysis (lower circle) for the same ROIs used in (a) and (b). Each analysis is visualized using a circular graph with an absolute arbitrary correlation cutoff value of 0.25. The exact values are summarized in Fig. S4 (point spread) and Fig. S5 (cross-talk).
Fig. 5.
Fig. 5.
Multi-source simulation for the N1 and P3. (a) Grand average scalp EEG maps and virtual MEG magnetometer maps at the peak latency of the N1 in Cz (upper). Combined simulation of N1 maps in scalp/sensor space based on the sum of the sources in auditory cortex (AC) and insula; cf. Table S1) fitted to the stimulus-locked N1 (lower). (b) Grand average scalp EEG maps and virtual MEG magnetometer maps at the peak latency of the P3 in Pz (upper). Combined simulation of P3 maps in scalp/sensor space based on the sum of the sources in AC, insula, primary somatosensory cortex (S1), retrosplenial cortex (RSC), and anterior midcingulate cortex (aMCC) (cf. Table 1) fitted to the stimulus-locked P3 (lower).

References

    1. Agam Y, Hämäläinen MS, Lee AKC, Dyckman KA, Friedman JS, Isom M, et al. Multimodal neuroimaging dissociates hemodynamic and electrophysiological correlates of error processing. Proc Natl Acad Sci U S A 2011;108:17556–61. 10.1073/pnas.1103475108. - DOI - PMC - PubMed
    1. Ahlfors SP, Han J, Lin FH, Witzel T, Belliveau JW, Hämäläinen MS, et al. Cancellation of EEG and MEG signals generated by extended and distributed sources. Hum Brain Mapp 2010;31:140–9. 10.1002/hbm.20851. - DOI - PMC - PubMed
    1. Alberto GE, Stapleton-Kotloski JR, Klorig DC, Rogers ER, Constantinidis C, Daunais JB, et al. MEG source imaging detects optogenetically-induced activity in cortical and subcortical networks. Nat Commun 2021;12:5259. 10.1038/s41467-021-25481-y. - DOI - PMC - PubMed
    1. Alexander AS, Rangel LM, Tingley D, Nitz DA. Neurophysiological signatures of temporal coordination between retrosplenial cortex and the hippocampal formation. Behav Neurosci 2018;132:453–68. 10.1037/bne0000254. - DOI - PubMed
    1. Asanowicz D, Gociewicz K, Koculak M, Finc K, Bonna K, Cleeremans A, et al. The response relevance of visual stimuli modulates the P3 component and the underlying sensorimotor network. Sci Rep 2020;10:3818. 10.1038/s41598-020-60268-z. - DOI - PMC - PubMed

Publication types