[Preprint]. 2023 Mar 10:rs.3.rs-2662020.
doi: 10.21203/rs.3.rs-2662020/v1.

A pilot study on metabolomic characterization of human glioblastomas and patient plasma

Affiliations

A pilot study on metabolomic characterization of human glioblastomas and patient plasma

Allison Liu et al. Res Sq. .

Update in

Abstract

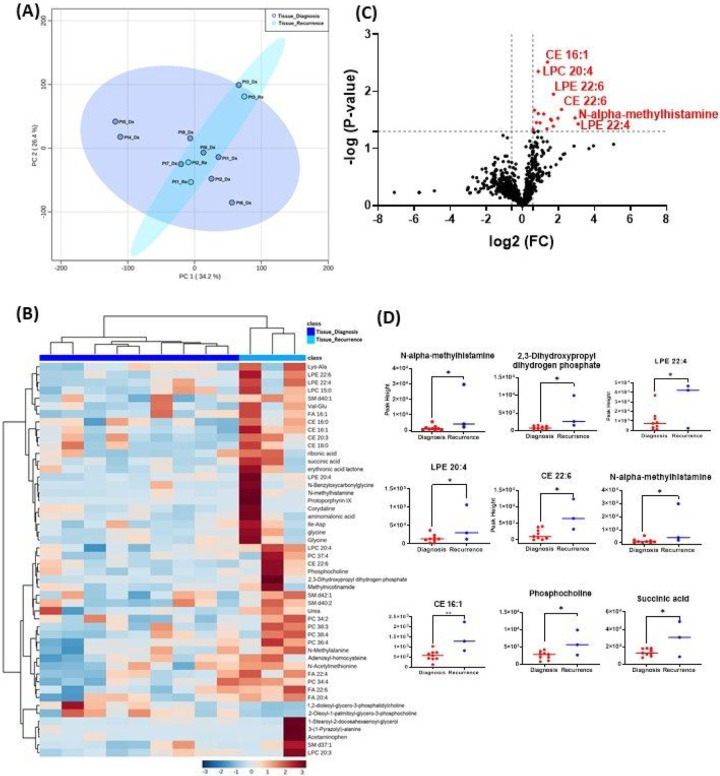
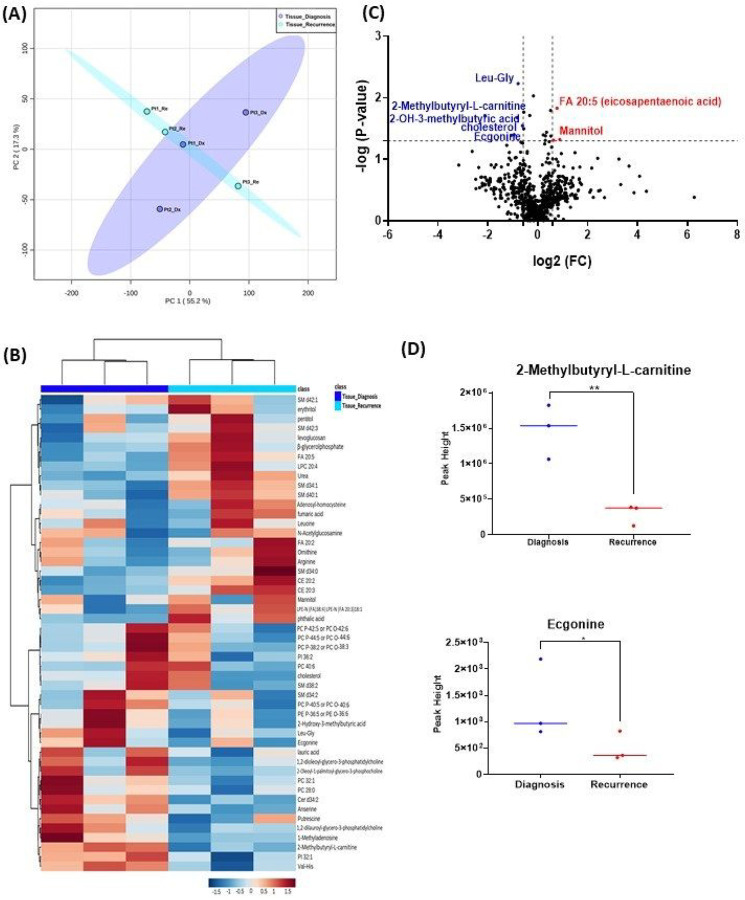
Purpose: To determine whether recurrent GBMs are metabolically distinct from primary GBM, and whether patient plasma can be used as a liquid biopsy to reflect this difference.

Methods: In a single center cohort study, tissue and blood samples from 15 patients with glioblastoma (9 glioblastoma tissues at diagnosis, 3 pairs of tissue, and 6 pairs of plasma specimens at diagnosis and at recurrence) were analyzed.

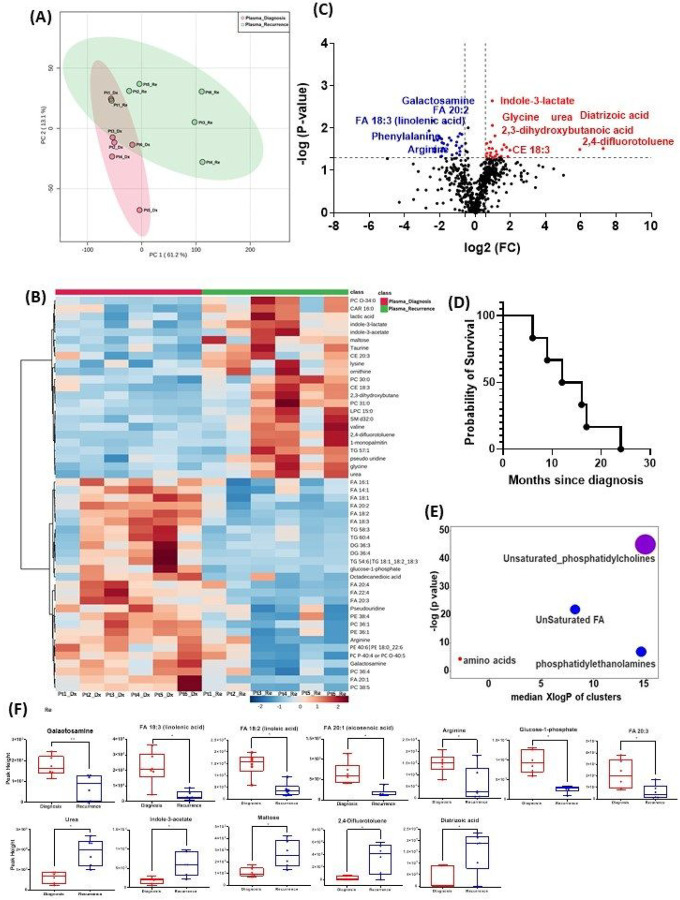
Results: Several metabolites had significant alternations in both tumor and plasma specimens. In the tissue, the following representative metabolites had a significant increase in peak intensity at recurrence compared to diagnosis: N-alpha-methylhistamine (p = 0.037), glycerol-3-phosphate (p = 0.029), phosphocholine (p = 0.045), and succinic acid (p = 0.025). In patient plasma, metabolites that significantly increased at recurrence included: 2,4-difluorotoluene (p = 0.031), diatrizoic acid (p = 0.032), indole-3-acetate with (p = 0.029), urea (P = 0.025), pseudouridine (p = 0.042), and maltose (p = 0.035). Metabolites that significantly decreased in plasma at recurrence were: eicosenoic acid (p = 0.017), glucose-1-phosphate (p = 0.017), FA 18:2 (linoleic acid) (p = 0.017), arginine (p = 0.036), fatty acids 20:3 (homo-gamma-linolenic acid (p = 0.036), galactosamine (p = 0.007), and FA 18:3 (linolenic acid) (P = 0.012). Principal component analysis showed that the metabolomic profiles differ between tumor tissue and patient plasma.

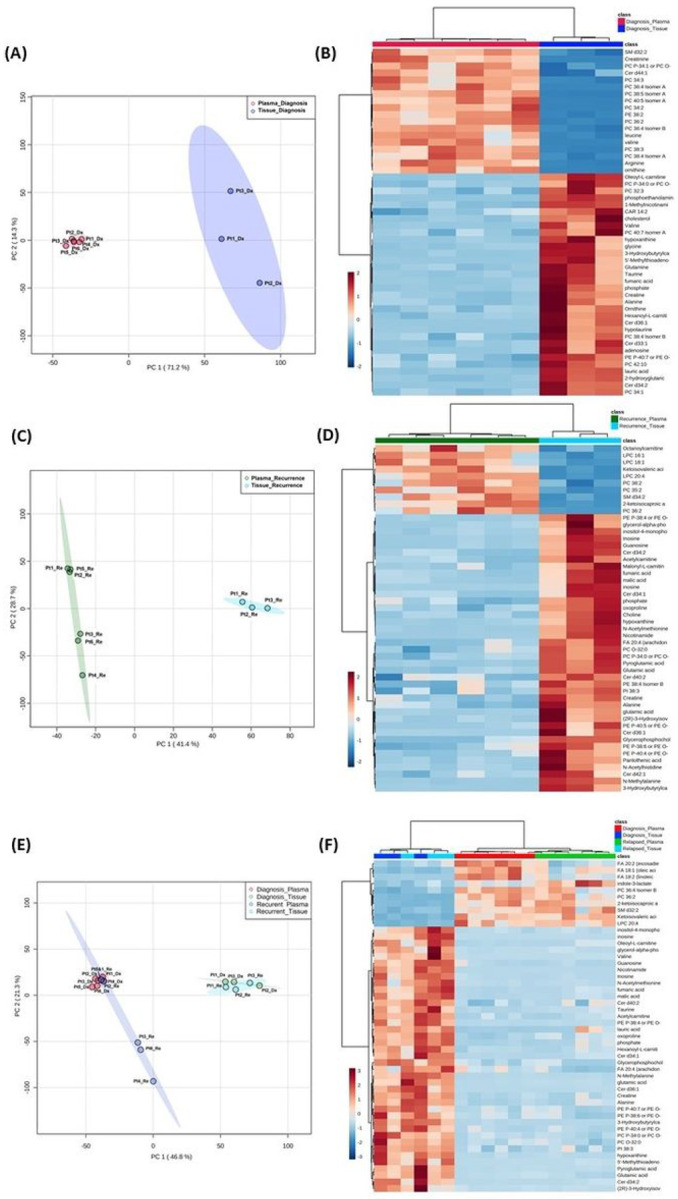
Conclusions: Our data suggest that metabolomic profiles of human GBM tissue and patient plasma differ at diagnosis and at recurrence. Many metabolites involved in tumorigenesis and metabolomic flexibility were identified. A larger study using targeted metabolomic assay is warranted to measure the levels of these metabolites, which will help identify the metabolomic signatures in both GBM tissue and patient plasma for risk stratification, clinical outcome prediction, and development of new adjuvant metabolomic-targeting therapy.

Keywords: biomarker; feasibility; glioblastoma; pilot; untargeted metabolomics.


Figures

Figure 1
Figure 1
Comparison of metabolomic profiles of 9 glioblastoma tumor tissue specimens at diagnosis and 3 tissue specimens at recurrence. (A) Principal component analysis (PCA) plot showing different trends of metabolomic characteristics between tissues at diagnosis (purple) and tissue at recurrence (light blue). (B) Heatmap of the top 50 altered metabolites at diagnosis and at recurrence. Blue indicates decreased peak value and maroon indicates increased peak value of each compound listed. (C) Volcano plot of up regulated metabolites in red and down regulated metabolites in blue in glioblastoma tumor tissue specimens at recurrence comparing to at diagnosis using p-value of <0.05 and fold change cutoffs of 1.5. (D) Plots of individual values for each metabolite demonstrating peak value changes at diagnosis and at recurrence in brain tumor tissue. Values were determined as peak heights from LC/MS analysis. Single asterisk indicates a p value of <0.05. Double asterisks indicate a p value of <0.01.
Figure 2
Figure 2
Comparison of metabolomic profiles of 3-paired fresh frozen brain tumor tissue specimens at diagnosis and at recurrence. (A) Principal component analysis (PCA) plot showing different trends of metabolomic characteristics between tissues at diagnosis (purple) at tissue at recurrence (light blue). (B) Heatmap of the top 50 altered metabolites. Blue indicates decreased peak value and red indicates increased peak value of each compound listed. (C) Volcano plot of up regulated metabolites in red and down regulated metabolites in blue in glioblastoma tumor tissue specimens at recurrence comparing to at diagnosis using p-value of <0.05 and fold change cutoffs of 1.5. (D) Plots of individual values for each metabolite demonstrating peak value changes at diagnosis and at recurrence in brain tumor tissue. Values were determined as peak heights from LC/MS analysis. Single asterisk indicates a p value of <0.05. Double asterisks indicate a p value of <0.01.
Figure 3
Figure 3
Comparison of metabolomic profiles in plasma of glioblastoma patients at diagnosis and at recurrence. (A) Principal component analysis (PCA) plot showing different trends of metabolomic characteristics between tissues at diagnosis (purple) at tissue at recurrence (light blue). (B) Heatmap of the top 50 altered metabolites. Blue indicates decreased peak value and red indicates increased peak value of each compound listed. (C) Volcano plot of up regulated metabolites in red and down regulated metabolites in blue in glioblastoma tumor tissue specimens at recurrence comparing to at diagnosis using p-value of <0.05 and fold change cutoffs of 1.5. Single asterisk indicates a p value of <0.05. Double asterisks indicate a p value of <0.01. (D) Progression free survival of 6 patients whose plasma samples were analyzed. (E) Significantly altered metabolite clusters by ChemRich, a statistical enrichment approach based on chemical similarity. The size of the dots is in proportion with the level of alteration in each cluster of metabolites. Red indicates increased peak value and blue indicates decreased peak value. (F) Box plots demonstrating metabolite peak value changes at diagnosis and at recurrence in brain tumor tissues. Values were determined as peak height from LC/MC analysis. Single asterisk indicates a p value of <0.05. Double asterisks indicate a p value of <0.01.
Figure 4
Figure 4
Comparison of metabolomic profiles in glioblastoma tumor tissue and patient plasma. (A, C, E) Principal component analysis plots comparing tissue vs plasma specimens at diagnosis, tissue vs plasma at recurrence, and all four specimen groups. (B, D, F) Heatmaps of the top 50 significantly altered metabolites in the comparisons correlating with A, C, and E, respectively.

References

    1. Ostrom QT, Cioffi G, Waite K, Kruchko C, Barnholtz-Sloan JS (2021) CBTRUS Statistical Report: Primary Brain and Other Central Nervous System Tumors Diagnosed in the United States in 2014–2018. Neuro Oncol 23:iii1–iii105. 10.1093/neuonc/noab200 - DOI - PMC - PubMed
    1. Stupp R, Mason WP, van den Bent MJ, Weller M, Fisher B, Taphoorn MJ, Belanger K, Brandes AA, Marosi C, Bogdahn U, Curschmann J, Janzer RC, Ludwin SK, Gorlia T, Allgeier A, Lacombe D, Cairncross JG, Eisenhauer E, Mirimanoff RO, European Organisation for R, Treatment of Cancer Brain T, Radiotherapy G, National Cancer Institute of Canada Clinical Trials G (2005) Radiotherapy plus concomitant and adjuvant temozolomide for glioblastoma. N Engl J Med 352: 987–996 doi:10.1056/NEJMoa043330 - DOI - PubMed
    1. Perry JR, Laperriere N, Mason WP (2017) Radiation plus Temozolomide in Patients with Glioblastoma. N Engl J Med 376:2197. 10.1056/NEJMc1704726 - DOI - PubMed
    1. Oronsky B, Reid TR, Oronsky A, Sandhu N, Knox SJ (2020) A Review of Newly Diagnosed Glioblastoma. Front Oncol 10:574012. 10.3389/fonc.2020.574012 - DOI - PMC - PubMed
    1. Hanahan D (2022) Hallmarks of Cancer: New Dimensions. Cancer Discov 12:31–46. 10.1158/2159-8290.CD-21-1059 - DOI - PubMed

Publication types

LinkOut - more resources