[Preprint]. 2023 Mar 8:2023.03.07.23286905.
doi: 10.1101/2023.03.07.23286905.

Potentially causal associations between placental DNA methylation and schizophrenia and other neuropsychiatric disorders

Affiliations

Potentially causal associations between placental DNA methylation and schizophrenia and other neuropsychiatric disorders

Ariadna Cilleros-Portet et al. medRxiv. .

Update in

  • Potentially causal associations between placental DNA methylation and schizophrenia and other neuropsychiatric disorders.
    Cilleros-Portet A, Lesseur C, Marí S, Cosin-Tomas M, Lozano M, Irizar A, Burt A, García-Santisteban I, Garrido-Martín D, Escaramís G, Hernangomez-Laderas A, Soler-Blasco R, Breeze CE, Gonzalez-Garcia BP, Santa-Marina L, Chen J, Llop S, Fernández MF, Vrijheid M, Ibarluzea J, Guxens M, Marsit C, Bustamante M, Bilbao JR, Fernandez-Jimenez N. Cilleros-Portet A, et al. Nat Commun. 2025 Mar 14;16(1):2431. doi: 10.1038/s41467-025-57760-3. Nat Commun. 2025. PMID: 40087310 Free PMC article.

Abstract

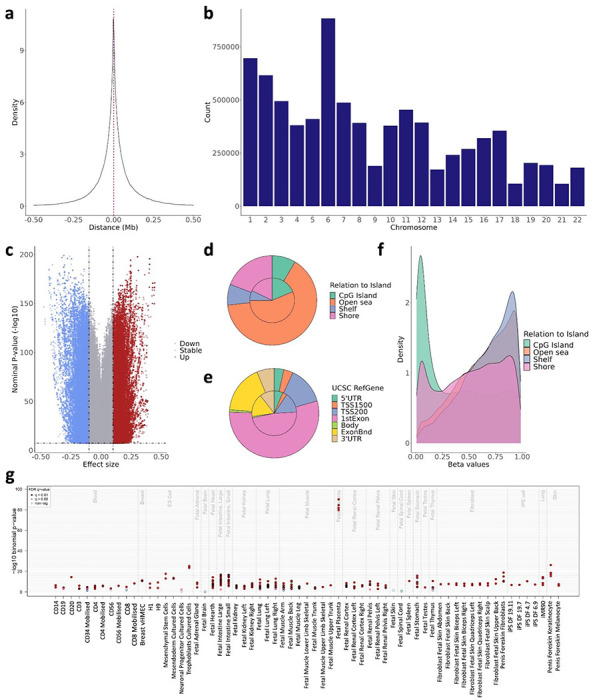
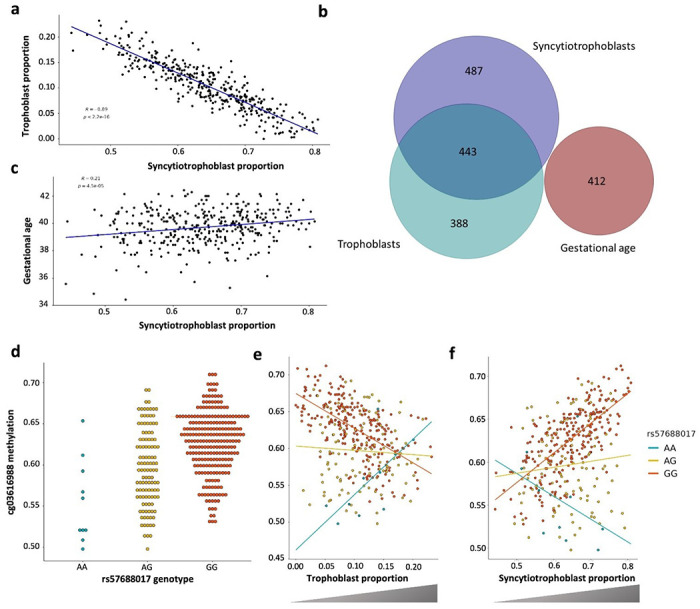
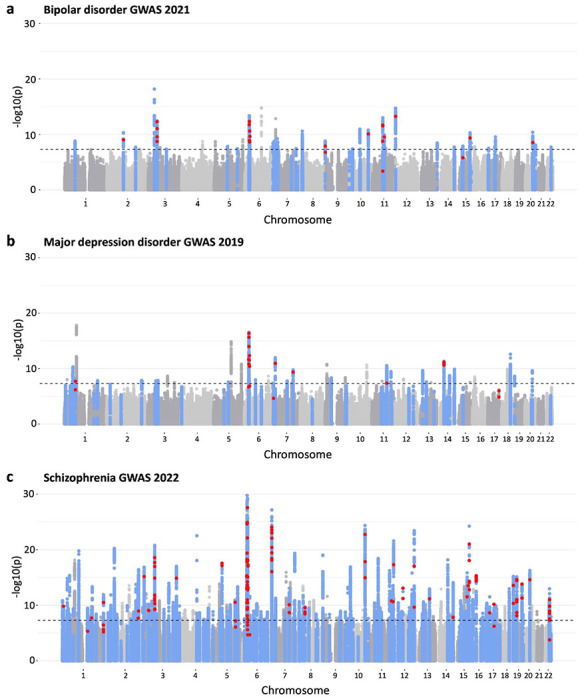
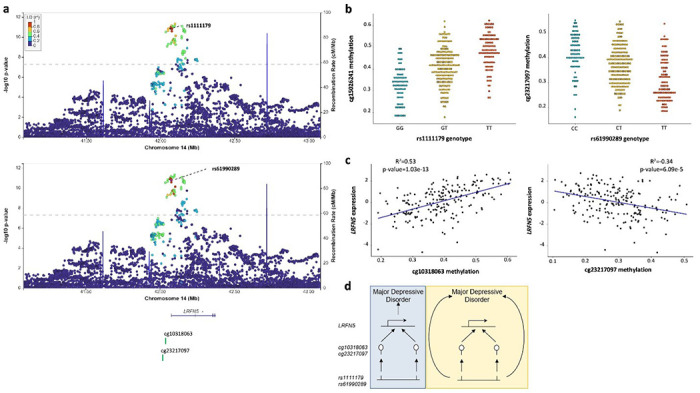
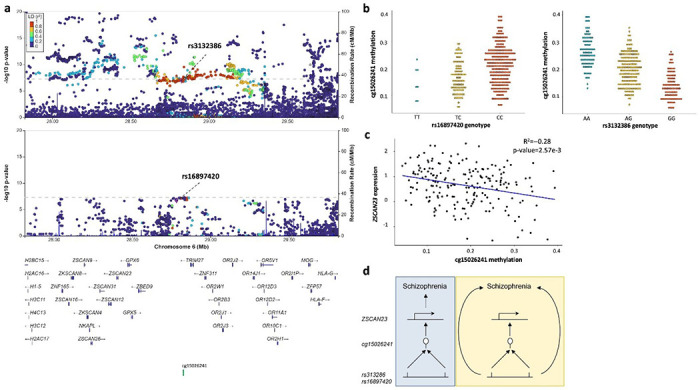
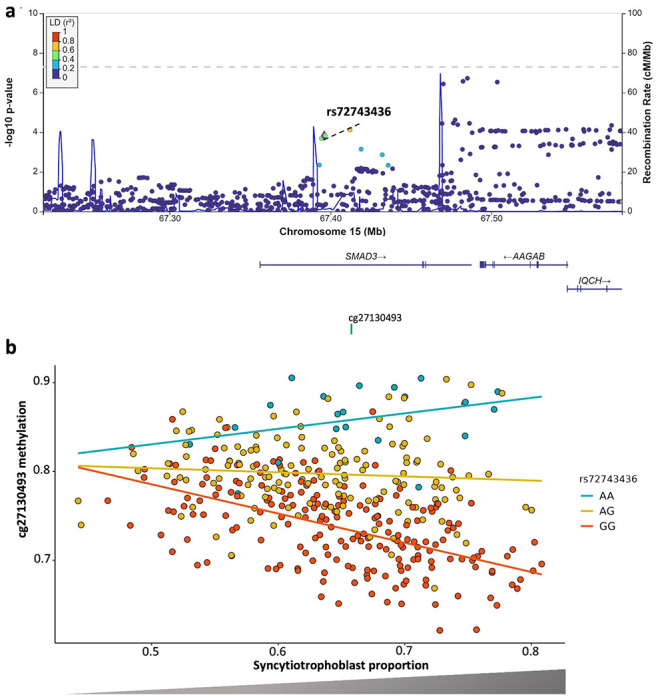
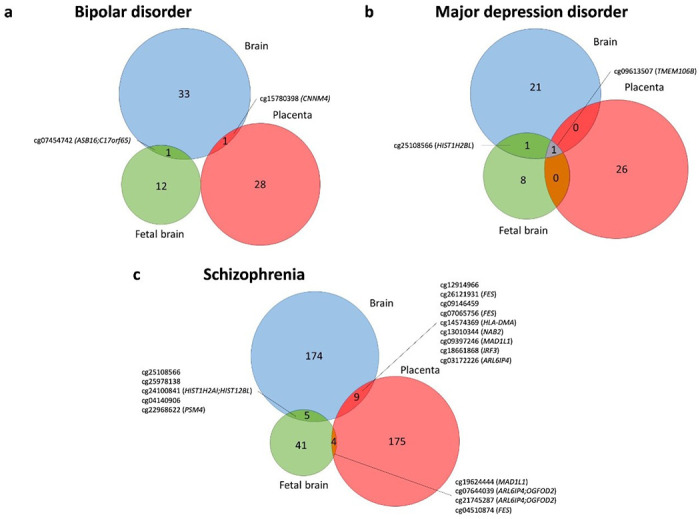
Increasing evidence supports the role of placenta in neurodevelopment and potentially, in the later onset of neuropsychiatric disorders. Recently, methylation quantitative trait loci (mQTL) and interaction QTL (iQTL) maps have proven useful to understand SNP-genome wide association study (GWAS) relationships, otherwise missed by conventional expression QTLs. In this context, we propose that part of the genetic predisposition to complex neuropsychiatric disorders acts through placental DNA methylation (DNAm). We constructed the first public placental cis-mQTL database including nearly eight million mQTLs calculated in 368 fetal placenta DNA samples from the INMA project, ran cell type- and gestational age-imQTL models and combined those data with the summary statistics of the largest GWAS on 10 neuropsychiatric disorders using Summary-based Mendelian Randomization (SMR) and colocalization. Finally, we evaluated the influence of the DNAm sites identified on placental gene expression in the RICHS cohort. We found that placental cis-mQTLs are highly enriched in placenta-specific active chromatin regions, and useful to map the etiology of neuropsychiatric disorders at prenatal stages. Specifically, part of the genetic burden for schizophrenia, bipolar disorder and major depressive disorder confers risk through placental DNAm. The potential causality of several of the observed associations is reinforced by secondary association signals identified in conditional analyses, regional pleiotropic methylation signals associated to the same disorder, and cell type-imQTLs, additionally associated to the expression levels of relevant immune genes in placenta. In conclusion, the genetic risk of several neuropsychiatric disorders could operate, at least in part, through DNAm and associated gene expression in placenta.


Figures

Figure 1.
Figure 1.. Characterization of the placental cis-mQTLs from the nominal database.
The distance between the SNP-CpG pair participating in the reported cis-mQTLs is displayed as a density plot, where the X-axis represents the distance in Mb. The red line represents the median distance of 44 kb. The distribution of the reported cis-mQTLs along the chromosomes is shown in the b barplot, where the X-axis represents the autosomal chromosomes. The uniform distribution of the effect size from the reported cis-mQTLs is pictured in the c volcano plot, where the Y-axis illustrates the −log10 nominal p-value, and the X-axis the effect size. The blue and the red dots represent the mQTLs with a negative and positive effect, respectively. The distribution of the EPIC array probes (inner circle) and the nominal mQTL-CpGs (outer circle) considering the Relation To Island and the UCSC RefGene annotation is displayed in the d and e piecharts, respectively. The methylation beta values, ranging from 0 to 1, of the participating mQTL-CpGs stratified by the Relation To Island annotation is shown in the f density plot, where the methylation values are found in the X-axis. The eFORGE enrichment of DNase I hotspots considering the top 10,000 nominal mQTL-CpGs is shown in the g plot. The Y-axis represents the −log10 binomial p-value of the enrichment, and the X-axis to the tissue. False Discovery Rate (FDR) corrected q-values below 0.01 and 0.05 are represented by red and pink dots, respectively, while blue dots show q-values >0.05.
Figure 2.
Figure 2.. STB-, TB- and GA-imQTLs.
The correlation between STB and TB cell types (N=368) is shown in a, the X-axis representing the STB proportion in the sample set, and the Y-axis showing the estimated TB proportion. The intersection between STB-, TB- and GA-imQTLs is represented in the b Venn diagram. The correlation between STB and GA (N=368) is shown in c, the X-axis representing the STB proportion in the sample set, and the Y-axis showing the GA. The standard cg03616988-rs57688017 mQTL, as well as the TB- and STB-imQTLs, are displayed in the d, e and f dotplots, respectively. In all three, the Y-axes represent the cg03616988 DNAm beta values, ranging from 0 to 1. In d, the X-axis displays the genotype of rs57688017, while in e and f, the X-axes show the TB and STB proportion, respectively.
Figure 3.
Figure 3.. Manhattan plot of BIP, MDD and SCZ GWAS highlighting the SMR and coloc results.
The original GWAS from BIP, MDD and SCZ were plotted in the a, b and c Manhattan plots, respectively. In the Y-axes the original −log10 p-values are displayed, and in the X-axis the chromosomes. The blue dots represent genomic regions significantly colocalizing with our placental mQTLs, and the red dots are mQTL-SNPs associated with CpGs that have been shown to pleiotropically associate with either BIP, MDD or SCZ in the SMR approach. Therefore, the blue dots represent the colocalization results, and the red dots show the SMR results.
Figure 4.
Figure 4.. Two different CpGs pleiotropically associated with MDD.
The mQTL-SNPs rs1111179 and rs61990289, highlighted as purple diamonds, with the −log10 p-values of the original MDD GWAS are represented in the a locusZoom plot. The X-axis displays the involved genomic region of chromosome 14 in Mb, showing the distribution of the coding genes in the locus, as well as the location of the cg10318063 and cg23217097 mQTL-CpGs. The Y-axis shows the −log10 p-value from the original GWAS, and the SNPs are colour coded as a function of the LD with the highlighted SNP. The two significant mQTLs, rs1111179-cg10318063 and rs61990289-cg32217097, are plotted in the b dotplots, where Y-axis represents the beta DNAm values of the indicated CpG, ranging from 0 to 1. The X-axes display the genotype of the indicated SNPs. The eQTM of cg10318063 and cg32217097 mQTL-CpGs are portrayed in the c dotplots, where X-axis represents the DNAm values from each involved CpG, ranging from 0 to 1. The Y-axes display the expression values of the LFRN5 gene in placenta. The hypothesis of the pleiotropical association between the SNPs, the DNAm values of the CpGs in placenta, the gene expression levels of LFRN5 in placenta and MDD are schematically represented in d. The vertical pleiotropy (or causal association) hypothesis is represented with a blue backgroud, and the horizontal pleiotropy hypothesis is highlighted with a yellow background.
Figure 5.
Figure 5.. One CpGs is pleiotropically associated to SCZ, and marked by two independent signals.
The two mQTL-SNPs rs313286 and rs16897420, highlighted as purple diamonds, are shown in the original (top) and the conditional (bottom) SCZ GWAS in the a locusZoom plot. The X-axis displays the involved genomic region in chromosome 6 in Mb, showing the distribution of the coding genes in the locus, as well as the location of the mQTL-CpG cg15026241. The Y-axis shows the −log10 p-value from the original and conditional GWAS, and the SNPs are colour coded as a function of the LD with the highlighted SNP. The two significant mQTLs, rs16897420-cg15026241 and rs3132386-cg15026241, are plotted in the b dotplots, where Y-axes represent the cg15026241 beta DNAm values, ranging from 0 to 1. The X-axis displays the genotype of the corresponding SNPs. The eQTM of the significant mQTL-CpG is portrayed in the c dotplot, where the X-axis shows the DNAm values of the cg15026241 CpG, ranging from 0 to 1. The Y-axis displays the expression values of the ZSCAN23 gene in placenta. The hypothesis of the pleiotropical association between the SNPs, the DNAm values of the CpGs in placenta, the gene expression levels of ZSCAN23 in placenta and MDD are schematically represented in d. The vertical pleiotropy (or causal association) hypothesis is represented with a blue backgroud, and the horizontal pleiotropy hypothesis is highlighted with a yellow background.
Figure 6.
Figure 6.. STB-imQTL pleiotropically associated with BIP.
The mQTL-SNP rs72743436, highlighted as a purple diamond, is shown in the original BIP GWAS in the a locusZoom plot. The X-axis displays the involved genomic region in chromosome 15 in Mb, showing the distribution of the coding genes in the locus, as well as the location of the mQTL-CpG cg27130493. The Y-axis shows the −log10 p-value from the original GWAS, and the SNPs are colour coded as a function of LD with the highlighted SNP. The STB-imQTL is pictured in the b dotplot. The X-axis represents the cg27130493 beta DNAm values and the Y-axis the STB proportion, both ranging from 0 to 1. The genotype of rs72743436 SNP-imQTL is colour coded as indicated in the legend.
Figure 7.
Figure 7.. Overlap between the SMR results in brain, placenta and fetal brain, in BIP, MDD and SCZ.
The overlap between the mQTL-CpGs pleiotropically associated between the three tissues and BIP, MDD and SCZ are represented in the a, b and c Venn diagrams, respectively. Overlapping mQTL-CpGs are shown, and also the closest gene from the Illumina annotation file (between brackets).

References

    1. Strauss R.S. Effects of the intrauterine environment on childhood growth. Br. Med. Bull. 53, 81–95 (1997). - PubMed
    1. Barker D.J. The fetal and infant origins of adult disease. BMJ. 301, 1111 (1990). - PMC - PubMed
    1. O’Donnell K., O’Connor T. G., & Glover V. Prenatal stress and neurodevelopment of the child: focus on the HPA axis and role of the placenta. Dev. Neurosci. 31, 285–292 (2009). - PubMed
    1. Lapehn S., Paquette A.G. The Placental Epigenome as a Molecular Link Between Prenatal Exposures and Fetal Health Outcomes Through the DOHaD Hypothesis. Curr. Environ. Health. Rep. 9, 490–501 (2022). - PMC - PubMed
    1. Lester B.M., Marsit C.J. Epigenetic mechanisms in the placenta related to infant neurodevelopment. Epigenomics 10, 321–333 (2018). - PMC - PubMed

Publication types