[Preprint]. 2023 Mar 6:2023.03.03.531019.
doi: 10.1101/2023.03.03.531019.

Cellos: High-throughput deconvolution of 3D organoid dynamics at cellular resolution for cancer pharmacology

Affiliations

Cellos: High-throughput deconvolution of 3D organoid dynamics at cellular resolution for cancer pharmacology

Patience Mukashyaka et al. bioRxiv. .

Update in

Abstract

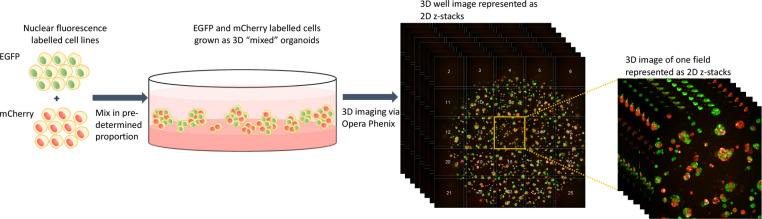
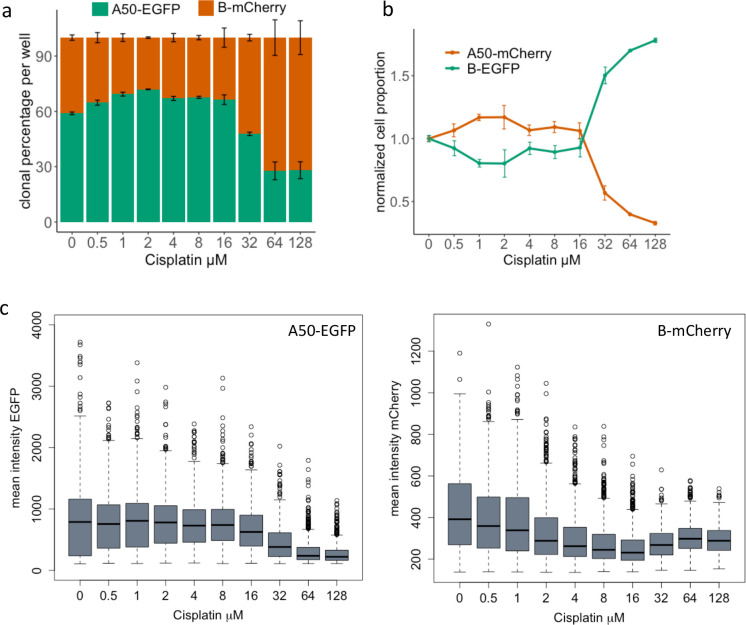
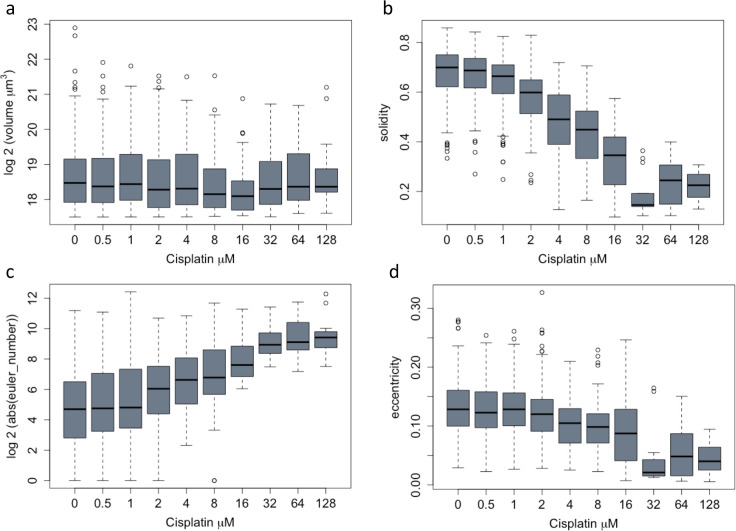
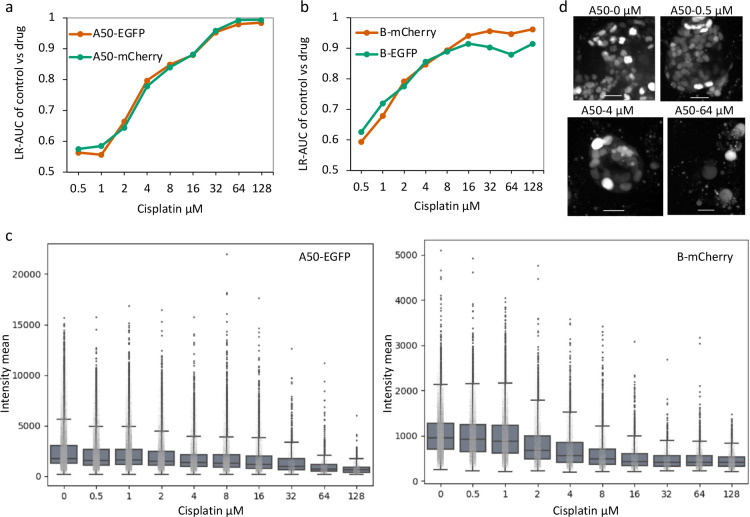
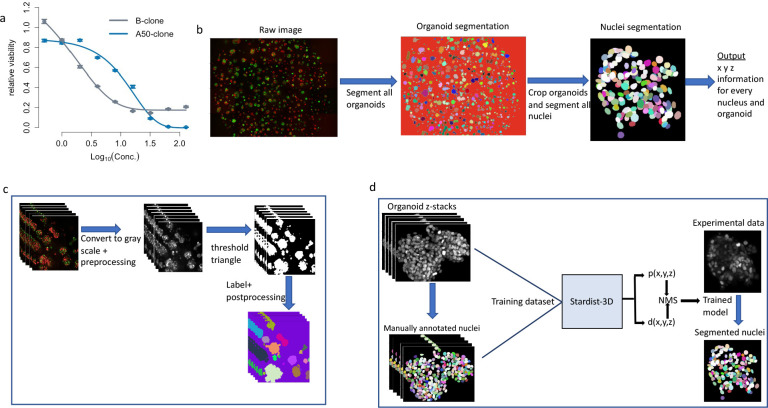
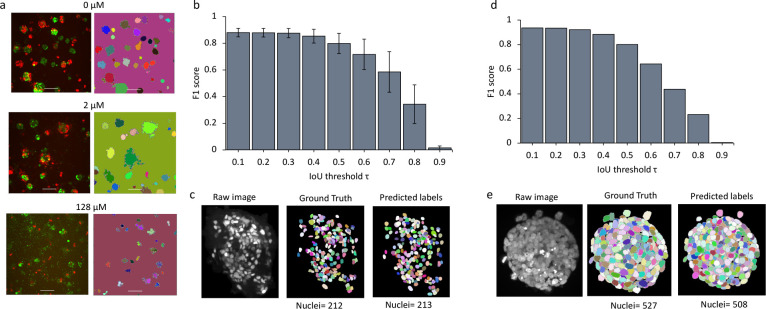
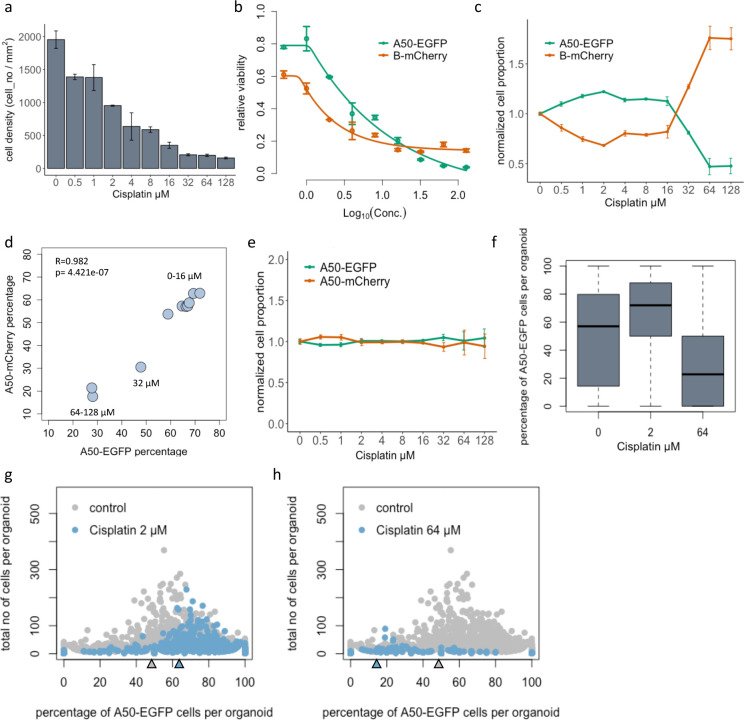
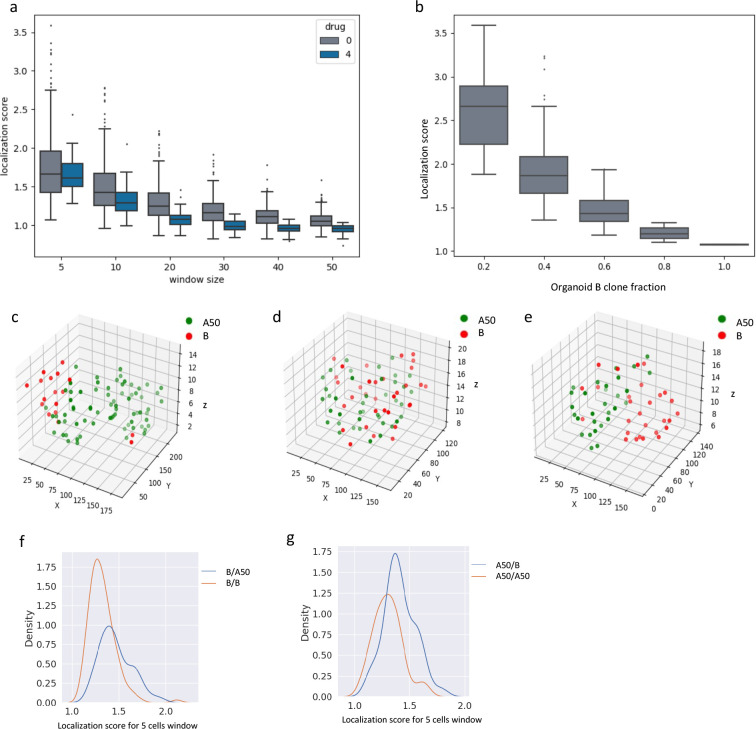
Three-dimensional (3D) culture models, such as organoids, are flexible systems to interrogate cellular growth and morphology, multicellular spatial architecture, and cell interactions in response to drug treatment. However, new computational methods to segment and analyze 3D models at cellular resolution with sufficiently high throughput are needed to realize these possibilities. Here we report Cellos (Cell and Organoid Segmentation), an accurate, high throughput image analysis pipeline for 3D organoid and nuclear segmentation analysis. Cellos segments organoids in 3D using classical algorithms and segments nuclei using a Stardist-3D convolutional neural network which we trained on a manually annotated dataset of 3,862 cells from 36 organoids confocally imaged at 5 μm z-resolution. To evaluate the capabilities of Cellos we then analyzed 74,450 organoids with 1.65 million cells, from multiple experiments on triple negative breast cancer organoids containing clonal mixtures with complex cisplatin sensitivities. Cellos was able to accurately distinguish ratios of distinct fluorescently labelled cell populations in organoids, with ≤3% deviation from the seeding ratios in each well and was effective for both fluorescently labelled nuclei and independent DAPI stained datasets. Cellos was able to recapitulate traditional luminescence-based drug response quantifications by analyzing 3D images, including parallel analysis of multiple cancer clones in the same well. Moreover, Cellos was able to identify organoid and nuclear morphology feature changes associated with treatment. Finally, Cellos enables 3D analysis of cell spatial relationships, which we used to detect ecological affinity between cancer cells beyond what arises from local cell division or organoid composition. Cellos provides powerful tools to perform high throughput analysis for pharmacological testing and biological investigation of organoids based on 3D imaging.


Figures

Extended data fig 1:
Extended data fig 1:. Schematic representation of 3D organoid culture and imaging platform.
EGFP and mCherry labeled cells are mixed in pre-determined proportion in culture to form 3D “mixed” organoids. The Opera Phenix system is then used to image the organoids in 3D. 25 fields are imaged per well.
Extended data fig.2:
Extended data fig.2:. Quantification of fluorescently labelled cell populations at the organoid resolution.
Number of EGFP vs mCherry cells detected in each homogeneously mixed B organoid. Each dot depicts an organoid. Seeding conditions of EGFP-20% (blue), EGFP-40% (orange), EGFP-60% (green) and EGFP-80% (red) are shown from left to right. Slope of the fitted linear regression is noted.
Extended data fig.3:
Extended data fig.3:. Quantification of clonal response to cisplatin treatment.
a. Percentage of A50-EGFP and B-mCherry cells detected by Cellos for increasing concentrations of cisplatin treatment. Each well was treated for 4 days. Values represent mean clonal percentages across three replicates and error bars show standard deviation. b. Normalized cell proportions for A50-mCherry and B-EGFP clones when co-cultured as heterogeneously mixed organoids and treated with cisplatin for 4 days. Mean and standard deviation values of replicates for each condition are plotted. c. Mean intensity of EGFP (left panel) or mCherry (right panel) in heterogeneously mixed organoids consisting of A50-EGFP and B-mCherry. Organoids from three replicate wells are combined.
Extended data fig.4.
Extended data fig.4.. Changes in organoid morphologies due to cisplatin treatment.
Volume (a), solidity (b), Euler number (c) and eccentricity (d) for segmented large organoids after exposure to range of cisplatin treatment for 4 days.
Extended data fig.5:
Extended data fig.5:. Changes in nuclear morphologies due to cisplatin treatment.
a. Logistic regression classifications AUC of nuclear morphologies of A50-EGFP or A50-mCherry cells when comparing nuclei in control with nuclei exposed to cisplatin for 4 days. b. Logistic regression classifications AUC of nuclear morphologies of B-EGFP or B-mCherry cells when comparing nuclei in control with nuclei exposed to cisplatin for 4 days. c. Mean intensity of A50-EGFP (left) and B-mCherry (right) nuclei after cisplatin exposure for 4 days. d. Representative images of A50-EGFP cell nuclei at day 4 post select concentrations of cisplatin exposure. Scale bar represents 25 μm.
Extended data fig.6:
Extended data fig.6:. Identification of cellular localization in organoids by Cellos.
a. Distribution of localization score vs. window size (5, 10, 20, 30, 40, 50) for A50-EGFP cells within heterogeneously mixed organoids. Organoids from control and 4 μM cisplatin exposure for 4 days were used for this analysis. b, c Localization scores for A50-EGFP cells in the 5 cell and 10 cell window size in organoids with varying proportions of A50 clone fraction are plotted. Organoids are grouped in bins with increments of 0.2 for the A50 cell fraction. d. Localization scores for B-mCherry cells (10 cell window size) in organoids with varying proportions of B clone fraction are plotted.
Extended data fig.7:
Extended data fig.7:. Computational process of calculating image area that contains organoids.
a. Schematic representation of the pipeline to detect the area of the image with organoids in focus. b, c. Examples of segmented organoids image (left panel) and Cellos-detected area of the image with organoids in focus, shown in yellow (right panel). Images are z-axis maximum projections.
Figure 1.
Figure 1.. Outline of Cellos pipeline and cellular system.
a. Cisplatin IC50 curves for two clones A50 (blue line) and B (gray line) from 3D homogeneously mixed organoids using cell-destructive luminescence readout. b. Cellos: Two-stage pipeline for 3D organoids and nuclei segmentation. c. Steps for 3D organoid segmentation. The inputs are 3D z-stack images, and the outputs are the segmented and labeled organoids. d. Steps for nuclei segmentation. A Stardist-3D with Resnet backbone model is trained using the training dataset. The trained model is then applied to experimental data with individual segmented organoids as input, and segmented and labelled nuclei as outputs.
Figure 2:
Figure 2:. Evaluation of organoid and nuclei segmentation.
a. For each pair of images, the left shows fluorescence z-axis maximum projections with A50 cells labeled with EGFP and B cells labeled with mCherry. The right panel shows organoids segmented by Cellos. Individual organoids are in distinct colors. Organoids from untreated, 2 μM, and 128 μM cisplatin wells are shown. b. F1 score for organoid identification vs. IoU threshold. Mean and standard deviation across six cross-validations is shown. c. Example EGFP-labeled organoid image (left panel) with manually annotated ground truth nuclei annotations (middle panel) and Cellos predicted labels (right panel) respectively. Images are z-axis maximum projections. d. F1 score of Cellos nuclei segmentation in spheroids of breast carcinoma from Boutin et al. vs. IoU threshold. e. Example DAPI stained image (left panel) from Boutin et al. with ground truth (middle panel) and Cellos predictions (right panel), respectively.
Figure 3.
Figure 3.. Cellos distinguishes proportions of co-cultured cells.
a. Representative z-axis maximum projection images of homogeneously mixed organoids generated with seeding percentages of 20%, 40%, 60% and 80% A50-EGFP, respectively, with the remaining cells being A50-mCherry. Images are at day4. Scale bar represents 100 μm. b. Stacked bar plot showing the percentage of EGFP and mCherry cells detected by Cellos at day0 and day4 for each of the seeding conditions from Fig.3a (left panel). Analogous experiments for B-EGFP+B-mCherry mixed organoids (right panel). Error bars indicate standard deviation calculated from three replicate wells for each condition. c. Number of cells labelled with EGFP vs. mCherry detected in each homogeneously mixed A50 organoid. Each dot depicts an organoid. Seeding conditions of EGFP-20% (blue), EGFP-40% (orange), EGFP-60% (green) and EGFP-80% (red) are shown from left to right. The slope of the fitted linear regression is noted.
Figure 4.
Figure 4.. Cellos quantification of treatment response for organoids consisting of co-cultured clones.
a. Total cell density (A50 and B) after exposure to cisplatin (0–128 μM) for 4 days. Mean and standard deviation across three replicate wells per condition are shown. b. IC50 curves for A50-EGFP and B-mCherry clones when co-cultured in heterogeneously mixed organoids, with standard deviation across triplicates shown for each condition. c. Normalized cell proportions vs. cisplatin treatment concentration range, for A50-EGFP and B-mCherry clones cultured as mixed organoids. d. Correlation of A50 clonal percentages post cisplatin treatment, when labeled with either nuclear EGFP or mCherry and mixed to form organoids with B clones labelled with the contrasting fluorescent channel. e. Normalized cell proportions vs cisplatin treatment concentration range, for A50-EGFP and A50-mCherry clones co-cultured as mixed organoids. f. Distribution of percentage of A50-EGFP cells per organoid when mixed with B-mCherry cells after 0, 2 and 64 μM cisplatin exposure. Triplicate wells are merged. g. Percent A50-EGFP cells per organoid versus total cells. Each dot represents an organoid. Gray = untreated. Left panel: Blue = 2 μM cisplatin. Right panel: Blue = 64 μM cisplatin. Black arrow indicates median for the control. Red arrow indicates median for the treatment.
Figure 5.
Figure 5.. Changes in organoid and nuclear morphological features after cisplatin treatment.
a. Organoid volume (μm3), b. Solidity and c. Cell number after cisplatin treatment for 4 days. d. Cell density within large (>1.85×105 μm3) organoids after 4 days of cisplatin exposure. e. Logistic regression classifications based on nuclear morphology, for classification of control nuclei vs. cisplatin-treated nuclei. A50-EGFP and B-mCherry cells are analyzed separately. LR-AUC indicates area under the curve of the logistic regression classifier for the specified comparison. f. Nuclear volume of A50-EGFP and B-mCherry cells for a range of cisplatin concentrations. Mean values with standard deviation for triplicate wells are plotted. g. Representative images of B-mCherry cell nuclei at day 4 post cisplatin exposure. Scale bar represents 25 μm.
Figure 6:
Figure 6:. Investigation of cell-cell spatial relationships within organoids.
a. Localization score vs. window size (5, 10, 20, 30, 40 and 50 cells) for B-mCherry cells within heterogeneously mixed organoids. Control and 4 μM cisplatin data are shown. b. Localization score for B-mCherry cells in organoids (5 cell window), stratified by B clone fraction in the organoid. Organoids are binned in increments of 0.2 for the B cell fraction. c, d, e. Spatial location of nuclei centroids in representative organoids plotted in 3D. f. Distribution of localization score of B clones (in 5-cell window) when mixed with A50 (blue line) or with alternately labeled B (orange line). g. Distribution of localization score of A50 clones when mixed with B (blue line) or with alternately labeled A50 (orange line).

References

    1. Yoshii Y. et al. High-throughput screening with nanoimprinting 3D culture for efficient drug development by mimicking the tumor environment. Biomaterials 51, 278–289 (2015). - PubMed
    1. Costa E. C. et al. 3D tumor spheroids: an overview on the tools and techniques used for their analysis. Biotechnol Adv 34, 1427–1441 (2016). - PubMed
    1. Jensen C. & Teng Y. Is It Time to Start Transitioning From 2D to 3D Cell Culture? Frontiers Mol Biosci 7, 33 (2020). - PMC - PubMed
    1. Langhans S. A. Using 3D in vitro cell culture models in anti-cancer drug discovery. Expert Opin Drug Dis 16, 1–10 (2021). - PubMed
    1. Ravi M., Paramesh V., Kaviya S. R., Anuradha E. & Solomon F. D. P. 3D Cell Culture Systems: Advantages and Applications. J Cell Physiol 230, 16–26 (2015). - PubMed

Publication types