[Preprint]. 2023 Mar 7:2023.03.03.23286760.
doi: 10.1101/2023.03.03.23286760.

RNA Polymerase II pausing temporally coordinates cell cycle progression and erythroid differentiation

Affiliations

RNA Polymerase II pausing temporally coordinates cell cycle progression and erythroid differentiation

Danya J Martell et al. medRxiv. .

Update in

Abstract

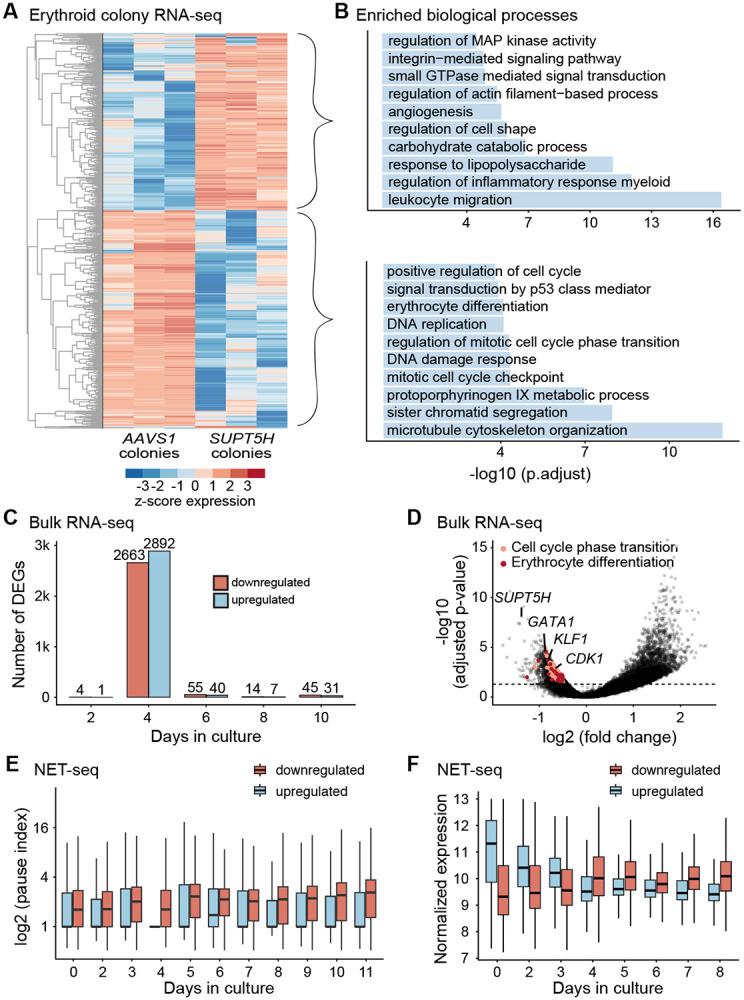
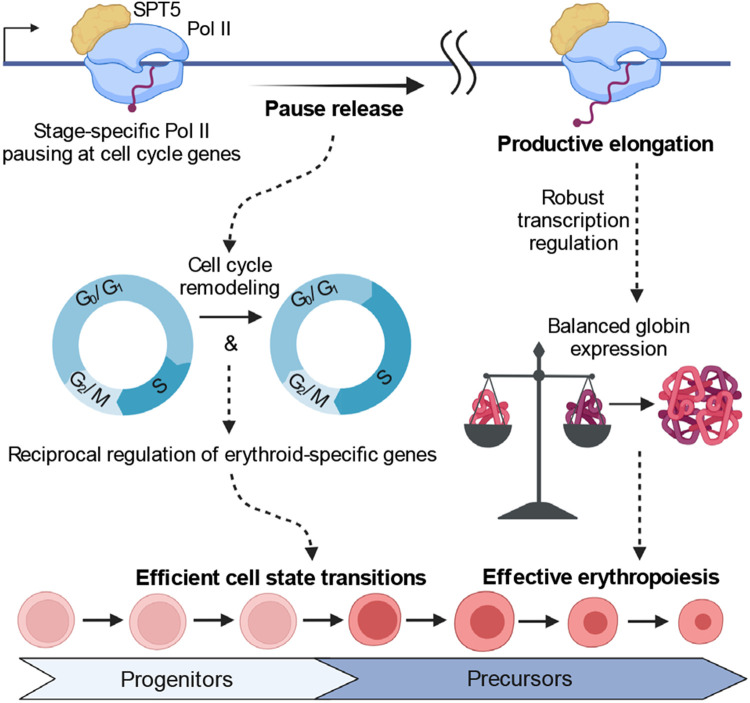
The controlled release of promoter-proximal paused RNA polymerase II (Pol II) into productive elongation is a major step in gene regulation. However, functional analysis of Pol II pausing is difficult because factors that regulate pause release are almost all essential. In this study, we identified heterozygous loss-of-function mutations in SUPT5H , which encodes SPT5, in individuals with β-thalassemia unlinked to HBB mutations. During erythropoiesis in healthy human cells, cell cycle genes were highly paused at the transition from progenitors to precursors. When the pathogenic mutations were recapitulated by SUPT5H editing, Pol II pause release was globally disrupted, and the transition from progenitors to precursors was delayed, marked by a transient lag in erythroid-specific gene expression and cell cycle kinetics. Despite this delay, cells terminally differentiate, and cell cycle phase distributions normalize. Therefore, hindering pause release perturbs proliferation and differentiation dynamics at a key transition during erythropoiesis, revealing a role for Pol II pausing in the temporal coordination between the cell cycle and differentiation.


Conflict of interest statement

Declaration of interests

V.G.S. serves as an advisor to and/or has equity in Branch Biosciences, Ensoma, Novartis, Forma, Sana Biotechnology, and Cellarity, all unrelated to the present work. J.C.U. is an employee of Illumina, Inc., unrelated to the present work. R.I. is a founder, board member and shareholder of Cellforma, unrelated to the present work.

Figures

Figure 1.
Figure 1.. Pol II promoter-proximal pausing is enriched at cell cycle genes during human erythroid differentiation.
(A) Schematic of NET-seq time course with daily sampling during human erythropoiesis (left). Transcript per million (TPM) normalized read counts for the HBB gene throughout erythropoiesis (right); y axis showing range of 0–15 normalized counts. (B) Principal component analysis plot of NET-seq expression data colored by day of erythroid differentiation; n = 2 donors. (C) Dynamic pausing during erythropoiesis, showing protein coding genes with PI > 4 (n > 3500 genes for all days), significant differences in pausing seen for each day relative to the previous day, except for days 2 and 9; p-values < 0.01 from t-test. (D) Pausing indices of genes in Figure 1C separated by ~progenitor cells (days 0 to 5, n = 39,466 genes) and ~precursor cells (days 6 to 11, n = 27,672 genes); t-test. (E) Heatmap of paused genes during erythropoiesis; unsupervised k-means clustering yielded five clusters. Values are z-score of per day average pause index from two donors. (F) Enriched Gene Ontology biological processes for clusters 3 and 5 of paused genes shown in E, other clusters had no significantly enriched biological processes. The top five enriched processes are shown with their - log10 (p.adjust). P-values: *: p<0.05; **: p<0.01; ***: p<0.001
Figure 2.
Figure 2.. Pol II promoter-proximal pause release is hindered in human hematopoietic cells upon perturbation of SUPT5H.
(A) Schematic of genome editing of human HSPCs from healthy donors in an isogenic setting. Edited cells were either plated at low density to form erythroid colonies (erythroid clonal cell population) or cultured in bulk. (B) Editing efficiency of gRNAs evaluated by CRISPR amplicon sequencing in bulk HSPCs from three donors. Data are represented as means ± SEM. (C) Western blot of HSPCs that were treated with gRNAs targeting the SUPT5H gene or an AAVS1 control. H3 serves as a loading control. (D) Western blot quantification of SPT5 knockdown. Signal was normalized against H3 and AAVS1. Data are represented as means ± SEM; n=3 donors, t-test. (E) Ratio of HBB mRNA relative to HBA mRNA for erythroid colonies; n =3 independent experiments for each gRNA, t-test. (F) Average normalized sense-strand NET-seq signal around transcription start site (TSS) for Pol II protein-coding genes comparing AAVS1 control and SUPT5H-edited cells; n=3 donors. (G) Comparison of pausing indices between AAVS1 control and SUPT5H-edited cells reveals significantly higher pausing in SUPT5H-edited cells; n=3 donors, t-test. (H) Schematic of the HBB and HBA loci including the HBB and HBA locus control regions (LCR) (i.e enhancer regions). (I) Cumulative distribution of the pausing indices of Pol II protein-coding genes; p < 0.0001 from a two-sample Kolmogorov-Smirnov test. (J) Enhancer normalized read counts in hypersensitive (HS) sites of the HBB and HBA LCR. The other HS sites do not show significant differences between AAVS1 control and SUPT5H-edited cells (Figure S2H-I); n=3 donors, t-test. P-values: *: p<0.05; **: p<0.01; ***: p<0.001
Figure 3.
Figure 3.. Perturbing SUPT5H delays erythroid gene expression programs.
(A) Heatmap of differentially expressed genes (n= 1,750, adjusted p-value <0.05) from erythroid colonies from three independent experiments on single colonies comparing control and SUPT5H-edited cells. (B) Gene Ontology biological processes for differentially expressed genes (upregulated and downregulated) of erythroid colonies (comparing AAVS1 and SUPT5H-edited cells). The top ten enriched representative processes are shown with their −log10(p.adjust). (C) Number of differentially expressed genes from RNA-seq on bulk edited erythroid culture cells comparing AAVS1 and SUPT5H; days 2, 4, 6, 8, and 10 of erythroid differentiation, colored by increased or decreased expression, n=3 donors, adjusted p-value < 0.05. (D) Volcano plot of erythroid culture cells showing decreased expression for genes including SUPT5H, GATA1, KLF1, and CDK1 in SUPT5H-edited cells on day 4 of erythroid differentiation. Horizontal line falls at adjusted p-value 0.05. (E) Comparison of NET-seq pausing indices in wild-type cells (from time course, Figure 1), categorized by differentially expressed genes (upregulated, n=2892 or downregulated, n=2663) in SUPT5H-edited cells on day 4 of erythroid differentiation. Distributions are significantly different for all days except day 6, t-test, p < 0.01. (F) NET-seq normalized expression z-scores from wild-type cells (from time course, Figure 1), categorized by differentially expressed genes (upregulated or downregulated) in SUPT5H-edited cells on day 4 of erythroid differentiation.
Figure 4.
Figure 4.. Reduced levels of SUPT5H result in a stage-specific delay in erythroid differentiation.
(A) Schematic outline of canonical differentiation markers during ex vivo erythroid differentiation of human HSPCs to terminal differentiation, just prior to enucleation. (B) The maturation of erythroid precursor cells from adult CD34+ HSPCs was assessed with FACS by serially tracing the expression of erythroid lineage markers CD34 and CD36, comparing SUPT5H-edited cells and the AAVS1-edited control cells. Days 2, 4, 6, 8, and 10 of erythroid differentiation in culture; n = 3 donors, showing means ± SEM. (C) Quantification of cell populations transitioning from less mature (CD34+/CD36−) to a more mature cell population (CD34+/CD36+ followed by CD34−/CD36+), comparing SUPT5H-edited cells and the AAVS1-edited control cells; t-test, p < 0.05. (D) Line plot showing the trajectory of erythroid differentiation as cells transition from progenitors to precursors. Trajectory of SUPT5H-edited cells is perturbed relative to AAVS1-edited control cells, especially on days 4 and 5. (E) Representative FACS plot of erythroid terminal differentiation markers CD36 and GPA of SUPT5H-edited cells after 21 days of differentiation. (F) Quantification of acquisition of GPA during erythroid terminal differentiation for SUPT5H-edited cells and the AAVS1-edited control cells. NS: not significant (t-test). (G) Representative FACS plot of erythroid enucleation using Hoescht stain to measure nuclear content; plot shows SUPT5H-edited cells on day 21 of erythroid terminal differentiation. (H) Quantification of enucleation during erythroid terminal differentiation showing no significant difference (t-test) between SUPT5H-edited cells and the AAVS1-edited control cells. Measured on days 16 and 21; data are represented as means ± SEM.
Figure 5.
Figure 5.. Perturbing SUPT5H leads to stage-specific delay in the cell cycle programs.
(A) Representative FACS plot of EdU signal and DNA staining (7AAD) to measure cell cycle populations. Plot shows day 4 of the SUPT5H-edited cells and the AAVS1-edited control cells. FACS plots for all sampled days are shown in Figure S5D. (B) Line plot of the switch in cell cycle programs during ex vivo erythroid differentiation as human erythroid progenitors transition to precursors for SUPT5H-edited and AAVS1-edited cells. Data are from FACS analysis of EdU signal and DNA staining (7AAD) (Figure S5D). (C) Quantification of cell cycle populations during the erythroid progenitor stages in SUPT5H-edited cells relative to AAVS1-edited control cells; t-test. (D) Relative cell proliferation in SUPT5H-edited cells measured by ATP bioluminescence during ex vivo erythroid differentiation going from human erythroid progenitors to terminal differentiation. SUPT5H-edited cell signal relative to AAVS1-edited control cells, days 3 to 11 of erythroid differentiation in culture. Nucleofection of gRNA occurred on day 1 in culture and values are normalized against day 2 (24 hrs post-nucleofection). (E) Representative FACS plot of BrdU and EdU dual labeling to measure cell cycle kinetics. Plot shows day 4 of the SUPT5H-edited cells and AAVS1-edited control cells. (F) Quantification of cell cycle kinetics on day 4 of erythroid differentiation shows a significant decrease in S-phase kinetics in SUPT5H-edited cells compared to the AAVS1-edited control cells; S phase length (Ts) = Ti/(PL/PS), where Ti = EdU labeling time, Ps = EdU+/BrdU+ cell population, and PL = EdU+/BrdU- cell population (Martynoga et al. 2005); data are represented as means ± SEM, t-test. P-values: *: p<0.05; **: p<0.01; ***: p<0.001
Figure 6.
Figure 6.. Transcription inhibitors disrupt globin balance and recapitulate the β-thalassemia phenotype.
(A) Schematic outline showing the stages of transcription that are impacted by different transcription inhibitors. (B) Average sense-strand normalized NET-seq reads around transcription start site (TSS) for expressed Pol II protein-coding genes comparing DMSO control and transcription inhibitors, DRB and triptolide; cells treated on day 8 of erythroid differentiation, n = 2 donors. (C) Comparison of pausing indices between DMSO control and transcription inhibitors, DRB and triptolide; t-test. (D) Cumulative distribution of the pausing indices of Pol II protein-coding genes; p < 0.0001 from a two-sample Kolmogorov-Smirnov test. (E) Ratio of HBB relative to HBA calculated from direct mRNA levels comparing the DMSO control and transcription inhibitor–treated cells; 15-minute treatment, data are represented as the mean, t-test. (F) Schematic of SPT5-Pol II small-molecule inhibitor (SPI) perturbation of Pol II–SPT5 interactions. (G) Comparison of pausing indices between DMSO control and two SPIs (SPI-21 and SPI-18); treated on day 8 of erythroid differentiation, t-test. (H) Volcano plot of SPI-18 treated cells showing decreased HBB expression. Cells were treated on day 8 of erythroid differentiation for 2 hours. Horizontal line falls at adjusted p-value of 0.05. (I) Ratio of HBB relative to HBA calculated from direct mRNA levels comparing the DMSO control and SPI treated cells; 2-hour treatment, data are represented as the mean, t-test. P-values: *: p<0.05; **: p<0.01; ***: p<0.001
Figure 7.
Figure 7.. The multiple roles of SPT5 during erythroid differentiation.
Pol II pausing coordinates the cell cycle and differentiation, promoting efficient cell state transitions during erythropoiesis. Effective erythropoiesis requires robust transcriptional regulation to ensure balanced globin expression during erythroid differentiation.

References

    1. Abdulhay Nour J., Fiorini Claudia, Verboon Jeffrey M., Ludwig Leif S., Ulirsch Jacob C., Zieger Barbara, Lareau Caleb A., et al. 2019. “Impaired Human Hematopoiesis due to a Cryptic Intronic GATA1 Splicing Mutation.” The Journal of Experimental Medicine 216 (5): 1050–60. - PMC - PubMed
    1. Abuhashem Abderhman, Chivu Alexandra G., Zhao Yixin, Rice Edward J., Siepel Adam, Danko Charles G., and Hadjantonakis Anna-Katerina. 2022. “RNA Pol II Pausing Facilitates Phased Pluripotency Transitions by Buffering Transcription.” Genes & Development, August. 10.1101/gad.349565.122. - DOI - PMC - PubMed
    1. Achour Ahlem, Koopmann Tamara T., Castel Rob, Santen Gijs W. E., Hollander den Nicolette, Knijnenburg Jeroen, Ruivenkamp Claudia A. L., et al. 2020. “A New Gene Associated with a Beta-Thalassemia Phenotype: The Observation of Variants in SUPT5H.” Blood, June. 10.1182/blood.2020005934. - DOI - PubMed
    1. Adelman Karen, and Lis John T.. 2012. “Promoter-Proximal Pausing of RNA Polymerase II: Emerging Roles in Metazoans.” Nature Reviews. Genetics 13 (10): 720–31. - PMC - PubMed
    1. Amleh Asma, Nair Sreejith J., Sun Jianlong, Sutherland Ann, Hasty Paul, and Li Rong. 2009. “Mouse Cofactor of BRCA1 (Cobra1) Is Required for Early Embryogenesis.” PloS One 4 (4): e5034. - PMC - PubMed

Publication types