[Preprint]. 2024 Apr 14:2023.03.08.531747.
doi: 10.1101/2023.03.08.531747.

Isogenic hiPSC models of Turner syndrome development reveal shared roles of inactive X and Y in the human cranial neural crest network

Affiliations

Isogenic hiPSC models of Turner syndrome development reveal shared roles of inactive X and Y in the human cranial neural crest network

Darcy T Ahern et al. bioRxiv. .

Update in

Abstract

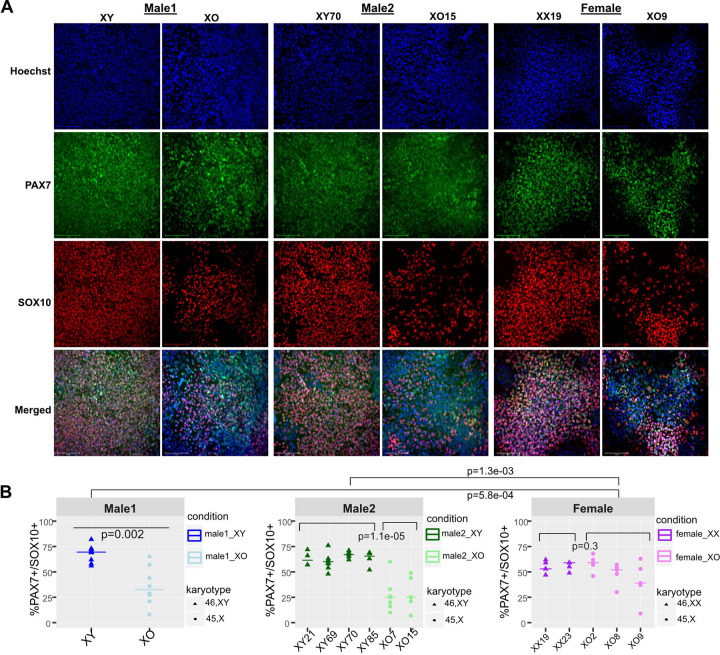
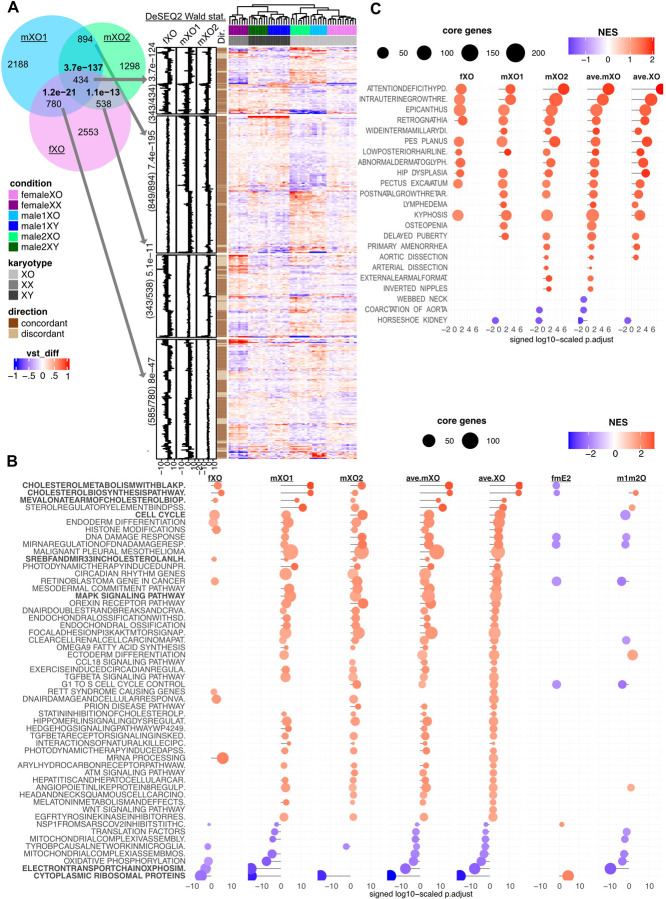
Modeling the developmental etiology of viable human aneuploidy can be challenging in rodents due to syntenic boundaries, or primate-specific biology. In humans, monosomy-X (45,X) causes Turner syndrome (TS), altering craniofacial, skeletal, endocrine, and cardiovascular development, which in contrast remain unaffected in 39,X-mice. To learn how human monosomy-X may impact early embryonic development, we turned to human 45,X and isogenic euploid induced pluripotent stem cells (hiPSCs) from male and female mosaic donors. Because neural crest (NC) derived cell types are hypothesized to underpin craniofacial and cardiovascular changes in TS, we performed a highly-powered differential expression study on hiPSC-derived anterior neural crest cells (NCCs). Across three independent isogenic panels, 45,X NCCs show impaired acquisition of PAX7+SOX10+ markers, and disrupted expression of other NCC-specific genes, relative to their isogenic euploid controls. In particular, 45,X NCCs increase cholesterol biosynthesis genes while reducing transcripts that feature 5' terminal oligopyrimidine (TOP) motifs, including those of ribosomal protein and nuclear-encoded mitochondrial genes. Such metabolic pathways are also over-represented in weighted co-expression gene modules that are preserved in monogenic neurocristopathy. Importantly, these gene modules are also significantly enriched in 28% of all TS-associated terms of the human phenotype ontology. Our analysis identifies specific sex-linked genes that are expressed from two copies in euploid males and females alike and qualify as candidate haploinsufficient drivers of TS phenotypes in NC-derived lineages. This study demonstrates that isogenic hiPSC-derived NCC panels representing monosomy-X can serve as a powerful model of early NC development in TS and inform new hypotheses towards its etiology.


Figures

Figure 1:
Figure 1:. Monosomy-X impact on neural crest differentiation relative to isogenic euploid controls.
(A) Representative immunofluorescence (IF) of PAX7 (green), SOX10 (red) and nuclei (Hoechst33342) in hiPSC-derived pairs of 45,X and euploid control NCCs from Male1/2 and Female donors (100 um scale bar). (B) CellProfiler quantification of 4–7 rounds of differentiation. Brackets and p-value (Mann-Whitney U test) indicate grouped cell lines compared within and across isogenic panels (colored by donor, symbols denoting karyotype).
Figure 2:
Figure 2:. Reduction of neural crest marker expression in monosomy-X relative isogenic euploid controls.
(A) Principal component analysis (PCA) segregates samples by “condition” (donor & karyotype), with % of variance of PC1/2 as indicated. (B) Variance-stabilized counts (vst) of early and late anterior NC (e/lANC), retinoic acid-treated NC (raANC) and neuromesodermal progenitor (NMP) markers from (vertical panels) were median-normalized and averaged over euploid (EU) and 45,X (XO) NCCs of each (horizontal) donor panel (significant differences denoted by Mann-Whitney P-value). (C,D) as in B) for respectively p75−/+ associated markers , and chick NC marker sets . (E) Pearson correlation of the matching PAX7+SOX10+ percentage with averaged marker sets from (B-D), alongside cycling markers , NC markers from a 3D folding human neural tube model , and averaged pseudo-autosomal, X/Y Pair, and other escapee (PAR/PAIR/oESC) expression. Only significant pairwise correlation shown (p≤0.05, Fisher transformed Pearson R).
Figure 3:
Figure 3:. Concordant impact of monosomy-X on NCC transcriptomes across isogenic panels.
(A) Left: Venn diagram of differentially expressed genes (DEGs) in male1, male2 and female (mXO1, mXO2) 45,X NCCs. Significance of pairwise overlapping DEGs in bolded p-values (hypergeometric distribution). Right: Differential vst heatmaps for overlapping DEG sets from (A) as denoted by arrows. Ratio and p-value (sign-test) denote the number of DEGs with concordant direction (“Dir.”) in the triple and all pairwise overlapping DEG sets, also shown in divergent (fXO, mXO1/2) annotation panels showing the Wald statistic (DESeq2) for each gene. Dendrogram segregates samples by karyotype, irrespective of donor. (B) Wikipathway gene set enrichment analysis (GSEA), ordered by the quantile-normalized mean Wald statistic across 45,X conditions (ave.XO). X-axis denotes log-scaled GSEA adjusted p-value. Colored by normalized enrichment score of up- (red) and down-(blue) regulated gene sets (sized by number of genes). Results for all isogenic monosomy-X comparisons (fXO, mXO1/2), averaged (ave.XO/ave.mXO) and control comparisons (fmE1/2: female-male euploids, and m1m2O: male1/2 45,X samples). (C) Human Phenotype Ontology (HPO) GSEA results for significantly (p.adjust≤0.1) enriched terms associated with Turner Syndrome (Orphanet ID: 881), ordered by the quantile-normalized mean (mXO1/2) Wald statistic (ave.mXO, otherwise as in B).
Figure 4:
Figure 4:. Monosomy-X sensitive gene modules correlate in human development and hiPSC-derived NCC models of monogenic neurocristopathy.
(A) Color labels and genes per WGCNA module (1–29) with corresponding: (i) Correlation matrix (Pearson R) of module eigengene to karyotype status (euploid, 45,X) and %PAX7+SOX10+, as well as averaged marker set expression, and sex-linked genes (PAR, X/Y-pair, other escapees, and “All” classes combined). Only for significant correlations (p≤0.05, Fisher transformation) shown, with log-scaled adjusted p-values to the nearest integer. (ii) Significantly-enriched (p.adjust≤0.1, hypergeometric distribution) gene terms from the Hallmark and canonical pathways collections (MSigDB) representing metabolism and development. (iii) Preservation statistics (integer Z-score) in transcriptomes of the developing human face , (Carnegie stages CS13–17 & 22) and heart (CS13–23), alongside hiPSC-derived NCC models of monogenic neurocristopathy syndromes (Pierre-Robin/SOX9 , Waardenburg/SOX10 , Familial Dysautonomia/IKBKAP , Bohring-Opitz/ASXL1 , Floating-Harbor/SRCAP , and Branchio-Oculofacial/TFAP2A ). Monosomy-X human iPSC-derived trophoblast-like cells (TBL ) and pancreatic tumor stroma (Stroma ) as respective positive and negative controls. (iv) Module-averaged Wald statistic. (B) Enrichment map of significantly enriched gene ontology terms (GO, p.adjust≤0.01, hypergeometric distribution) as nodes. Genes shared between nodes (≥10%) depicted, based on semantic pairwise-term similarity (Jaccard distance) to cluster nodes and summarize labels. Nodes colored as pie charts by fraction of enriched modules under that term. (C) Module eigengene correlations (kMÊ2) for each sex-linked gene over its correlation with the PAX7+SOX10+ rate (colored by assigned module, sized by %pHI rank). (D) Dotplot of significantly-enriched (p.adjust ≤0.1, hypergeometric distribution) TS-HPO terms (x-axis, numeric module labels, above gene total). Dot color and size denote log-scaled adjusted p-value and fraction of term-associated genes per module. (E) Modules with significant correlation (R, with regression line and gray 95% C.I.) between genes’ TOPscores (y-axis) and their Pearson coefficient with the PAX7+SOX10+ rate (x-axis), indicated by contour plots. (F) Median TOPscores over median Wald statistic by gene module (colors, size relative to gene total) with standard error bars per module. Pearson R correlation (black line, 95% C.I.) and p-value indicated for each comparison (fXO, mXO1 & mXO2), alongside TOPscores by DEG category (right).

References

    1. Hook E. B. & Warburton D. The distribution of chromosomal genotypes associated with Turner’s syndrome: livebirth prevalence rates and evidence for diminished fetal mortality and severity in genotypes associated with structural X abnormalities or mosaicism. Hum. Genet. 64, 24–7 (1983). - PubMed
    1. Hook E. B. & Warburton D. Turner syndrome revisited: review of new data supports the hypothesis that all viable 45,X cases are cryptic mosaics with a rescue cell line, implying an origin by mitotic loss. Hum. Genet. 133, 417–24 (2014). - PubMed
    1. Bellott D. W., Hughes J. F., Skaletsky H., Brown L. G., Pyntikova T., Cho T.-J., et al. Mammalian Y chromosomes retain widely expressed dosage-sensitive regulators. Nature 508, 494–9 (2014). - PMC - PubMed
    1. Posynick B. J. & Brown C. J. Escape From X-Chromosome Inactivation: An Evolutionary Perspective. Front. Cell Dev. Biol. 7, 241 (2019). - PMC - PubMed
    1. Gravholt C. H., Viuff M. H., Brun S., Stochholm K. & Andersen N. H. Turner syndrome: mechanisms and management. Nat. Rev. Endocrinol. 15, 601–614 (2019). - PubMed

Publication types