Nirmatrelvir treatment of SARS-CoV-2-infected mice blunts antiviral adaptive immune responses
- PMID: 36946379
- PMCID: PMC10165354
- DOI: 10.15252/emmm.202317580
Nirmatrelvir treatment of SARS-CoV-2-infected mice blunts antiviral adaptive immune responses
Abstract
Alongside vaccines, antiviral drugs are becoming an integral part of our response to the SARS-CoV-2 pandemic. Nirmatrelvir-an orally available inhibitor of the 3-chymotrypsin-like cysteine protease-has been shown to reduce the risk of progression to severe COVID-19. However, the impact of nirmatrelvir treatment on the development of SARS-CoV-2-specific adaptive immune responses is unknown. Here, by using mouse models of SARS-CoV-2 infection, we show that nirmatrelvir administration blunts the development of SARS-CoV-2-specific antibody and T cell responses. Accordingly, upon secondary challenge, nirmatrelvir-treated mice recruited significantly fewer memory T and B cells to the infected lungs and mediastinal lymph nodes, respectively. Together, the data highlight a potential negative impact of nirmatrelvir treatment with important implications for clinical management and might help explain the virological and/or symptomatic relapse after treatment completion reported in some individuals.
Keywords: SARS-CoV-2; adaptive immunity; animal models; antiviral treatment; nirmatrelvir.
© 2023 The Authors. Published under the terms of the CC BY 4.0 license.
Conflict of interest statement
MI participates in advisory boards/consultancies for Gilead Sciences, Third Rock Ventures, Antios Therapeutics, Asher Bio, GentiBio, Clexio Biosciences, Sybilla, BlueJay Therapeutics. LGG is a member of the board of directors at Genenta Science and participates in advisory boards/consultancies for Antios Therapeutics, Chroma Medicine, Ananda Immunotherapies, and Gilead Sciences. RDF is a consultant for Moderna and a member of the board of directors of T‐One Therapeutics.
Figures

Synthesis of nirmatrelvir. Reagents and conditions: (i) HBTU, DIPEA, dry CH2Cl2, room temperature (RT), 16 h, 78%; (ii) 1 N aq. LiOH/THF (1:1), RT, 2 h, 100%; (iii) HBTU, DIPEA, dry CH2Cl2/DMF, RT, 3 h, 75%; (iv) 4 N HCl in 1,4‐dioxane/CH2Cl2 (1:1), 0°C to RT, 2 h, 100%; and (v) a: TFAA, dry Py, dry CH2Cl2, 0°C to RT, 2 h; b: TFAA, dry Py, dry CH2Cl2, 0°C to RT, 15 h, 40% over a and b.
Dose‐dependent inhibition of nirmatrelvir (left panel) and GC376 (right panel) on SARS‐CoV‐2 Mpro. Prior to adding the substrate for the biochemical reaction, the protease was preincubated for 30 min at 37°C with the indicated concentrations of the compound.
Dose‐dependent antiviral activity of nirmatrelvir in HEK293T‐hACE2 cells infected with SARS‐CoV‐2 D614G (purple symbols), B.1.617.2 (green symbols), or B.1.1.529 (blue symbols). Antiviral activity was determined as percent inhibition of the virus‐induced cytopathic effect.
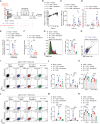
Schematic representation of the experimental setup. Non‐anesthetized K18‐hACE2 transgenic mice were infected with a target dose of 2 × 10⁵ TCID50 of SARS‐CoV‐2 B.1.1.529 through aerosol exposure (see Materials and Methods for details). Infected mice were treated with 150 mg/kg (mpk) of nirmatrelvir (red symbols, n = 4) or vehicle (blue symbols, n = 4) six times by oral gavage (P.O.) starting 4 h post‐infection (p.i.), and every 12 h thereafter. Mock‐treated mice were used as control (black symbols, n = 3). Lung, nasal turbinates, and blood were collected and analyzed 3 days p.i.
Mouse body weight was monitored daily and is expressed as the percentage of weight relative to the initial weight.
Quantification of SARS‐CoV‐2 RNA (left panel) and viral titers (right panel) in the lung 3 days after infection. RNA values are expressed as copy number per ng of total RNA and the limit of detection is indicated as a dotted line. Viral titers were determined by median tissue culture infectious dose (TCID50).
Quantification of SARS‐CoV‐2 RNA in the nasal turbinates 3 days after infection. RNA values are expressed as copy number per ng of total RNA and the limit of detection is indicated as a dotted line.

- A
Schematic representation of the experimental setup. Non‐anesthetized K18‐hACE2 mice were exposed to a target dose of 2 × 10⁵ TCID50 of aerosolized SARS‐CoV‐2 B.1.1.529 (see Materials and Methods for details). Infected mice were treated with 150 mpk of nirmatrelvir (red symbols, n = 5) or vehicle (blue symbols, n = 6) for six times by oral gavage (P.O.) starting 4 h p.i., and every 12 h thereafter. Twenty‐four days after infection, mice were re‐challenged with a target dose of 1 × 10⁶ TCID50 of SARS‐CoV‐2 B.1.1.529 through aerosol exposure. Mock‐treated mice were used as non‐infected controls (black symbols, n = 3). A group of naïve mice challenged with 1 × 10⁶ TCID50 of SARS‐CoV‐2 B.1.1.529 served as additional controls (green symbols, n = 5). Blood was collected 7, 14, and 21 days after the first infection and 4 days post‐re‐challenge. Lung, nasal turbinates, and lung‐draining mediastinal lymph nodes (mLN) were collected and analyzed 4 days post‐re‐challenge.
- B
Mouse body weight was monitored daily and is expressed as percentage of weight relative to the initial weight.
- C–F
Quantification of anti‐S1 RBD IgG levels by ELISA in the plasma of the indicated mice (C) 7, 14, and 21 days p.i. or (E) 4 days post‐re‐challenge. Neutralization dose 50 (ND50) against SARS‐CoV‐2 B.1.1.529 pseudovirus in the plasma of the indicated mice (D) 7, 14, and 21 days p.i. or (F) 4 days post‐re‐challenge.
- G
Flow cytometry histogram (left panel) and percentage (right panel) of B cells stained positive for CD95 in the mLN of the indicated mice 4 days post‐re‐challenge (pre‐gated on live+/CD4−/ CD8−/ B220+/CD19+ cells).
- H
Flow cytometry plot of RBD‐specific B cells detected by two fluorescently labeled streptavidin‐based RBD‐biotinylated tetramers in the mLN of one vehicle‐treated mouse 4 days post‐re‐challenge (pre‐gated on live+/CD4−/ CD8−/ B220+/CD19+ cells).
- I–N
Representative flow cytometry plots of (I) CD8+ T cells or (L) CD4+ T cells expressing IFN‐γ and TNF‐α in the lungs of the indicated mice 4 days post‐re‐challenge. Unstimulated cells are shown in the upper panels, whereas cells re‐stimulated with a pool of SARS‐CoV‐2 peptides for 4 h at 37°C are shown in the bottom panels. Plots were pre‐gated as (I) live+/B220−/CD19−/CD4−/CD8+ cells or (L) live+/B220−/CD19−/CD8−/CD4+. Frequency (J, M) and absolute number (K, N) of IFN‐γ‐ and TNF‐α‐producing CD8+ T cells (J, K) or CD4+ T cells (M, N) in the lung of the indicated mice 4 days post‐re‐challenge.

- A
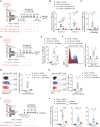
Schematic representation of the experimental setup. Non‐anesthetized K18‐hACE2 mice were exposed to a target dose of 2 × 10⁵ TCID50 of aerosolized SARS‐CoV‐2 B.1.1.529. Infected mice were treated with 150 mpk of nirmatrelvir (red symbols) or vehicle (blue symbols, n = 4) six times by oral gavage (P.O.) starting 24 h p.i. (full‐red symbols, n = 5) or 48 h p.i. (empty‐red symbols, n = 5), and every 12 h thereafter. Thirty‐eight days after infection, mice were re‐challenged with a target dose of 1 × 10⁶ TCID50 of SARS‐CoV‐2 BA.5 through aerosol exposure. Mock‐treated mice were used as non‐infected controls (black symbols, n = 3).
- B, C
Quantification of anti‐S1 RBD IgG levels by ELISA in the plasma of the indicated mice (B) 14 and 21 days p.i. and (C) 4 days post‐re‐challenge.
- D
Schematic representation of the experimental setup. Non‐anesthetized K18‐hACE2 mice were exposed to a target dose of 2 × 10⁵ TCID50 of aerosolized SARS‐CoV‐2 B.1.617.2. Infected mice were treated with 150 mpk of nirmatrelvir (red symbols, n = 3) or vehicle (blue symbols, n = 4) for six times by oral gavage (P.O.) starting 24 h p.i., and every 12 h thereafter. Mock‐treated mice were used as non‐infected controls (black symbols, n = 2).
- E
Quantification of anti‐S1 RBD IgG levels by ELISA in the plasma of the indicated mice 7 days p.i.
- F
Flow cytometry histogram (left panel) and geometric mean fluorescent intensity (gMFI) quantification (right panel) of CD44 expression by CD8+ T cells in the blood of the indicated mice 7 days p.i. (pre‐gated on live+/ B220−/ CD19−/ CD4−/ CD8+ cells).
- G, H
Frequency of (G) granzyme‐B‐ and (H) IFN‐γ‐producing CD8+ T cells in the blood of the indicated mice 7 days p.i. Cells were stimulated in vitro with a pool of SARS‐CoV‐2 peptides for 4 h at 37°C. Plots were pre‐gated as above.
- I
Schematic representation of the experimental setup. Non‐anesthetized C57BL/6 mice were exposed to a target dose of 1 × 10⁵ TCID50 of aerosolized rSARS‐N501YMA30. Infected mice were treated with 150 mpk of nirmatrelvir (red symbols, n = 4) or vehicle (blue symbols, n = 4) six times by oral gavage (P.O.) starting 24 h p.i., and every 12 h thereafter. Mock‐treated mice were used as non‐infected controls (black symbols, n = 3).
- J
Quantification of anti‐S1 RBD IgG levels by ELISA in the plasma of the indicated mice 7, 14, and 21 days p.i.
References
-
- Badovinac VP, Porter BB, Harty JT (2004) CD8+ T cell contraction is controlled by early inflammation. Nat Immunol 5: 809–817 - PubMed
Publication types
MeSH terms
Substances
Grants and funding
LinkOut - more resources
Full Text Sources
Molecular Biology Databases
Miscellaneous

