

ASO targeting RBM3 temperature-controlled poison exon splicing prevents neurodegeneration in vivo
- PMID: 36946385
- PMCID: PMC10165353
- DOI: 10.15252/emmm.202217157
ASO targeting RBM3 temperature-controlled poison exon splicing prevents neurodegeneration in vivo
Abstract
Neurodegenerative diseases are increasingly prevalent in the aging population, yet no disease-modifying treatments are currently available. Increasing the expression of the cold-shock protein RBM3 through therapeutic hypothermia is remarkably neuroprotective. However, systemic cooling poses a health risk, strongly limiting its clinical application. Selective upregulation of RBM3 at normothermia thus holds immense therapeutic potential. Here we identify a poison exon within the RBM3 gene that is solely responsible for its cold-induced expression. Genetic removal or antisense oligonucleotide (ASO)-mediated manipulation of this exon yields high RBM3 levels independent of cooling. Notably, a single administration of ASO to exclude the poison exon, using FDA-approved chemistry, results in long-lasting increased RBM3 expression in mouse brains. In prion-diseased mice, this treatment leads to remarkable neuroprotection, with prevention of neuronal loss and spongiosis despite high levels of disease-associated prion protein. Our promising results in mice support the possibility that RBM3-inducing ASOs might also deliver neuroprotection in humans in conditions ranging from acute brain injury to Alzheimer's disease.
Keywords: RBM3; alternative splicing coupled to nonsense-mediated decay; hypothermia; neurodegenerative diseases; neuroprotection.
© 2023 The Authors. Published under the terms of the CC BY 4.0 license.
Conflict of interest statement
A patent application has been filed in relation to this research. There are no other competing interests.
Figures
- A
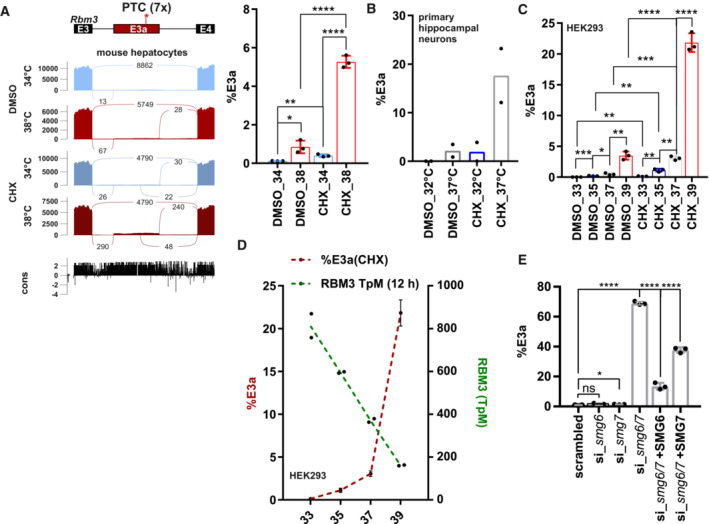
Sashimi blot identifies an uncharacterized exon (E3a; with 7 premature termination codons: PTC) within Rbm3 intron 3. Mouse primary hepatocytes were incubated at 34 or 38°C with or without the translation inhibitor cycloheximide (CHX, DMSO as solvent control) and analyzed by RNA sequencing. Below the simplified exon‐intron structure, the Sashimi plot shows the distribution of raw sequencing reads. Exon–Exon junction reads are indicated by the numbers connecting the exons. At the bottom, high sequence conservation across placental species is indicated. Quantification of %E3a inclusion in RNA sequencing samples is shown on the right (mean ± s.d., n = 3, all individual data points are shown) (Neumann et al, 2020).
- B
Quantification of radioactive splicing‐sensitive RT–PCRs confirm heat‐induced and CHX‐stabilized formation of the E3a‐containing isoform at warmer temperatures in primary hippocampal neurons (mean ± s.d., n = 2, all individual data points are shown).
- C
RBM3 E3a regulation is conserved in humans. HEK293 cells were incubated at the indicated temperatures for 12 h (DMSO/CHX last 4 h) and investigated for E3a inclusion as in B (mean ± s.d., n = 3, all individual data points are shown). For a representative gel image, see also Fig EV1A.
- D
Gene expression of RBM3 anti‐correlates with inclusion of E3a. Transcripts per million (TpM) values for RBM3 are derived from RNA sequencing data from HEK293 cells incubated for the indicated time points for 12 h and are plotted on the right y‐axis (green, n = 2, mean ± s.d.). Inclusion levels for E3a are derived from C.
- E
RBM3 E3a stabilization in response to SMG6 and SMG7 knockdown and rescue (mean ± s.d., n = 3, for scrambled n = 6, all individual data points are shown) (Colombo et al, 2017). In all panels, statistical significance was determined by unpaired, two‐sided t‐test and is indicated by asterisks: P‐values: *P < 0.05, **P < 0.01, ***P < 0.001, ****P < 0.0001.
- A
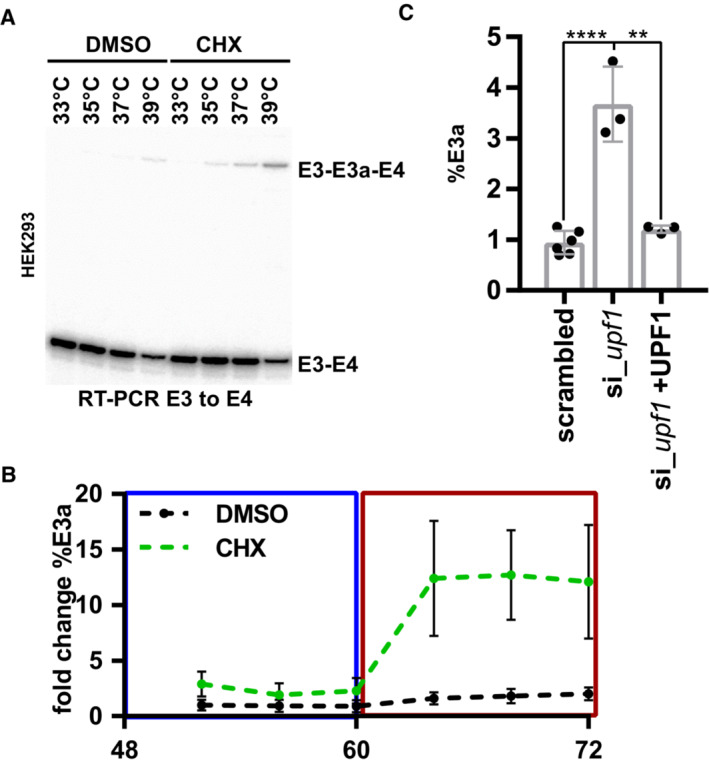
Representative gel image showing heat‐induced and CHX‐stabilized formation of the E3a isoform in human HEK293 cells (quantification in Fig 1C).
- B
Rhythmic RBM3 E3a regulation. HEK293 cells were pre‐entrained with square‐wave temperature cycles (12 h 34°C/12 h 38°C) for 48 h. For the last 24 h, cells were treated with DMSO or CHX every 4 h and harvested after 4 h and analyzed by splicing‐sensitive RT–PCR (n = 6, mean ± s.d.).
- C
RBM3 E3a stabilization in response to UPF1 knockdown and rescue (mean ± s.d., n = 3, for scrambled n = 6, all individual data points are shown) (Colombo et al, 2017). Statistical significance was determined by unpaired t‐test and is indicated by asterisks: P‐values: **P < 0.01, ****P < 0.0001.
- A
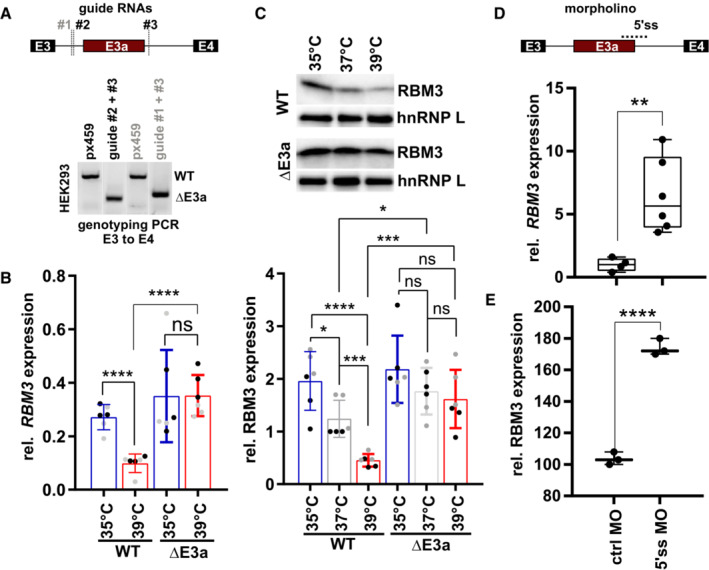
CRISPR/CAS9‐mediated removal of RBM3 E3a. One of two guide RNAs targeting the upstream intron (#1, #2) was co‐transfected with a guide RNA targeting the downstream intron (#3). Below, genotyping PCR after clonal selection with px459 transfected cells serving as a negative control. See also Fig EV2A.
- B, C
RT–qPCR (B) and Western blot (C) analysis of RBM3 levels in edited cell lines. Clonal cell lines from A were incubated at the indicated temperatures for 24 h. In (B), isolated RNA was investigated by qPCR, and RBM3 expression is shown relative to GAPDH levels. In (C), lysates from an independent experiment were investigated for RBM3 protein expression, hnRNP L served as a loading control, a representative gel (top) and quantification (bottom) are shown (mean ± s.d., n = 6 [n = 3 per clone, indicated in black/gray], all individual data points are shown). See Fig EV2B for all gels.
- D, E
Manipulation of RBM3 E3a splicing directly controls RBM3 expression levels. In (D), HEK293 cells were transfected for 48 h at 37°C with a MO blocking the 5'ss of E3a. RBM3 expression is shown relative to GAPDH levels and normalized to a non‐targeting MO (n = 4–6, line indicates median, whiskers min to max, all individual data points are shown). In (E), primary hippocampal neurons were transfected with the indicated MOs for 48 h and investigated for RBM3 by Western blotting. GAPDH served as a loading control (n = 3; line indicates median, whiskers min to max, all individual data points are shown). Gel images in Fig EV2D. In all panels, statistical significance was determined by unpaired, two‐sided t‐test and is indicated by asterisks: P‐values: *P < 0.05, **P < 0.01, ***P < 0.001, ****P < 0.0001.
- A
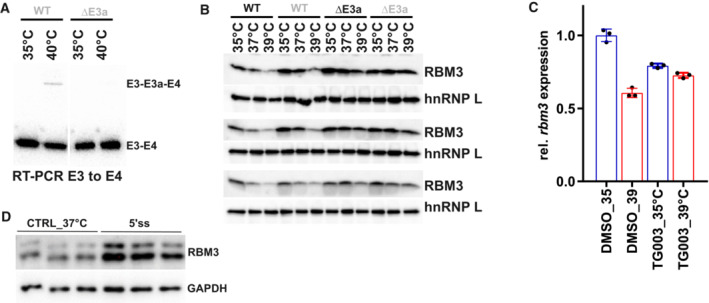
An RT–PCR in CHX‐treated HEK293 cells confirms CRISPR/CAS9‐mediated removal of E3a in a DE3a clone at the RNA level.
- B
Western blot analysis of RBM3 protein expression, hnRNP L served as a loading control. Two independent WT and ΔE3a clones are shown in biological triplicates. Quantification in Fig 2C.
- C
Inhibition of CLK1/4 kinase by TG003 abolishes the effect of temperature on rbm3 expression. Whippet‐derived TpM values are shown relative to DMSO 35°C (mean ± s.d., n = 3, all individual data points are shown). This reveals an almost twofold difference in rbm3 levels comparing 6 h DMSO 35 vs. 39°C. Note that this is basically abolished by adding TG003 during the shift from 39 to 35°C (Haltenhof et al, 2020).
- D
Blocking rbm3 E3a inclusion induces RBM3 protein levels. Primary hippocampal neurons were transfected with the indicated MOs for 48 h and investigated by Western blotting. GAPDH served as a loading control. Quantification in Fig 2E.
- A, B
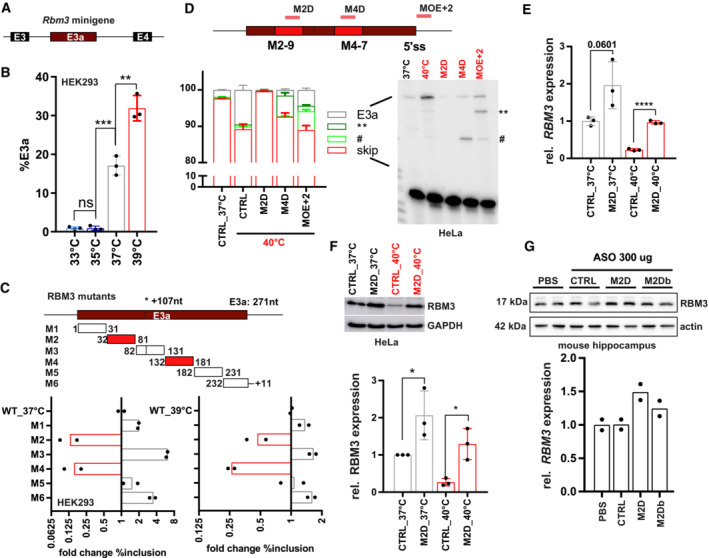
An Rbm3 minigene reproduces temperature‐controlled E3a inclusion. In (A), the minigene structure containing the whole unshorten sequence from E3 to E4 (including upstream 3'ss and downstream 5'ss) is shown. In (B), minigenes from mouse were transfected into HEK293 and incubated at the indicated temperatures for 12 h. E3a inclusion was investigated by splicing‐sensitive PCR and quantified, %E3a is shown (mean ± s.d., n = 3, all individual data points are shown).
- C
Systematic mutational screening for regulatory elements. Mutations resulting in exon skipping are highlighted in red. Below, analysis of fold change in %E3a in HEK293 at 37 and 39°C (mean, n = 2, all individual data points are shown). Position 107 marks an alternative 3'ss in E3a. See also Fig EV3B and Table EV1.
- D
ASOs targeting M2‐9, M4‐7, or the 5'ss (see Fig EV4A and Table EV2) prevent endogenous RBM3 E3a inclusion in human HeLa cells. ASO‐transfected cells were kept for 24 h at 40°C. Control samples at 37 and 40°C are shown; CHX was added for the last 4 h. Exon 3a inclusion was investigated by splicing‐sensitive RT–PCR, a representative gel and phosphorimager quantification are shown (mean ± s.d., n = 3). The hashtag marks the use of internal 5′ and 3'ss that is promoted by all ASOs targeting the M4 region. ASOs targeting the 5'ss induced the usage of an internal 5'ss (marked by two asterisks).
- E, F
M2D induces RBM3 mRNA (E) and protein (F) expression in human HeLa cells. ASOs were transfected for 24 h at 37°C (gray) or at 40°C (red). RBM3 induction was measured relative to GAPDH expression (mean ± s.d., n = 3, all individual data points are shown).
- G
M2D induces RBM3 protein expression in vivo. Hippocampus samples from two mice per condition were analyzed by Western blotting (left), and RBM3 protein was quantified relative to actin and PBS (right, mean ± s.d., n = 2, all individual data points are shown). In all panels, statistical significance was determined by unpaired, two‐sided t‐test and is indicated by asterisks: P‐values: *P < 0.05, **P < 0.01, ***P < 0.001, ****P < 0.0001.
- A
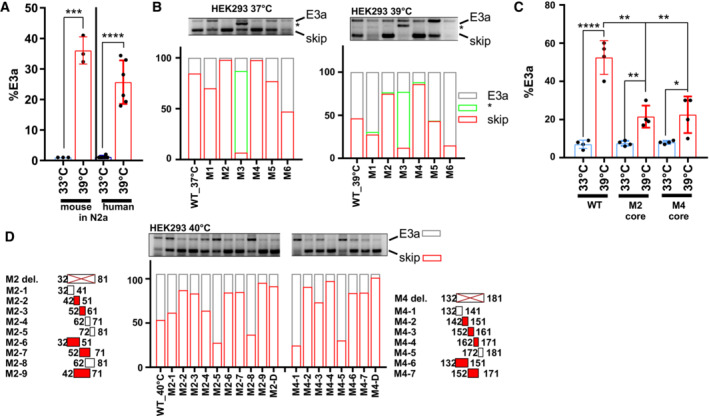
An RBM3 minigene reproduces temperature‐controlled E3a inclusion. Human and mouse minigenes were transfected into N2a cells and analyzed as in Fig 3A (mean ± s.d., n = 3–6, all individual data points are shown).
- B
Systematic mutational screening for regulatory elements (see Table EV1). The indicated sequences were replaced by sequences from human beta‐globin. M2, M4, and M5 contain the same exon 2 sequence from beta‐globin exon 2. Only in the M2 and M4 context these sequences prevent inclusion, ruling out the possibility that we included a silencer element. M1 and M3 contain sequences of the beta‐globin 3'ss, M6 the beta‐globin 5'ss (these mutations do not result in an increased splice site strength). E3a inclusion in HEK293 at 37 and 39°C was investigated by minigene‐specific RT–PCR. On top, a representative gel is shown. Below, quantifications of the detected isoforms (mean, n = 2). Note that replacing the internal 3'ss with a globin 3'ss promotes its usage.
- C
Temperature response of the indicated minigenes. We deleted the evolutionary conserved core of the M2 and M4 regions. Briefly, M2‐2 and M2‐3 are 100% conserved between human and mouse. Thus, M2‐2 and M2‐3 are regarded as core sequence of the M2 enhancer to be deleted in hRBM3 minigene. For the M4 region, M4‐3 is the central region of the conserved sequence. Therefore, M4‐3 and a part of the upstream sequence of M4‐4 were deleted as core sequence of M4 mutant in the hRBM3 minigene (mean ± s.d., n = 4, all individual data points are shown).
- D
Detailed mutational screening of the M2 region (borders indicated on the left) and M4 region (borders indicated on the right). See Table EV1 for sequences. In M2 or M4 del. The M2 or M4 sequences are removed (and not replaced). In M2‐1 to M2‐9 and M4‐1 to M4‐7, the indicated sequences are replaced by human beta‐globin exon 2 sequences from the same relative position. On top, a representative PCR image is shown. Below, quantifications of the detected isoforms (mean, n = 2). In all panels, statistical significance was determined by unpaired, two‐sided t‐test and is indicated by asterisks: P‐values: *P < 0.05, **P < 0.01, ***P < 0.001, ****P < 0.0001.
- A
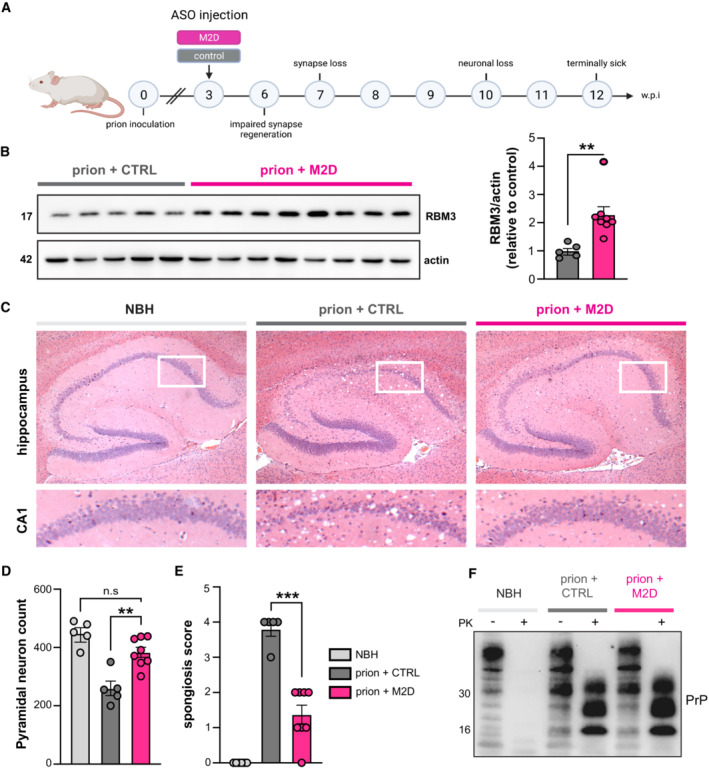
Schematic of experimental design. Prion‐inoculated tg37+/− mice were injected with 200 μg of either M2D or a non‐targeting control ASO at 3 w.p.i.
- B
Western blot of hippocampal lysates from prion‐infected mice treated with non‐targeting control ASO (n = 5 mice) or M2D (n = 8 mice). M2D increases RBM3 expression by twofold compared to control ASO‐treated mice, 9 weeks after ASO injection at 12 w.p.i. **P = 0.0058, calculated using Student's t‐test.
- C
Representative images of hematoxylin and eosin‐stained brain slices from NBH (control), and prion‐infected control ASO‐ and M2D‐treated mice at 12 w.p.i. when control ASO‐treated mice were culled for prion signs. M2D confers marked neuroprotection in the hippocampus, with conservation of CA1‐3 pyramidal layer, protection from shrinkage of the whole hippocampus, as well as reduced spongiform change.
- D
NeuN counts of pyramidal neurons in NBH (n = 5 mice) versus control ASO‐treated (n = 5 mice) and M2D‐treated prion mice (n = 8 mice). M2D confers neuroprotection close to levels seen in NBH mice. control ASO‐treated versus M2D‐treated prion mice **P = 0.0014. One‐way ANOVA.
- E
Semi‐quantitative scoring of spongiosis in NBH, control ASO‐treated and M2D‐treated mice. Sections showing no signs of spongiosis were scored 0, severe spongiosis was scored 4, as described (White et al, 2008). M2D (n = 8 mice) significantly reduced spongiosis compared to control ASO‐treated prion mice (n = 5 mice), which is absent in uninfected NBH mice (n = 5 mice) ***P = 0.0001, one‐way ANOVA.
- F
Total PrP and proteinase K‐resistant PrPSc levels in NBH‐injected mice and in prion‐diseased mice injected with control—or M2D ASOs. PrPSc levels are unaffected by M2D‐mediated RBM3 induction.
- A–C
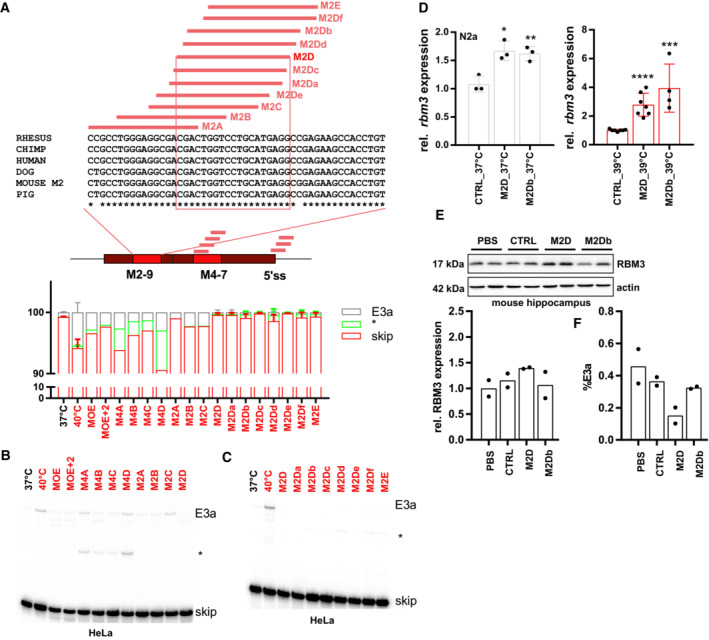
ASOs targeting M2‐9, M4‐7, or the 5'ss (see Table EV2) prevent RBM3 E3a inclusion in human HeLa cells. In (A), ASO‐binding sites within the M2, M4, and the 5'ss region are indicated in the middle. On top, for the mouse M2 region an alignment of mouse, human, chimp, rhesus, dog, and pig sequences is shown. ASO‐binding sites are indicated, and the 100% conserved binding site of M2D is boxed. ASOs were transfected and cells were kept at 40°C for 24 h. Control samples at 37 and 40°C are shown. All samples were treated with CHX for the last 4 h. Exon 3a inclusion was investigated by splicing‐sensitive radioactive RT–PCR. In (A) (bottom), a quantification is shown (mean ± s.d., n = 2; n = 5 for all M2D variants and M2E, n = 1 for M4B). In (B) and (C) representative gels are shown. The asterisk marks the use of internal 5′ and 3'ss that is promoted by all ASOs targeting the M4 region. Note that all variants targeting the M2D region almost quantitatively prevent E3a inclusion and, at 40°C, lead to inclusion levels that are lower than the one observed at 37°C for control cells.
- D
M2D and M2Db induce rbm3 mRNA expression in mouse N2a cells. ASOs were transfected for 24 h at 37°C (left) or at 39°C (right). rbm3 induction was measured relative to a CTRL ASO and relative to HPRT expression (mean ± s.d., n ≥ 3, all individual data points are shown; unpaired t‐test derived P‐value *P < 0.5, **P < 0.01, ***P < 0.001, ****P < 0.0001).
- E
M2D, but not M2Db, induces RBM3 protein expression in vivo (100 μg dose per mouse). Hippocampus samples from two independent mice per condition were analyzed by Western blotting (top), and RBM3 signal was quantified relative to Actin and PBS (bottom, mean ± s.d., n = 2).
- F
M2D, but not M2Db, reduces E3a inclusion in vivo (300 μg dose per mouse). Cerebellum RNA samples from two independent mice per condition were analyzed by splicing‐sensitive RT–PCR, and %E3a signal was quantified (mean ± s.d., n = 2).
References
-
- Ávila‐Gómez P, Pérez‐Mato M, Hervella P, Dopico‐López A, Silva‐Candal AD, Bugallo‐Casal A, López‐Amoedo S, Candamo‐Lourido M, Sobrino T, Iglesias‐Rey R et al (2022) Associations between RNA‐binding motif protein 3, fibroblast growth factor 21, and clinical outcome in patients with stroke. J Clin Med 11: 949 - PMC - PubMed
-
- Azzopardi D, Strohm B, Marlow N, Brocklehurst P, Deierl A, Eddama O, Goodwin J, Halliday HL, Juszczak E, Kapellou O et al (2014) Effects of hypothermia for perinatal asphyxia on childhood outcomes. N Engl J Med 371: 140–149 - PubMed
-
- Beaudoin GM 3rd, Lee SH, Singh D, Yuan Y, Ng YG, Reichardt LF, Arikkath J (2012) Culturing pyramidal neurons from the early postnatal mouse hippocampus and cortex. Nat Protoc 7: 1741–1754 - PubMed
Publication types
MeSH terms
Substances
Grants and funding
LinkOut - more resources
Full Text Sources
