. 2023 Mar 22;49(Suppl_2):S93-S103.
doi: 10.1093/schbul/sbac145.

Latent Factors of Language Disturbance and Relationships to Quantitative Speech Features

Affiliations

Latent Factors of Language Disturbance and Relationships to Quantitative Speech Features

Sunny X Tang et al. Schizophr Bull. .

Erratum in

Abstract

Background and hypothesis: Quantitative acoustic and textual measures derived from speech ("speech features") may provide valuable biomarkers for psychiatric disorders, particularly schizophrenia spectrum disorders (SSD). We sought to identify cross-diagnostic latent factors for speech disturbance with relevance for SSD and computational modeling.

Study design: Clinical ratings for speech disturbance were generated across 14 items for a cross-diagnostic sample (N = 334), including SSD (n = 90). Speech features were quantified using an automated pipeline for brief recorded samples of free speech. Factor models for the clinical ratings were generated using exploratory factor analysis, then tested with confirmatory factor analysis in the cross-diagnostic and SSD groups. The relationships between factor scores and computational speech features were examined for 202 of the participants.

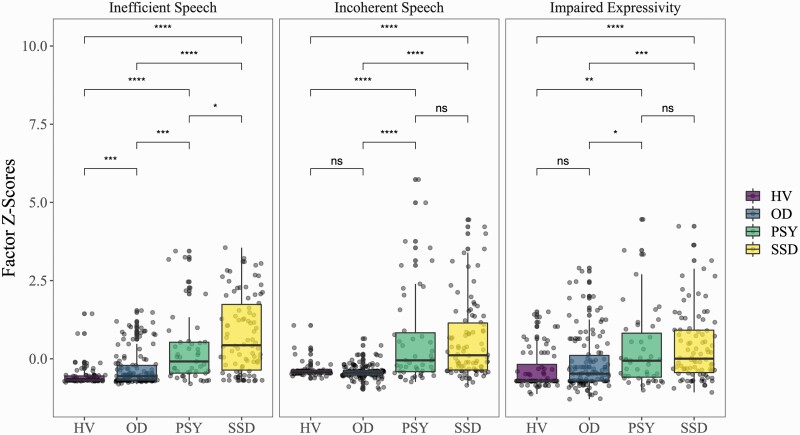
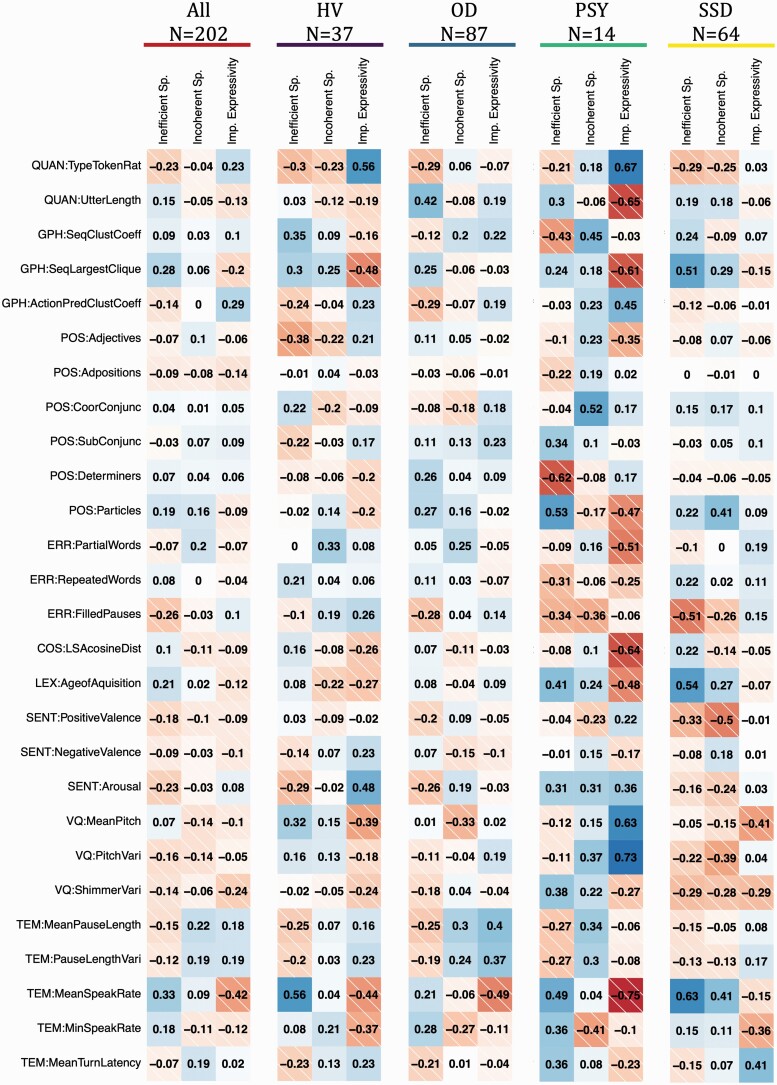
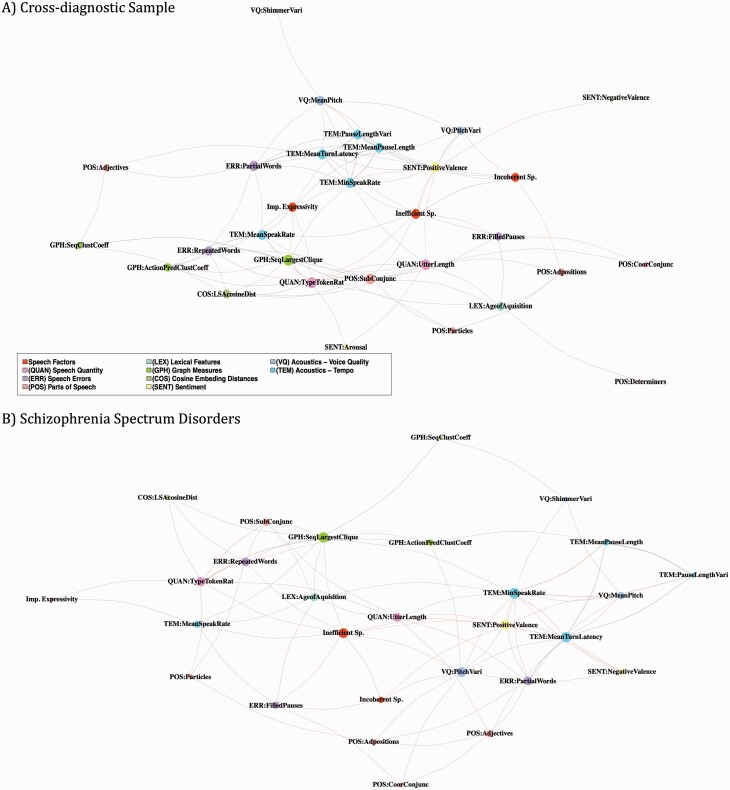
Study results: We found a 3-factor model with a good fit in the cross-diagnostic group and an acceptable fit for the SSD subsample. The model identifies an impaired expressivity factor and 2 interrelated disorganized factors for inefficient and incoherent speech. Incoherent speech was specific to psychosis groups, while inefficient speech and impaired expressivity showed intermediate effects in people with nonpsychotic disorders. Each of the 3 factors had significant and distinct relationships with speech features, which differed for the cross-diagnostic vs SSD groups.

Conclusions: We report a cross-diagnostic 3-factor model for speech disturbance which is supported by good statistical measures, intuitive, applicable to SSD, and relatable to linguistic theories. It provides a valuable framework for understanding speech disturbance and appropriate targets for modeling with quantitative speech features.

Keywords: alogia; disorganization; graph analysis; natural language processing; psychosis; schizophrenia; thought disorder.


Conflict of interest statement

SXT is a consultant for Neurocrine Biosciences and North Shore Therapeutics, received funding from Winterlight Labs, and holds equity in North Shore Therapeutics. The other authors have no conflicts of interest.

Figures

Fig. 1.
Fig. 1.
Group Differences In Factor Scores: Pair-wise comparisons made using t-tests. Significance levels shown on the graph are uncorrected values. Results are largely consistent after correcting for multiple comparisons with the FDR method, the pair-wise P values are as follows. Inefficient speech: HV*OD = 0.05; PSY*SSD = 0.003; all others P < .001. Incoherent speech: HV*OD & PSY*SSD NS; all others P < .001. Impaired Expressivity: HV*OD & PSY*SSD NS; HV*OD, HV*SSD, and OD*SSD P < .001; OD*PSY = 0.01. NS, Not significant; * P < .05; ** P < .01; ***P <.001. HV, healthy volunteers; OD, other psychiatric disorders; PSY, other or undetermined psychotic disorders; SSD, schizophrenia spectrum disorders.
Fig. 2.
Fig. 2.
Spearman Correlations between Factor Scores and Computed Speech Features. HV, healthy volunteers; OD, other psychiatric disorders; PSY, other or undetermined psychotic disorders; SSD, schizophrenia spectrum disorders. See supplementary table 3 for descriptions of the speech features.
Fig. 3.
Fig. 3.
Network of Factor Scores and Computed Speech Features: Nodes represent factor scores, acoustics, and lexical features; size is proportional to the degree of the node. Edges represent Spearman correlation coefficients with cutoff of ρ = 0.2 and P = .05; weight is proportional to absolute value. A) Cross-diagnostic sample (n = 202). Density = 0.21. Degree (D) of each speech factor: Inefficient Speech = 8, Incoherent Speech = 6, Impaired Expressivity = 7. Betweenness centrality (BC) of each speech factor: Inefficient Speech = 25.3, Incoherent Speech = 13.0, Impaired Expressivity = 18.3. Speech features with the highest connectedness: type-token ratio (D = 11, BC = 31.8), largest clique in sequential graph (D = 11, BC = 42.0), positive sentiment (D = 11, BC = 49.6), mean sentence length (D = 10, BC = 63.8). B) Schizophrenia Spectrum Disorders (n=64). Density = 0.18. Degree of each speech factor: Inefficient Speech = 9, Incoherent Speech = 4, Impaired Expressivity = 2. Betweenness centrality of each speech factor: Inefficient Speech = 47.9, Incoherent Speech = 2.4, Impaired Expressivity = 0.37. Speech features with the highest connectedness: minimum speaking rate (D=11, BC=50.1), largest clique in sequential graph (D=10, BC=54.4), positive sentiment (D = 10, BC = 33.4), mean turn latency (D = 10, BC = 29.1), pitch range (D = 9, BC = 35.5).

References

    1. Corcoran CM, Mittal VA, Bearden CE, et al. . Language as a biomarker for psychosis: a natural language processing approach. Schizophr Res. 2020;226:158–166. doi: 10.1016/j.schres.2020.04.032. - DOI - PMC - PubMed
    1. Kircher T, Bröhl H, Meier F, Engelen J. Formal thought disorders: from phenomenology to neurobiology. Lancet Psychiatry. 2018;5(6):515–526. doi: 10.1016/S2215-0366(18)30059-2. - DOI - PubMed
    1. de Boer JN, Brederoo SG, Voppel AE, Sommer IEC. Anomalies in language as a biomarker for schizophrenia. Curr Opin Psychiatry. 2020;33(3):212–218. doi: 10.1097/YCO.0000000000000595. - DOI - PubMed
    1. Ratana R, Sharifzadeh H, Krishnan J, Pang S. A comprehensive review of computational methods for automatic prediction of schizophrenia with insight into indigenous populations. Front Psychiatry. 2019;10(September):1–15. doi: 10.3389/fpsyt.2019.00659. - DOI - PMC - PubMed
    1. Voppel A, de Boer J, Brederoo S, Schnack H, Sommer I. Quantified language connectedness in schizophrenia-spectrum disorders. Psychiatry Res. 2021;304:114130. doi: 10.1016/j.psychres.2021.114130. - DOI - PubMed

Publication types