. 2023 Mar 22;49(Suppl_2):S142-S152.
doi: 10.1093/schbul/sbac056.

Semantic Speech Networks Linked to Formal Thought Disorder in Early Psychosis

Affiliations

Semantic Speech Networks Linked to Formal Thought Disorder in Early Psychosis

Caroline R Nettekoven et al. Schizophr Bull. .

Abstract

Background and hypothesis: Mapping a patient's speech as a network has proved to be a useful way of understanding formal thought disorder in psychosis. However, to date, graph theory tools have not explicitly modelled the semantic content of speech, which is altered in psychosis.

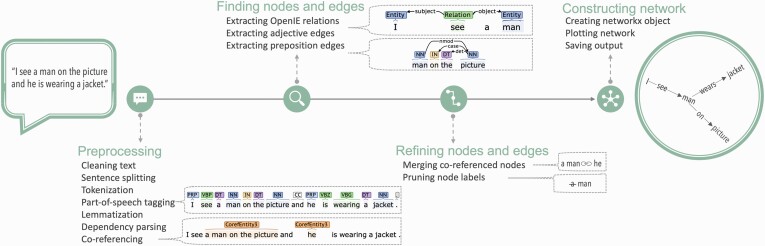
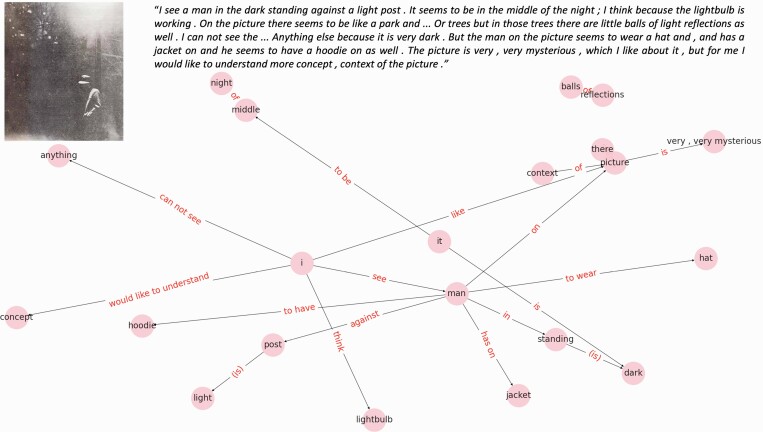
Study design: We developed an algorithm, "netts," to map the semantic content of speech as a network, then applied netts to construct semantic speech networks for a general population sample (N = 436), and a clinical sample comprising patients with first episode psychosis (FEP), people at clinical high risk of psychosis (CHR-P), and healthy controls (total N = 53).

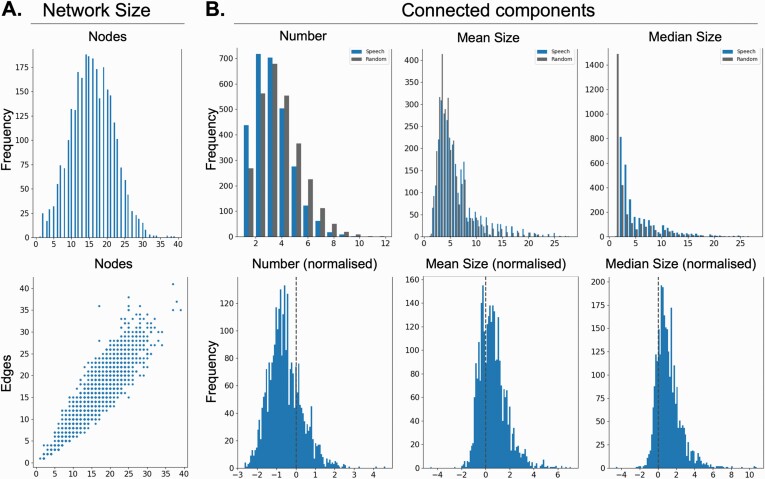
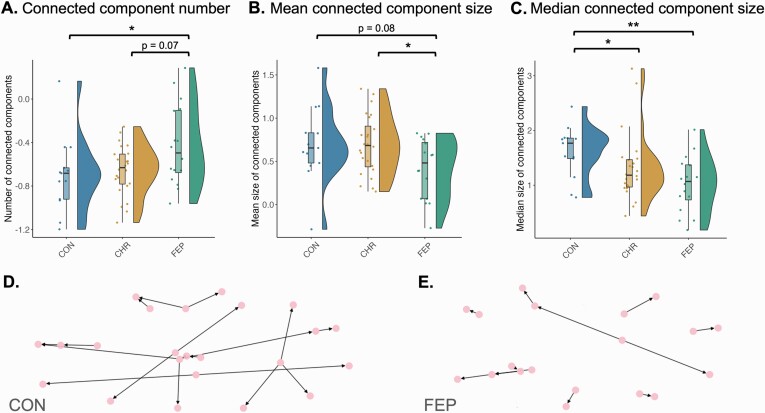
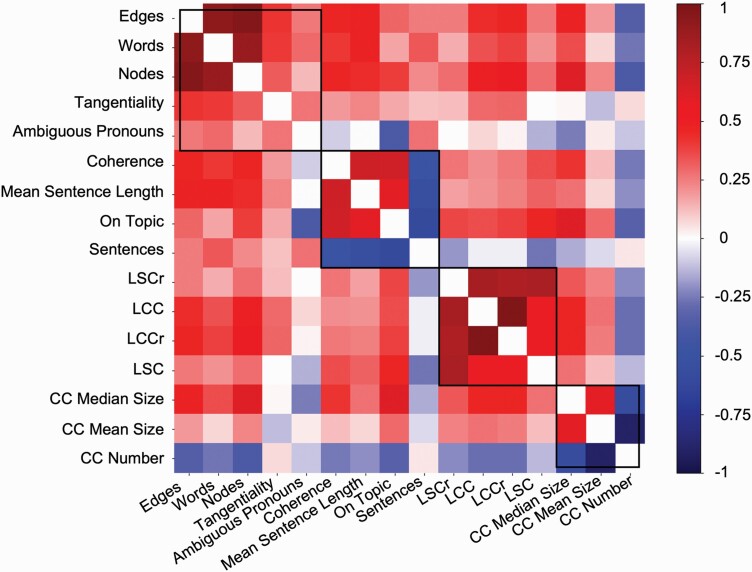
Study results: Semantic speech networks from the general population were more connected than size-matched randomized networks, with fewer and larger connected components, reflecting the nonrandom nature of speech. Networks from FEP patients were smaller than from healthy participants, for a picture description task but not a story recall task. For the former task, FEP networks were also more fragmented than those from controls; showing more connected components, which tended to include fewer nodes on average. CHR-P networks showed fragmentation values in-between FEP patients and controls. A clustering analysis suggested that semantic speech networks captured novel signals not already described by existing NLP measures. Network features were also related to negative symptom scores and scores on the Thought and Language Index, although these relationships did not survive correcting for multiple comparisons.

Conclusions: Overall, these data suggest that semantic networks can enable deeper phenotyping of formal thought disorder in psychosis. Whilst here we focus on network fragmentation, the semantic speech networks created by Netts also contain other, rich information which could be extracted to shed further light on formal thought disorder. We are releasing Netts as an open Python package alongside this manuscript.

Keywords: disorganized speech; formal thought disorder; graph theory; natural language processing; psychosis.


Figures

Fig. 1.
Fig. 1.
Netts processing pipeline. Netts takes as input a speech transcript and outputs a network representing the semantic content of the transcript: a semantic speech network. Netts combines modern, high performance NLP techniques to preprocess the speech transcript, find nodes and edges, refine these nodes and edges and construct the final semantic speech network.
Fig. 2.
Fig. 2.
Example speech network. Semantic speech networks map the semantic content of transcribed speech engendered by the grammatical structure. Nodes in the network represent entities mentioned by the speaker (eg, I, man). Edges represent relations between nodes mentioned by the speaker (eg, see). Top left figure inset shows the stimulus picture that the participant described. Top right figure inset is the speech transcript.
Fig. 3.
Fig. 3.
General public networks. Semantic speech networks differ in their properties from random networks. (A) Histogram for number of nodes and scatter plot showing the relationship between number of nodes and number of edges of semantic speech networks from the general public. Each datapoint in the scatter plot represents one subject. Values were obtained by averaging across network measures from the eight TAT picture descriptions. (B) Top row shows number, mean size, and median size of the connected components in the speech graphs (blue bars) and a randomly chosen subset of the size-matched random graphs (gray bars). Bottom row shows normalized number, mean size, and median size of the connected components in speech graphs.
Fig. 4.
Fig. 4.
Clinical networks differ between groups. (A) Number of connected components, (B) mean connected component size, and (C) median connected component size showed differences between the FEP patient (FEP), clinical high risk (CHR-P), and healthy control groups (CON). Network measures shown are normalized to random networks. Each datapoint represents one subject. Values were obtained by averaging across network measures from the eight TAT picture descriptions. * indicates significant p-values at P < .05. ** indicates significant p-values at P < .01. (D, E) Semantic speech networks of patients had more and smaller connected components than the networks of healthy controls. D shows a typical network from a healthy control participant and E shows a typical network from a first episode psychosis patient. Plots A–C were produced using the Raincloud packageand D–E using networkX..
Fig. 5.
Fig. 5.
Clustered speech measures. Semantic speech network measures captured signal complementary to other NLP measures. Shown is a heatmap of Pearson’s correlations between semantic speech network measures and NLP measures in the clinical dataset. Black lines indicate communities detected using the Louvain method. The measures used in this analysis were the novel netts measures, as well as basic transcript measures and established NLP measures. Netts measures were number of connected components (CC Number), mean connected component size (CC Mean Size), and median connected component size (CC Median Size). Basic transcript measures were number of words, number of sentences, and mean sentence length. Established NLP measures included Tangentiality, Ambiguous Pronouns, Semantic Coherence (Coherence), On-Topic Score (On Topic) taken from Morgan et al. Additionally, syntactic network measures based on the method proposed by Mota et al,, were taken from Morgan et al and included number of nodes in the largest strongly connected component of syntactic networks (LSC), number of nodes in the largest weakly connected component of syntactic networks (LCC), as well as the LSC and LCC normalized to random networks (LSCr, LCCr). Pearson's correlations were calculated from each subject's average NLP value. Values were obtained for each measure by averaging across values calculated from the eight TAT picture descriptions.

References

    1. Liddle PF, Ngan ET, Caissie SL, et al. . Thought and language index: an instrument for assessing thought and language in schizophrenia. Br J Psychiatry. 2002;181:326–330. - PubMed
    1. Pfohl B, Winokur G.. The evolution of symptoms in institutionalized hebephrenic/catatonic schizophrenics. Br J Psychiatry. 1982;141:567–72. doi:10.1192/bjp.141.6.567. - DOI - PubMed
    1. Roche E, Creed L, Macmahon D, Brennan D, Clarke M.. The epidemiology and associated phenomenology of formal thought disorder: a systematic review. Schizophr Bull. 2015;41(4):951–62. doi:10.1093/schbul/sbu12 - DOI - PMC - PubMed
    1. Oeztuerk OF, Pigoni A, Wenzel J, et al. . The clinical relevance of formal thought disorder in the early stages of psychosis: results from the PRONIA study. Eur Arch Psychiatry Clin Neurosci. 2022; 272:403–13. doi:10.1007/s00406-021-01327-y - DOI - PMC - PubMed
    1. Tan EJ, Thomas N, Rossell SL.. Speech disturbances and quality of life in schizophrenia: differential impacts on functioning and life satisfaction. Compr Psychiatry. 2014;55(3):693–698. - PubMed

Publication types