. 2023 Mar 22;11(2):e0294422.
doi: 10.1128/spectrum.02944-22. Online ahead of print.

Role of the Extracytoplasmic Function Sigma Factor SigE in the Stringent Response of Mycobacterium tuberculosis

Affiliations

Role of the Extracytoplasmic Function Sigma Factor SigE in the Stringent Response of Mycobacterium tuberculosis

Giacomo Baruzzo et al. Microbiol Spectr. .

Abstract

Bacteria respond to nutrient starvation implementing the stringent response, a stress signaling system resulting in metabolic remodeling leading to decreased growth rate and energy requirements. A well-characterized model of stringent response in Mycobacterium tuberculosis is the one induced by growth in low phosphate. The extracytoplasmic function (ECF) sigma factor SigE was previously suggested as having a key role in the activation of stringent response. In this study, we challenge this hypothesis by analyzing the temporal dynamics of the transcriptional response of a sigE mutant and its wild-type parental strain to low phosphate using RNA sequencing. We found that both strains responded to low phosphate with a typical stringent response trait, including the downregulation of genes encoding ribosomal proteins and RNA polymerase. We also observed transcriptional changes that support the occurring of an energetics imbalance, compensated by a reduced activity of the electron transport chain, decreased export of protons, and a remodeling of central metabolism. The most striking difference between the two strains was the induction in the sigE mutant of several stress-related genes, in particular, the genes encoding the ECF sigma factor SigH and the transcriptional regulator WhiB6. Since both proteins respond to redox unbalances, their induction suggests that the sigE mutant is not able to maintain redox homeostasis in response to the energetics imbalance induced by low phosphate. In conclusion, our data suggest that SigE is not directly involved in initiating stringent response but in protecting the cell from stress consequent to the low phosphate exposure and activation of stringent response. IMPORTANCE Mycobacterium tuberculosis can enter a dormant state enabling it to establish latent infections and to become tolerant to antibacterial drugs. Dormant bacteria's physiology and the mechanism(s) used by bacteria to enter dormancy during infection are still unknown due to the lack of reliable animal models. However, several in vitro models, mimicking conditions encountered during infection, can reproduce different aspects of dormancy (growth arrest, metabolic slowdown, drug tolerance). The stringent response, a stress response program enabling bacteria to cope with nutrient starvation, is one of them. In this study, we provide evidence suggesting that the sigma factor SigE is not directly involved in the activation of stringent response as previously hypothesized, but it is important to help the bacteria to handle the metabolic stress related to the adaptation to low phosphate and activation of stringent response, thus giving an important contribution to our understanding of the mechanism behind stringent response development.

Keywords: Mycobacterium tuberculosis; sigma factors; stringent response; transcriptional regulation.


Conflict of interest statement

The authors declare no conflict of interest.

Figures
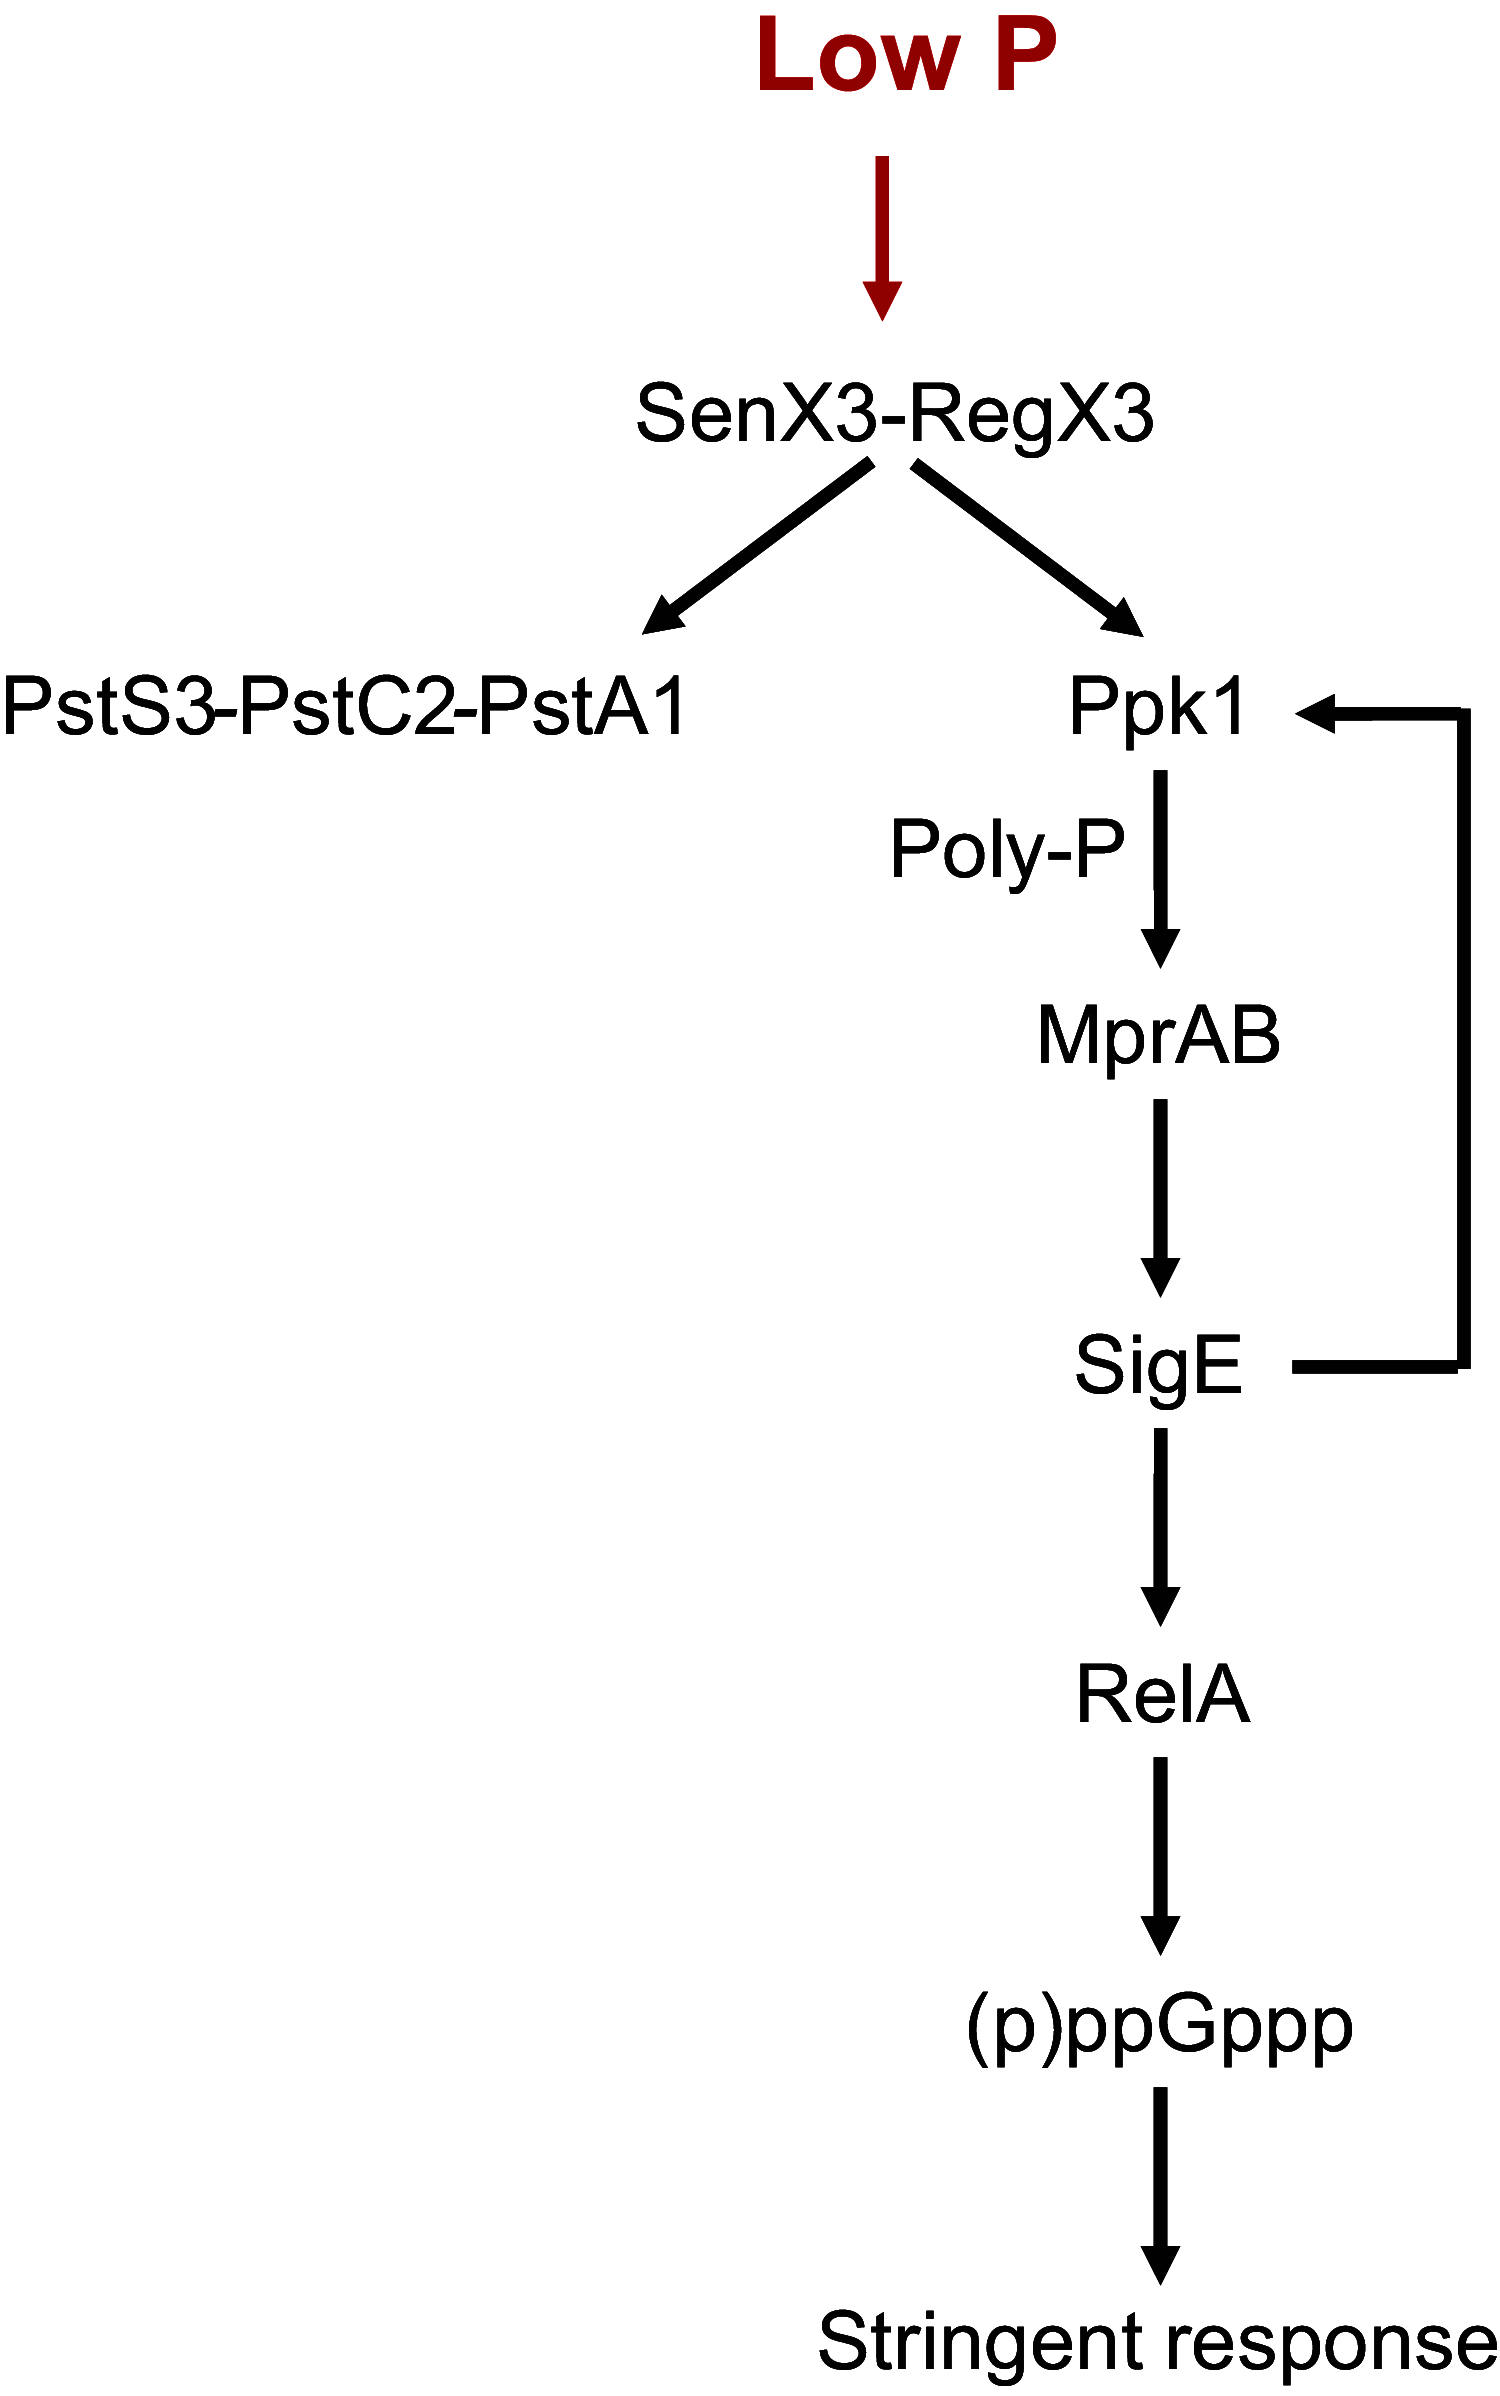
FIG 1
FIG 1
Schematic representation of the current stringent response network in M. tuberculosis. Low phosphate activates the two-component system SenX3-RegX3, which leads to the induction of the phosphate-specific transport operon pstS3-pstC2-pstA1 and of ppk1. PPK1 synthesizes PolyP, resulting in a more efficient activation of the MprAB two-component system (using PolyP as a substrate for MprB phosphorylation). MprB phosphorylation allows sigE induction. SigE increases the expression of the genes included in its regulon, including ppk1 and relA.
FIG 2
FIG 2
Clustering of differentially expressed genes in WT versus T0. Figure shows the 6 clusters of genes resulting from the k-means clustering. For each cluster, the gene expression profile of the centroid, i.e., gene expression profile obtained from the average of all the gene expression profiles in the cluster, is shown in black, together with 10 (randomly chosen) gene expression profiles from the same cluster (cyan). First row, gene expression profiles are plotted in the original scale to show the difference in gene expression level intensities. Second row, the same gene expression profiles are scaled in 0 to 1 to highlight the shape of the gene expression profiles.
FIG 3
FIG 3
Differential expression of gene involved in phosphate homeostasis in the wild-type strain. The charts report the expression level profiles of genes encoding proteins directly involved in the sensing of phosphate availability and phosphate uptake. (A) Two-component system. senX3, sensor histidine kinase; regX3, sensory transduction protein. (B) Phosphate transport operon. pstS3, periplasmic phosphate-binding lipoprotein; pstC2-pstA1, phosphate transporter, ABC type. (C) Phosphate transport operon. pstB, phosphate-transport ATP-binding protein; pstS1, periplasmic phosphate-binding lipoprotein; pstC1-pstA2, phosphate-transport integral membrane ABC transporters. (D) pstS2, periplasmic phosphate-binding lipoprotein; pknD, transmembrane serine/threonine-protein kinase.
FIG 4
FIG 4
Differential expression of electron transport chain genes. At the top, schematic representation of respiratory chain enzymatic complexes. The charts with cyan/pink lines report the expression level profiles of involved genes in both wild-type (WT) (cyan) and sigE-null mutant (ΔsigE) (pink). Cyt bc-aa3, cytochrome bc-aa3 oxidase; Cyt bd, cytochrome bd oxidase; N1, NADH dehydrogenase type 1; N2, NADH dehydrogenase type 2, ndh and ndA; Sdh1, succinate dehydrogenase 1; Sdh2, succinate dehydrogenase 2. MK, oxidized menaquinone; MKH2, reduced menaquinone.
FIG 5
FIG 5
Differential expression of genes involved in the core of central carbon metabolism. The charts with cyan/pink lines report the expression level profiles of involved genes in both wild-type (WT) (cyan) and the sigE-null mutant (ΔsigE) (pink). Genes that are up-expressed at 6, 12, and 24 h compared to time zero are highlighted in red; genes that are down-expressed at 6, 12, and 24 h compared to time zero are highlighted in blue.
FIG 6
FIG 6
Clustering of differentially expressed genes in MU versus T0. Six clusters of genes resulting from the k-means clustering. For each cluster, the gene expression profile of the centroid, i.e., gene expression profile obtained from the average of all of the gene expression profiles in the cluster, is shown in black, together with 10 (randomly chosen) gene expression profiles from the same cluster (salmon/pink). First row, gene expression profiles are plotted in the original scale to show the difference in gene expression level intensities. Second row, the same gene expression profiles are scaled in 0 to 1 to highlight the shape of the gene expression profiles.
FIG 7
FIG 7
Schematic representation of the stringent response network in M. tuberculosis WT and sigE mutant strain showing the induction of the SigE-dependent genes in response to low pH, totally abrogated in the sigE-null mutant, as well as the induction of sigH and related genes in the sigE mutant. The charts with cyan/pink lines report the expression level profiles of involved genes in both wild-type (WT) (cyan) and the sigE-null mutant (ΔsigE) (pink). Explanation in text.

References

    1. World Health Organization. 2021. Global tuberculosis report 2021. World Health Organization, Geneva, Switzerland. https://www.who.int/publications/i/item/9789240037021. Retrieved 11 February 2022.
    1. Boldrin F, Provvedi R, Cioetto Mazzabò L, Segafreddo G, Manganelli R. 2020. Tolerance and persistence to drugs: a main challenge in the fight against Mycobacterium tuberculosis. Front Microbiol 11:1924. doi: 10.3389/fmicb.2020.01924. - DOI - PMC - PubMed
    1. Danchik C, Wang S, Karakousis PC. 2021. Targeting the Mycobacterium tuberculosis stringent response as a strategy for shortening tuberculosis treatment. Front Microbiol 12:2970. doi: 10.3389/fmicb.2021.744167. - DOI - PMC - PubMed
    1. Hauryliuk V, Atkinson GC, Murakami KS, Tenson T, Gerdes K. 2015. Recent functional insights into the role of (p)ppGpp in bacterial physiology. Nat Rev Microbiol 13:298–309. doi: 10.1038/nrmicro3448. - DOI - PMC - PubMed
    1. Sureka K, Dey S, Datta P, Singh AK, Dasgupta A, Rodrigue S, Basu J, Kundu M. 2007. Polyphosphate kinase is involved in stress-induced mprAB-sigE-rel signalling in mycobacteria. Mol Microbiol 65:261–276. doi: 10.1111/j.1365-2958.2007.05814.x. - DOI - PubMed