. 2023 Jun 2;13(6):1428-1453.
doi: 10.1158/2159-8290.CD-22-1046.

Cell-Autonomous Cxcl1 Sustains Tolerogenic Circuitries and Stromal Inflammation via Neutrophil-Derived TNF in Pancreatic Cancer

Affiliations

Cell-Autonomous Cxcl1 Sustains Tolerogenic Circuitries and Stromal Inflammation via Neutrophil-Derived TNF in Pancreatic Cancer

Anna Bianchi et al. Cancer Discov. .

Abstract

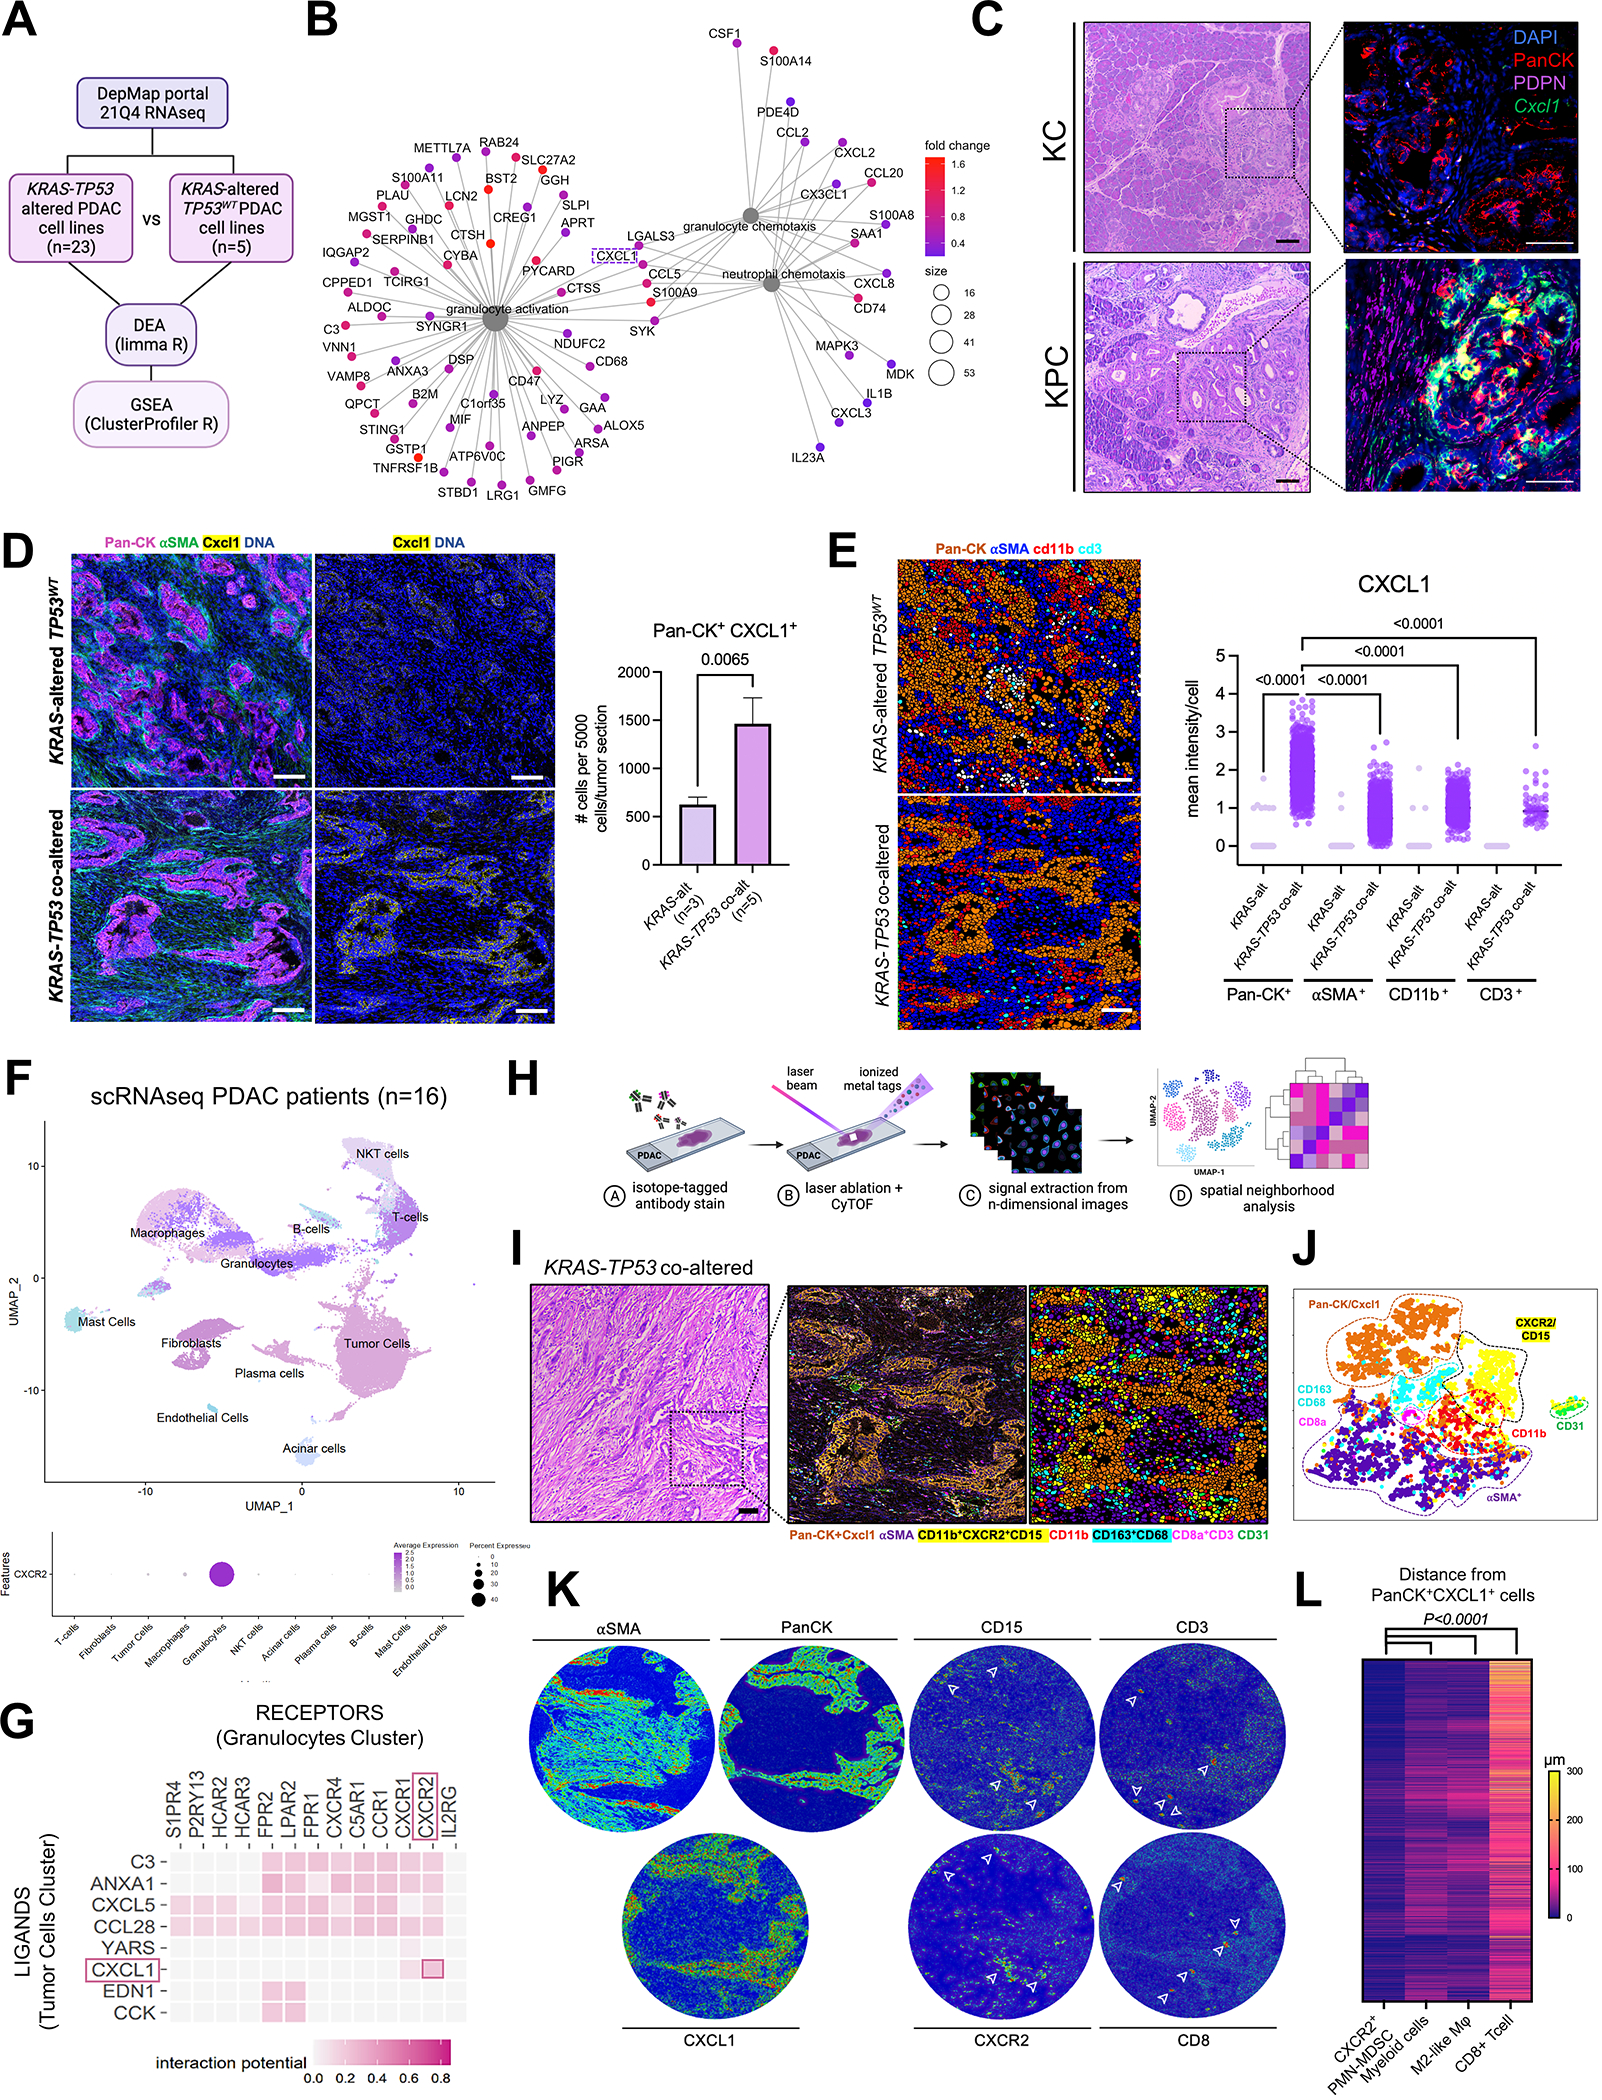
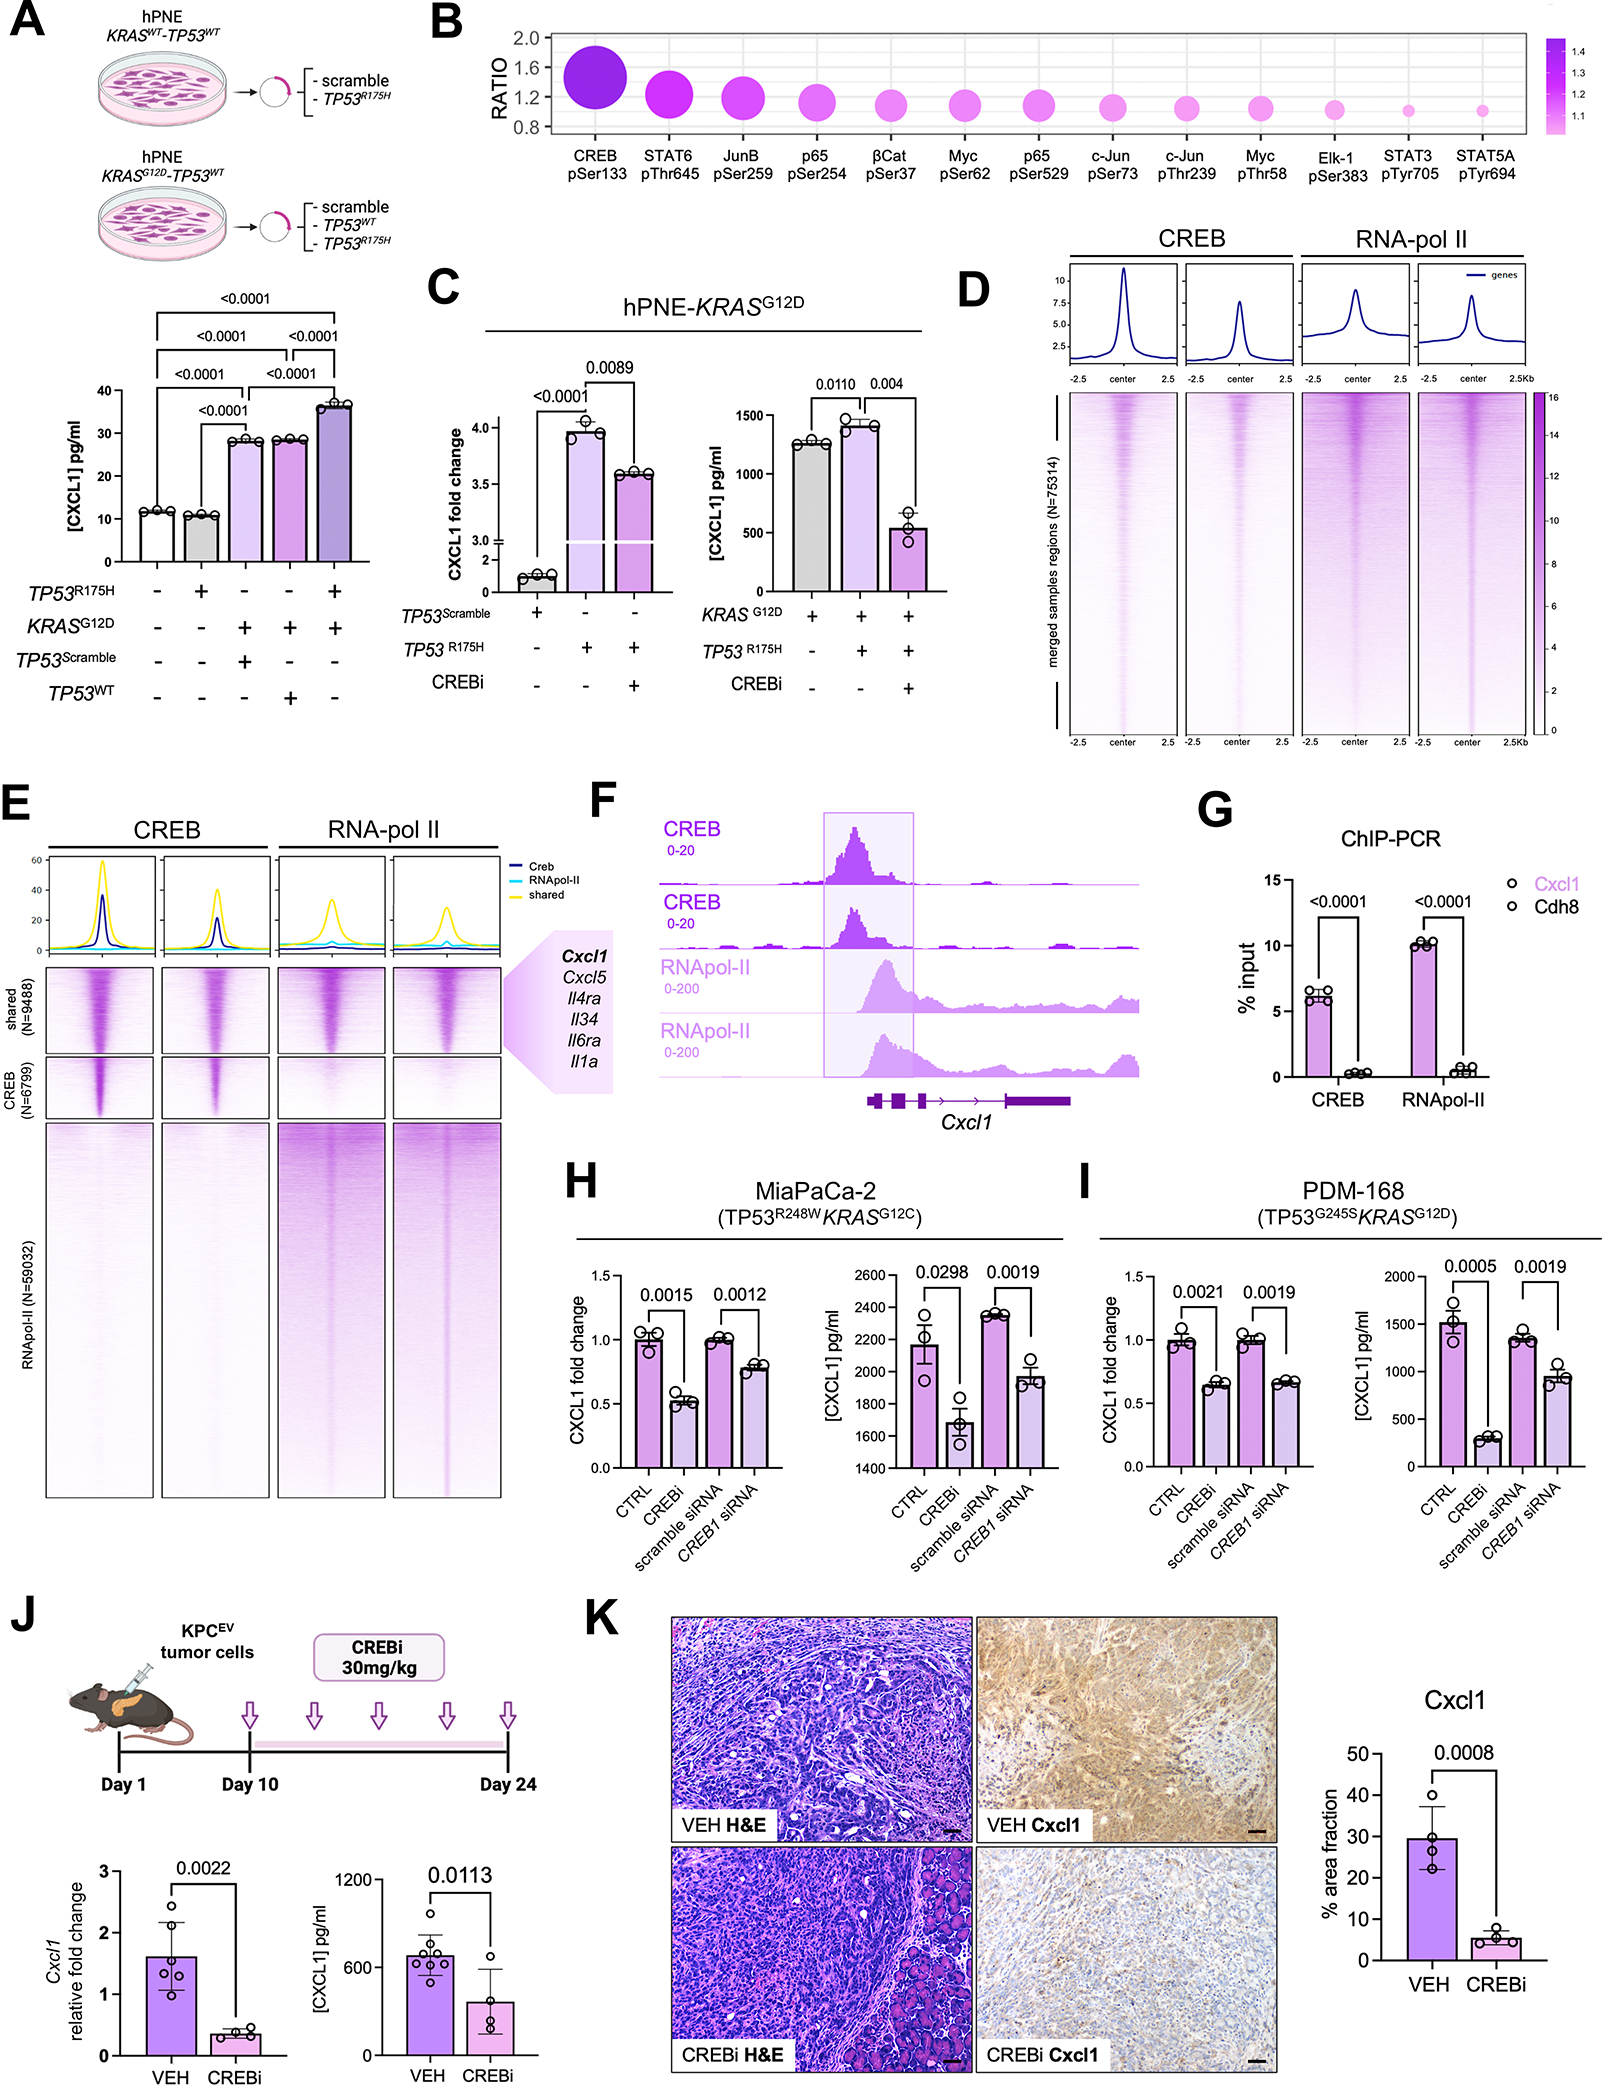
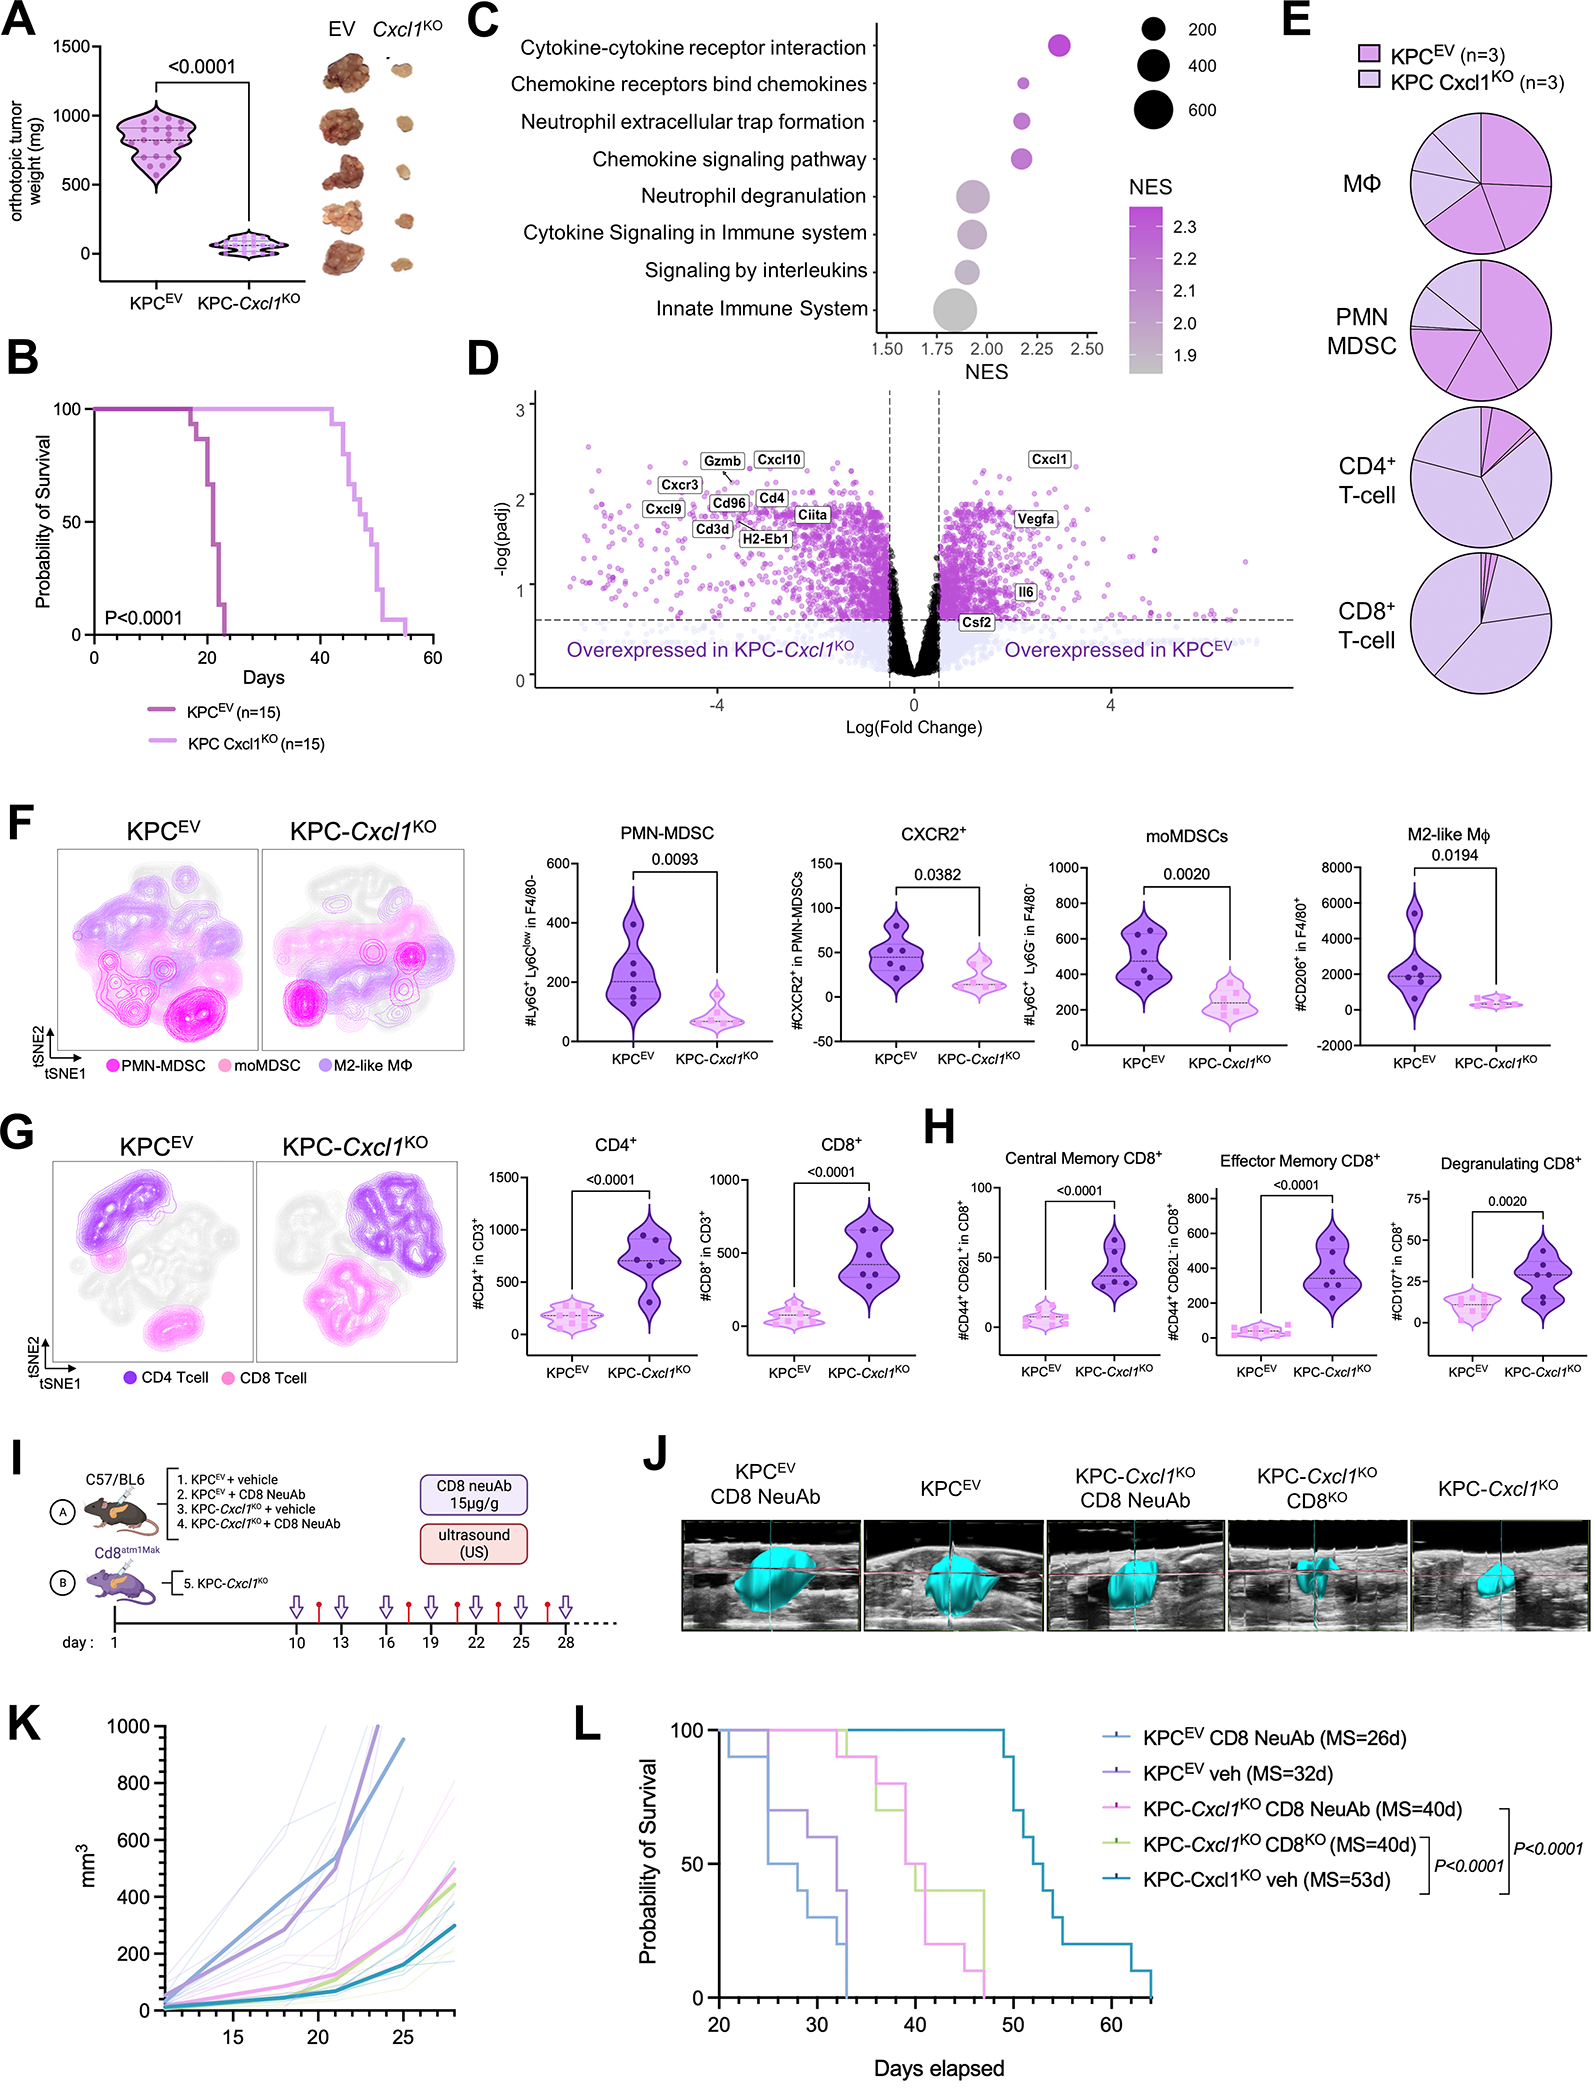
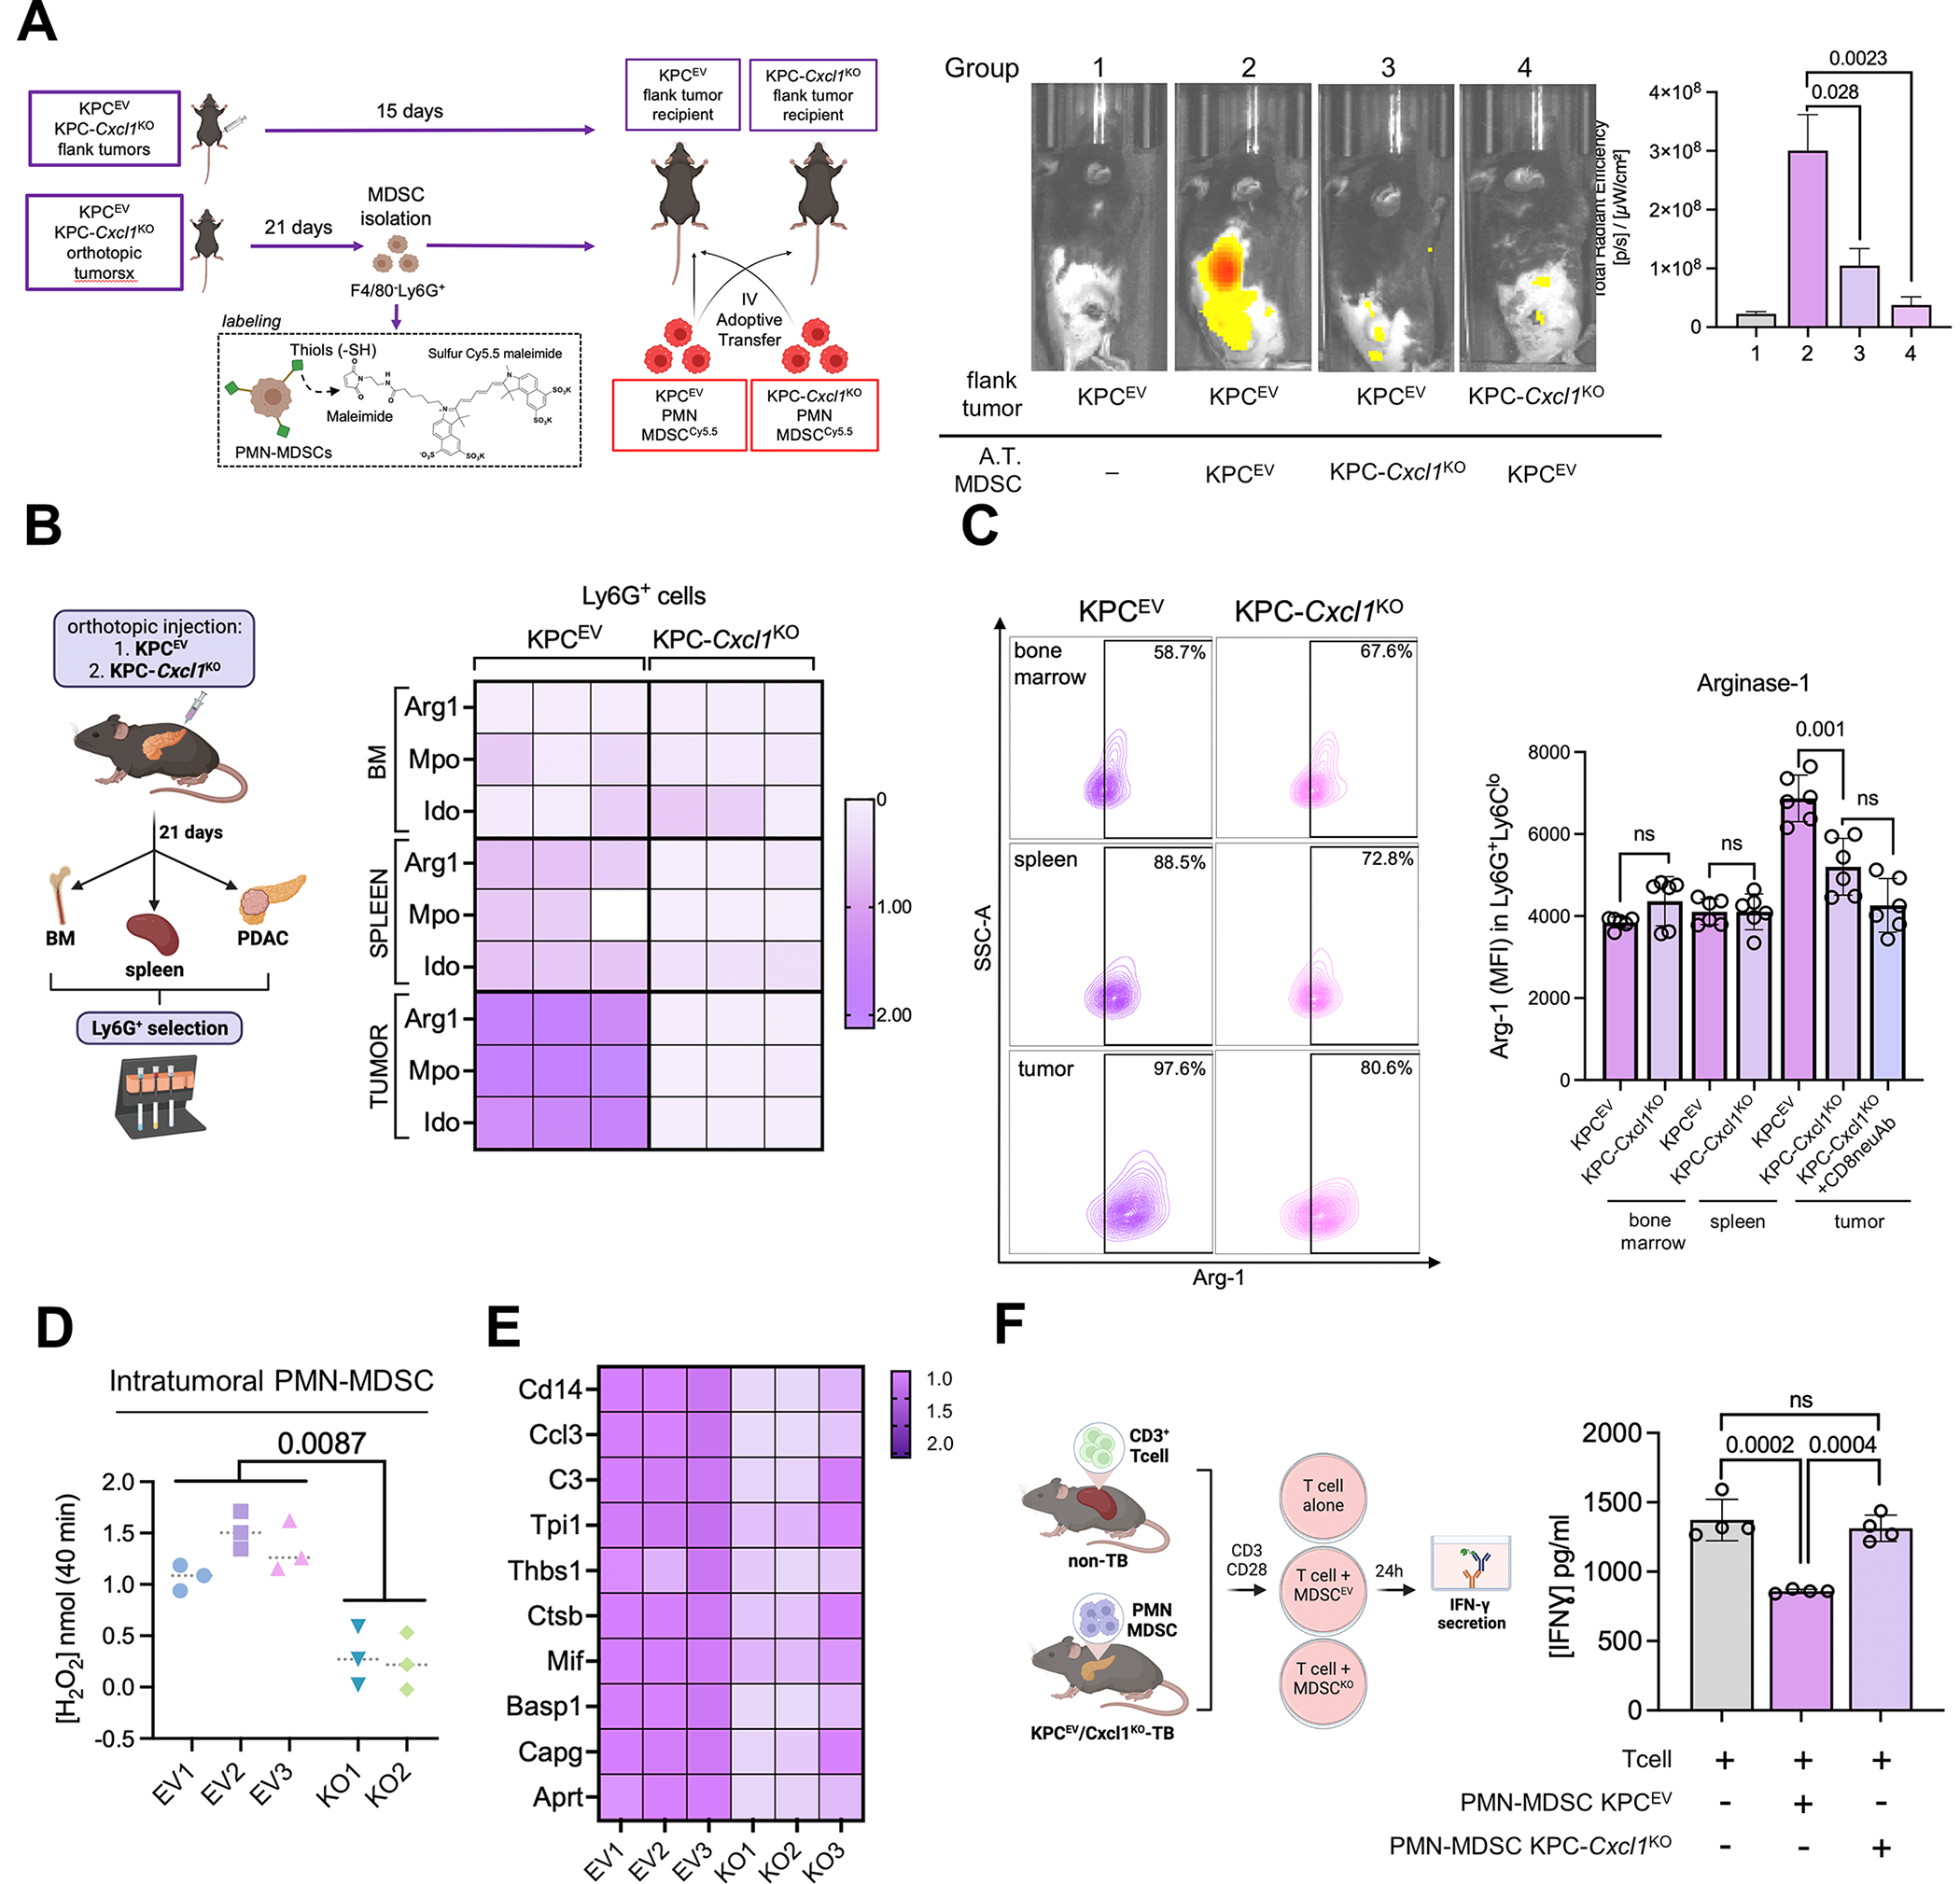
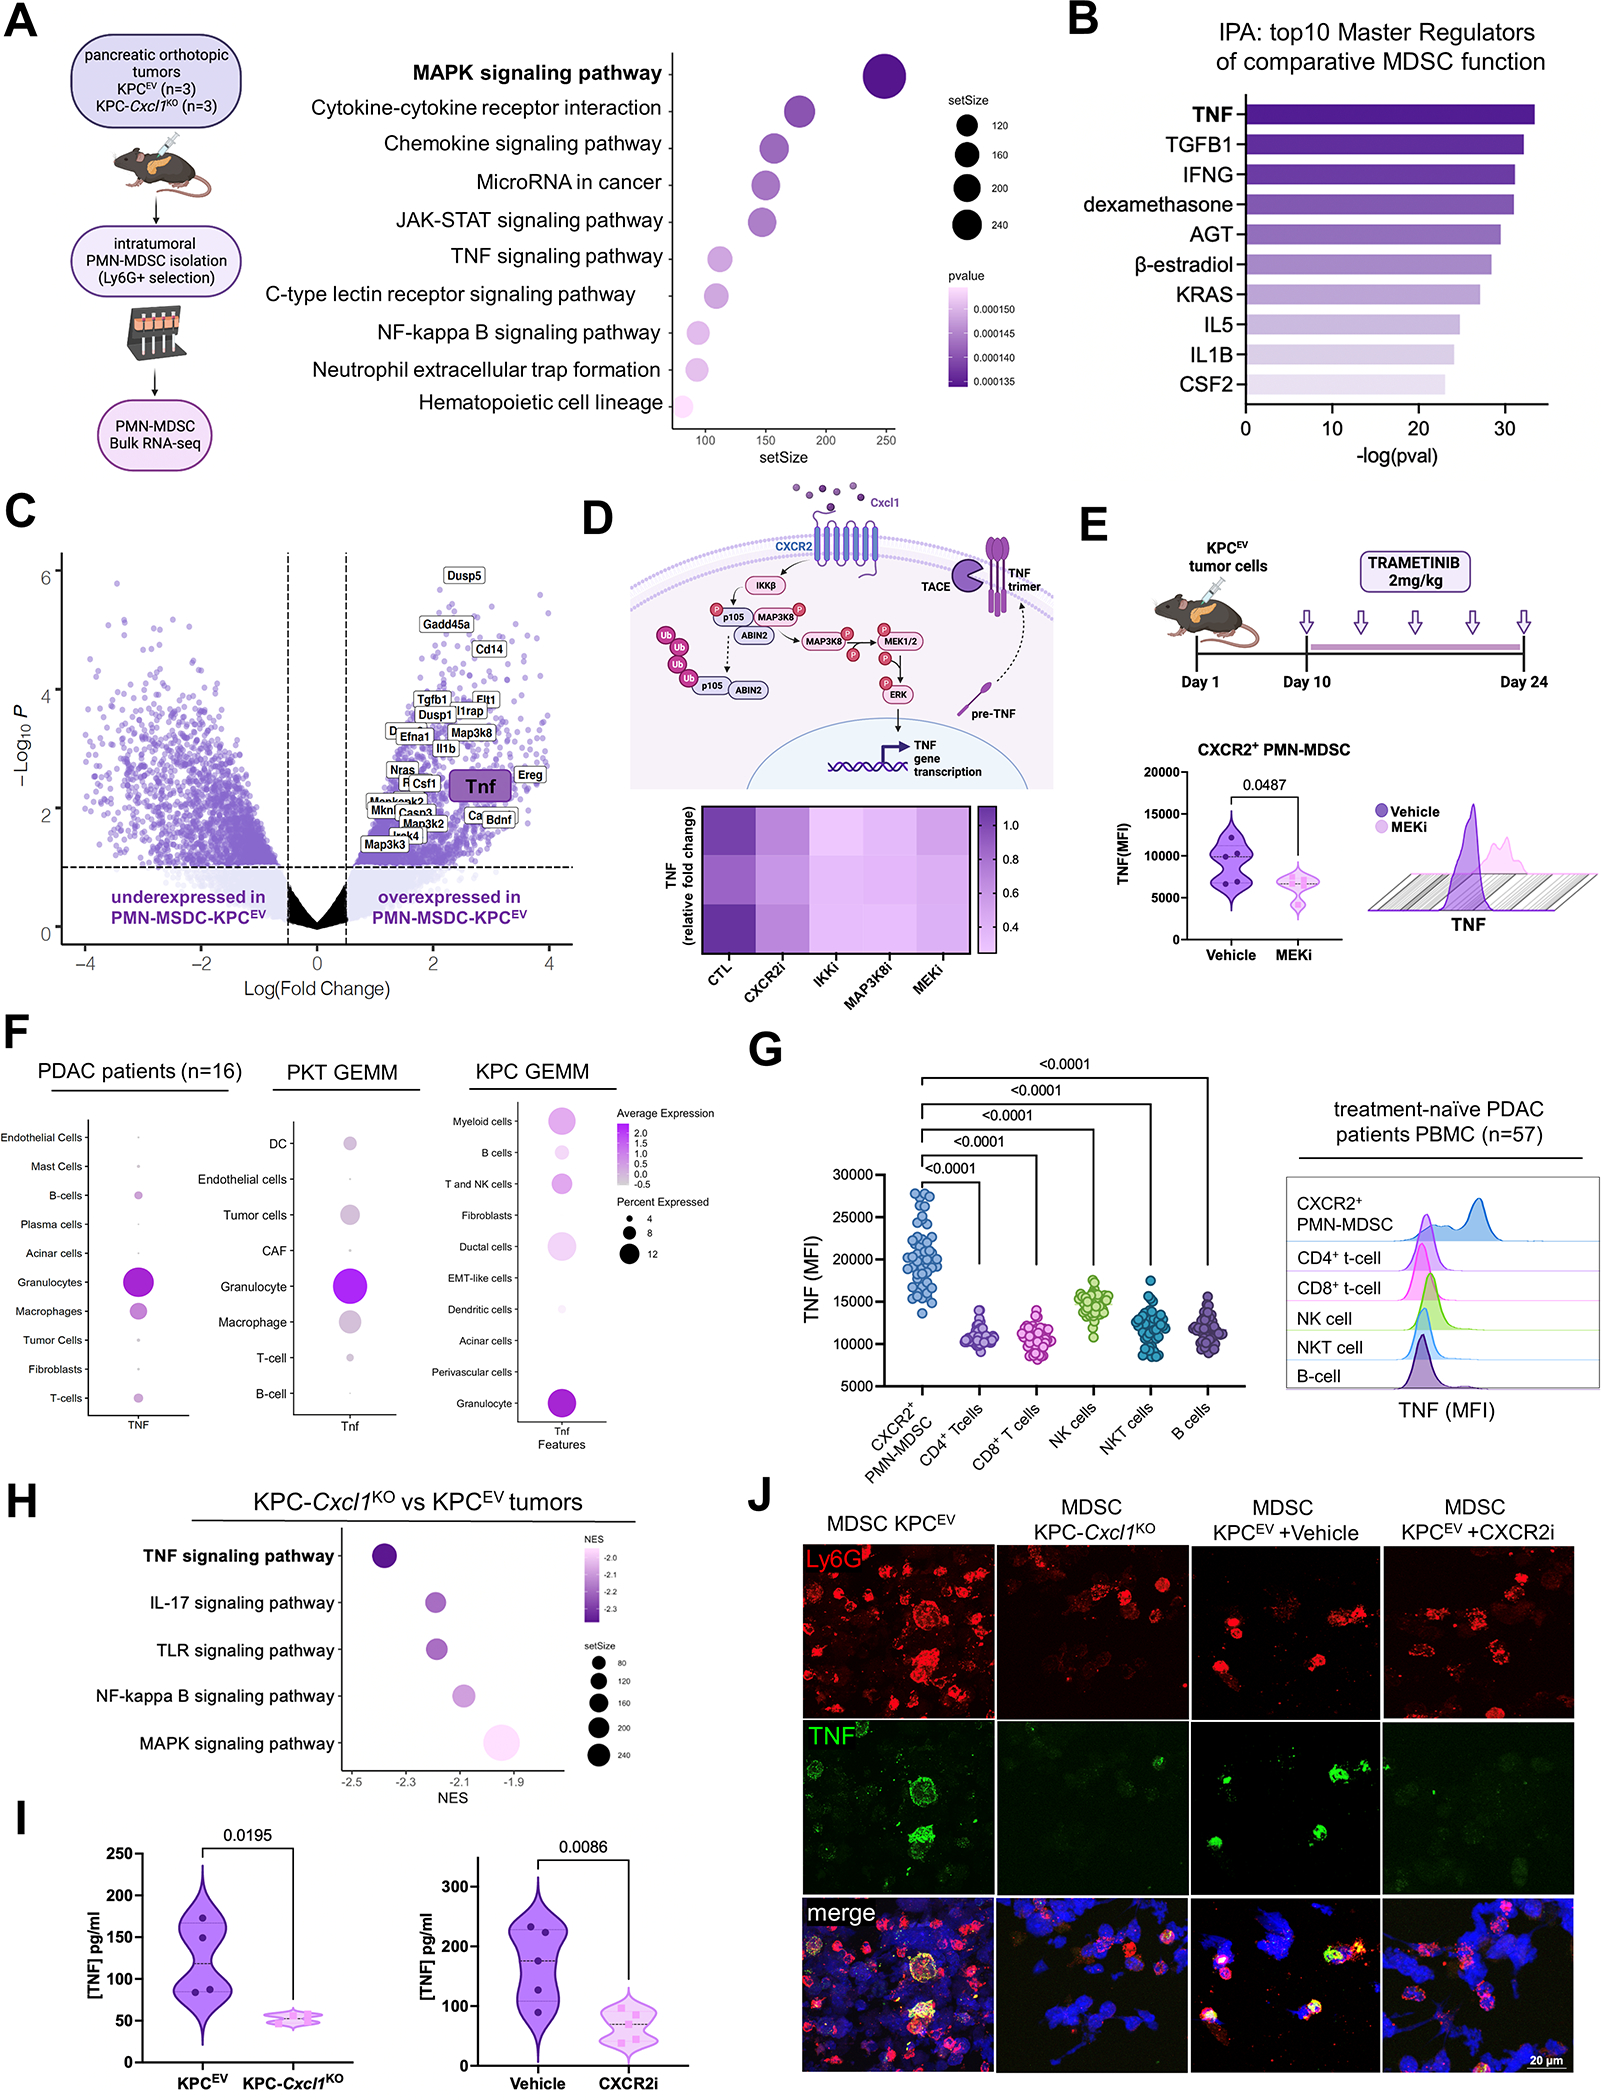
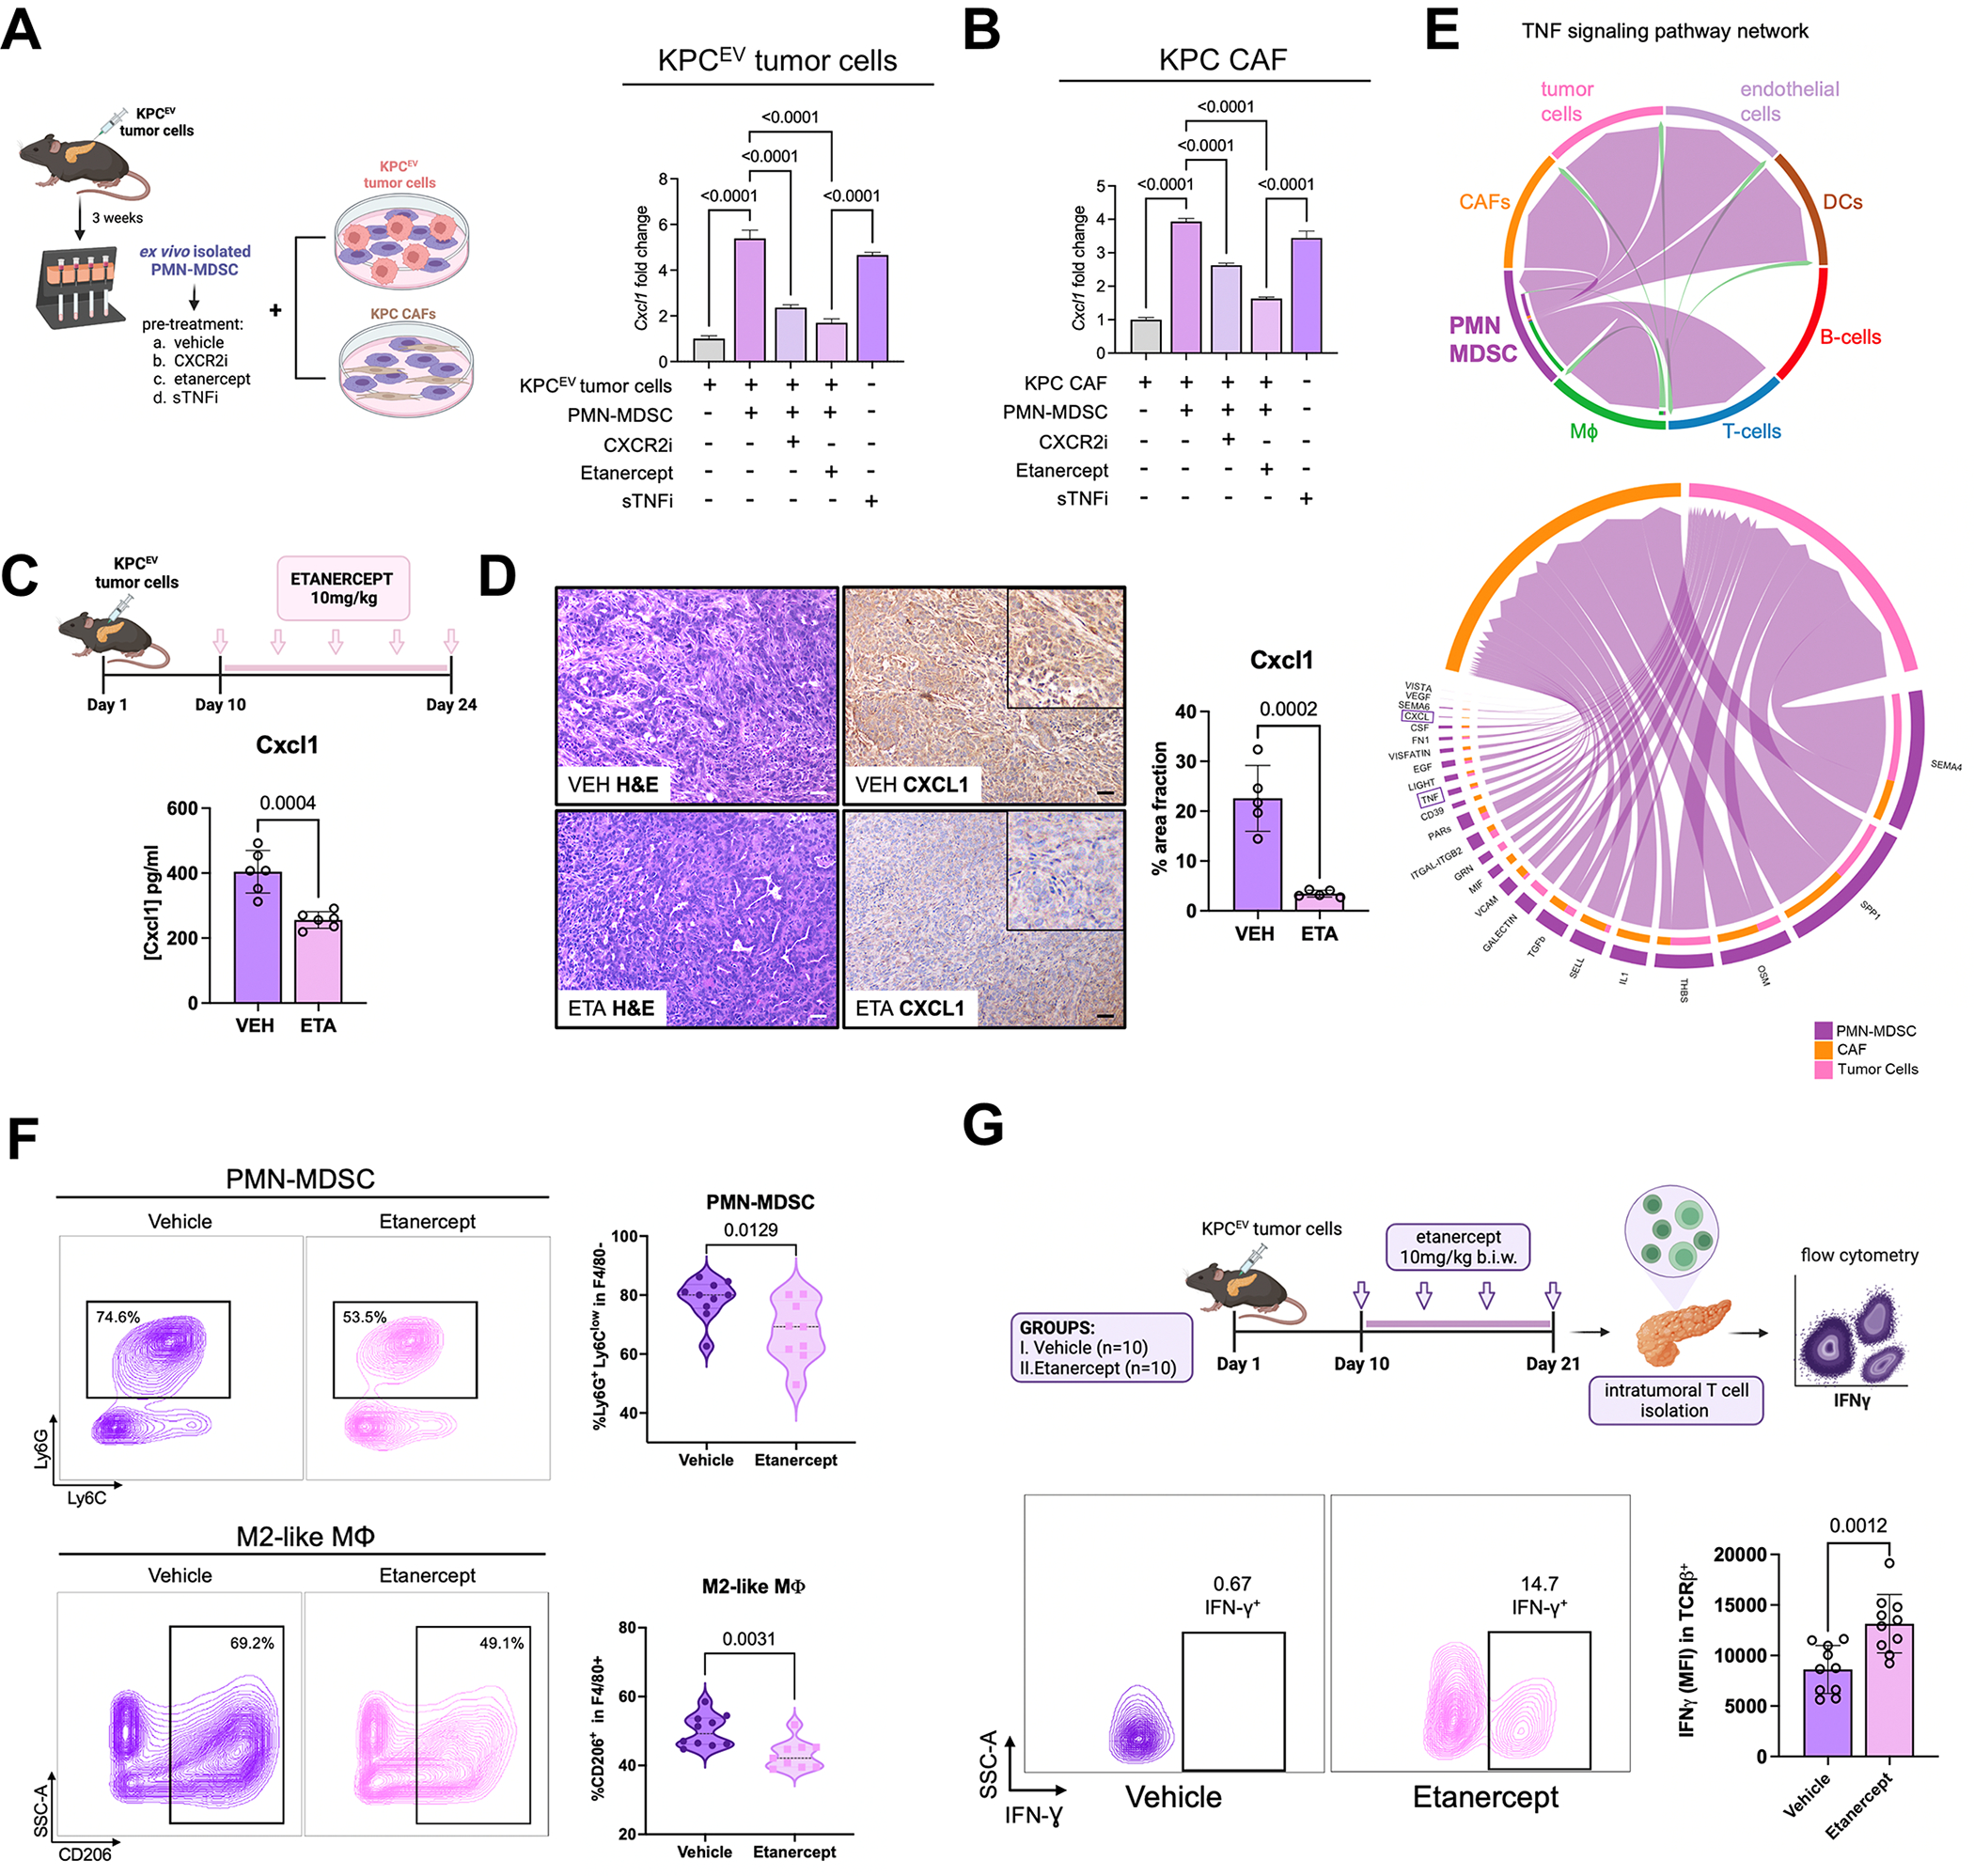
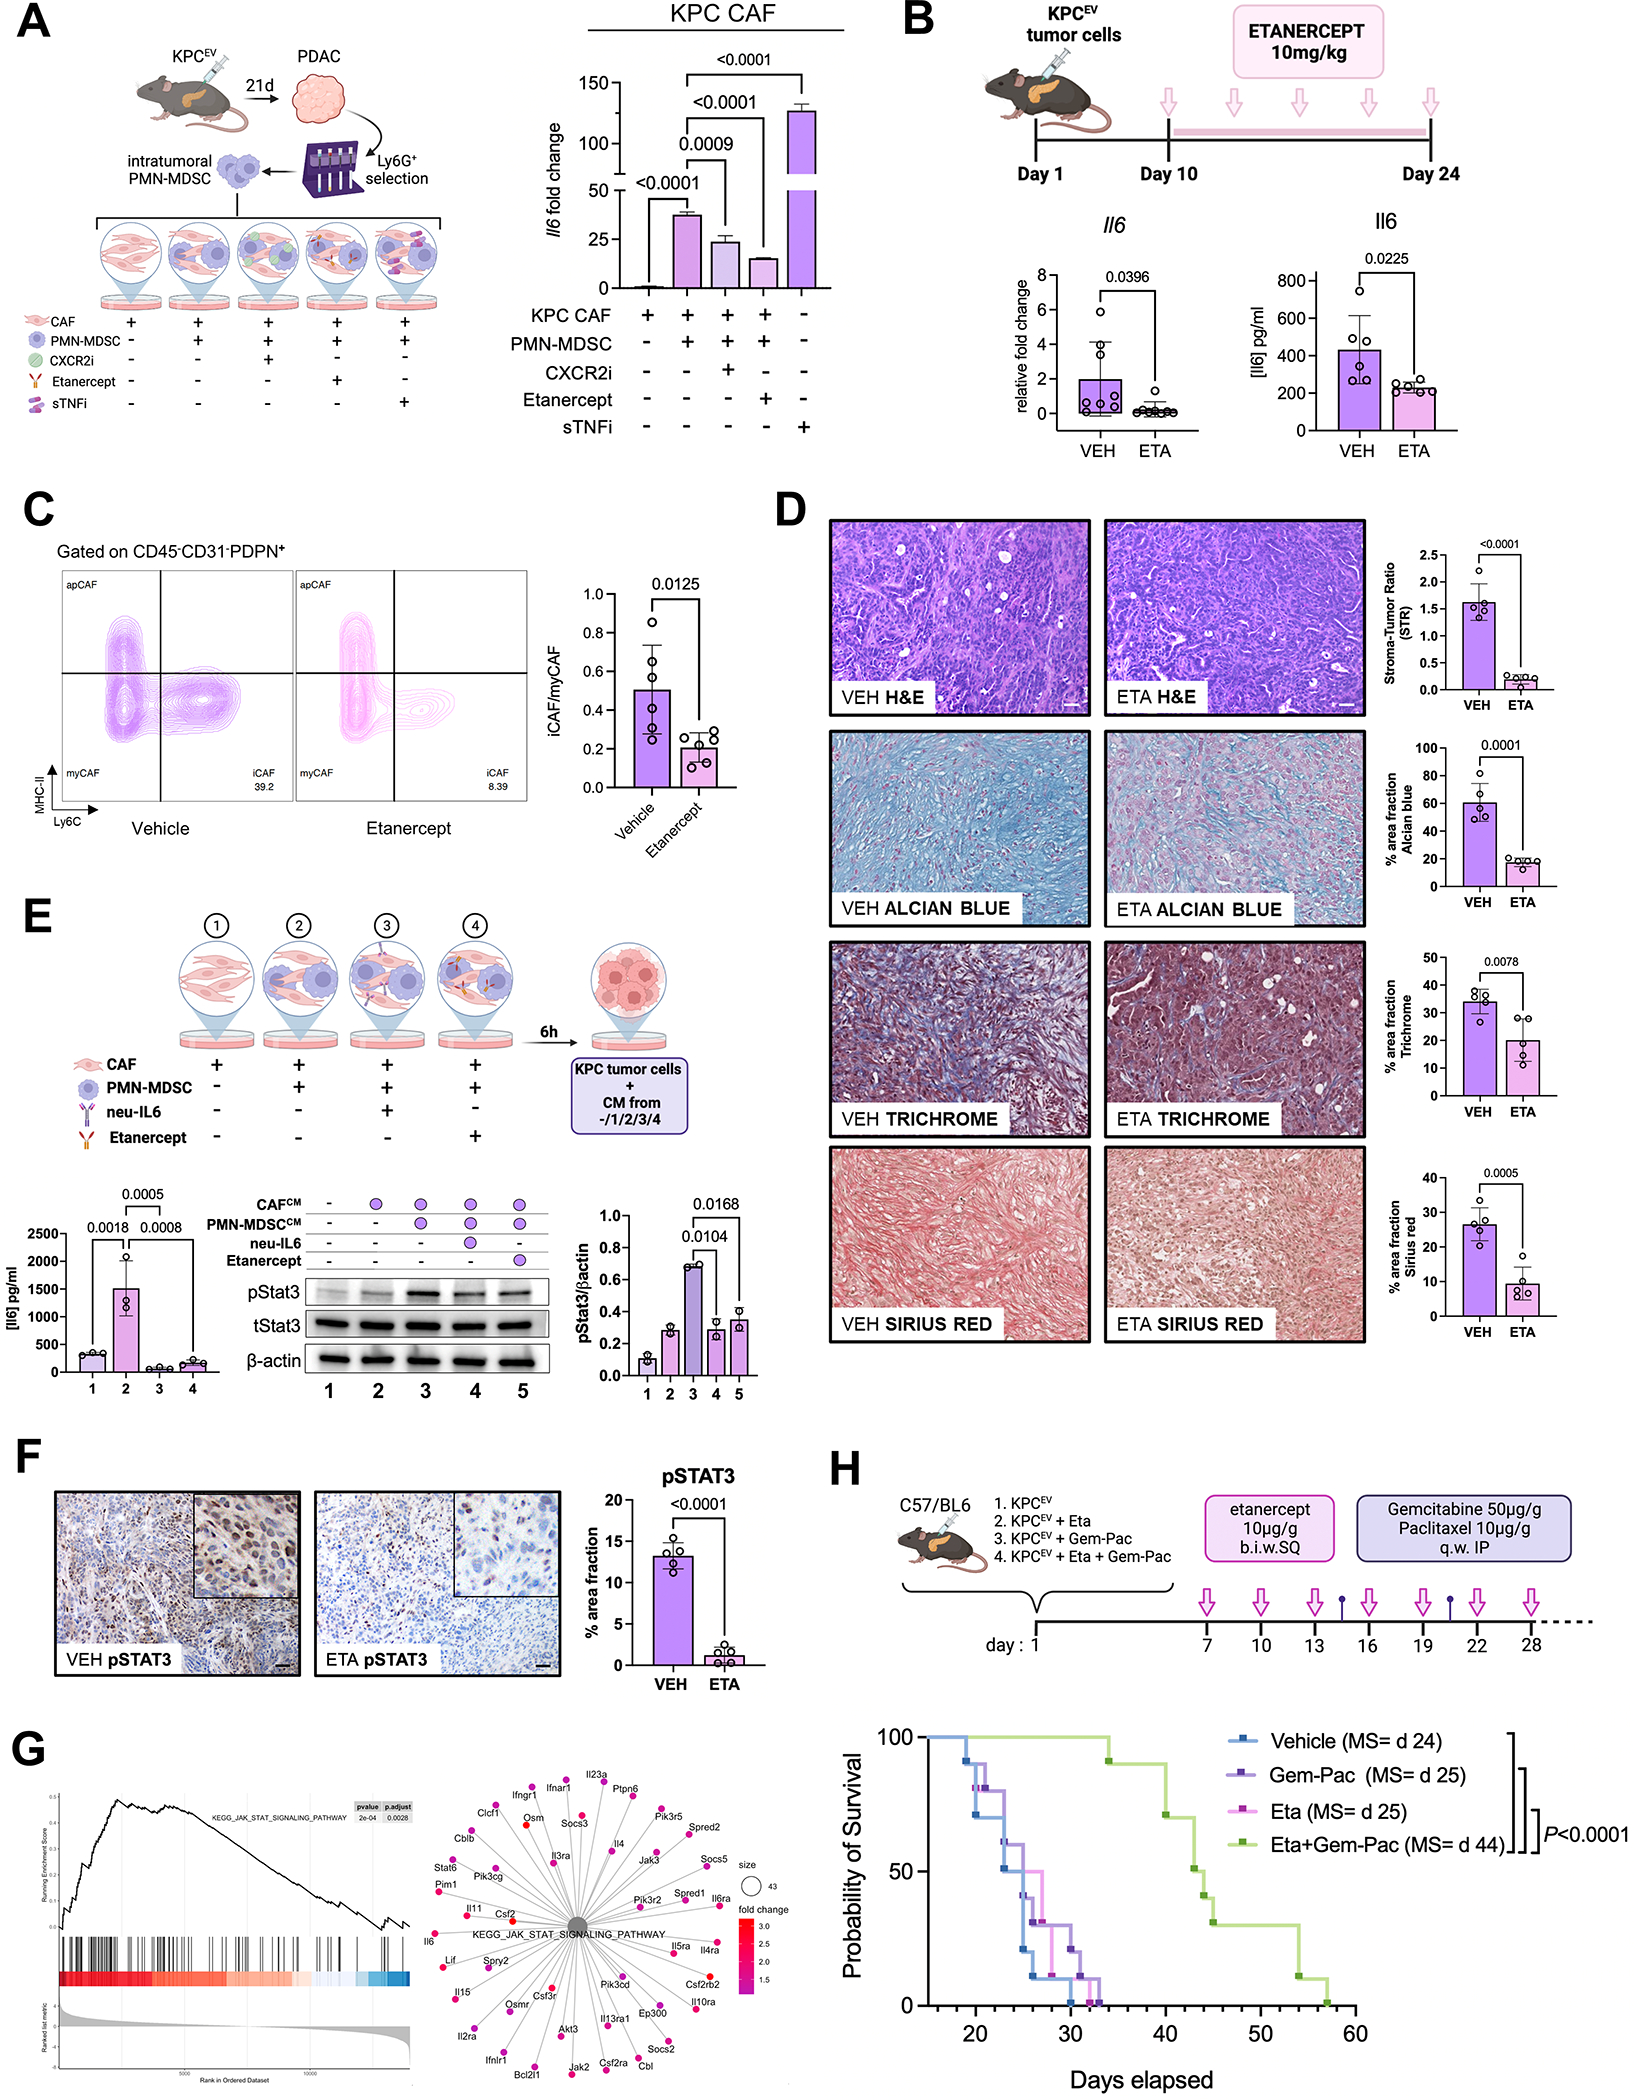
We have shown that KRAS-TP53 genomic coalteration is associated with immune-excluded microenvironments, chemoresistance, and poor survival in pancreatic ductal adenocarcinoma (PDAC) patients. By treating KRAS-TP53 cooperativity as a model for high-risk biology, we now identify cell-autonomous Cxcl1 as a key mediator of spatial T-cell restriction via interactions with CXCR2+ neutrophilic myeloid-derived suppressor cells in human PDAC using imaging mass cytometry. Silencing of cell-intrinsic Cxcl1 in LSL-KrasG12D/+;Trp53R172H/+;Pdx-1Cre/+(KPC) cells reprograms the trafficking and functional dynamics of neutrophils to overcome T-cell exclusion and controls tumor growth in a T cell-dependent manner. Mechanistically, neutrophil-derived TNF is a central regulator of this immunologic rewiring, instigating feed-forward Cxcl1 overproduction from tumor cells and cancer-associated fibroblasts (CAF), T-cell dysfunction, and inflammatory CAF polarization via transmembrane TNF-TNFR2 interactions. TNFR2 inhibition disrupts this circuitry and improves sensitivity to chemotherapy in vivo. Our results uncover cancer cell-neutrophil cross-talk in which context-dependent TNF signaling amplifies stromal inflammation and immune tolerance to promote therapeutic resistance in PDAC.

Significance: By decoding connections between high-risk tumor genotypes, cell-autonomous inflammatory programs, and myeloid-enriched/T cell-excluded contexts, we identify a novel role for neutrophil-derived TNF in sustaining immunosuppression and stromal inflammation in pancreatic tumor microenvironments. This work offers a conceptual framework by which targeting context-dependent TNF signaling may overcome hallmarks of chemoresistance in pancreatic cancer. This article is highlighted in the In This Issue feature, p. 1275.


Conflict of interest statement

Disclosure: The authors declare no potential conflicts of interest

Figures

Figure 1.
Figure 1.. Cxcl1 is overexpressed in Ras-p53 cooperative PDAC and governs spatial exclusion of T-cells in human tumors.
A, Schematic of transcriptomic comparison between KRAS-TP53 co-altered (n=23) and KRAS-altered/TP53WT(n=5) human PDAC cell lines from the Cancer Cell Line Encyclopedia (CCLE), with subsequent differential expression analysis (DEA) and gene set enrichment analysis (GSEA); B, Net plot visualizing the top 3 gene-sets related to granulocyte/neutrophil function overexpressed in KRAS-TP53 co-altered PDAC tumor-cell transcriptomes, with 5 transcripts conserved between these pathways (CXCL1 highlighted in dashed box) shown; C, H&E sections paired with immunostaining for pancytokeratin (PanCK), podoplanin (PDPN), and RNA-in situ hybridization to detect Cxcl1 mRNA in representative sections from volume-matched tumors in genetic models LSL-K-rasG12D/+; Trp53R172H/+; Pdx-1Cre/+ (KPC; 6-months old) and LSL-K-rasG12D/+;Pdx-1Cre/+ (KC; 12-months old). Quantification of relative Cxcl1 mRNA expression in PanCK+ cells provided in Supplementary Fig. S1C; D, Imaging Mass Cytometry (IMC) comparing epithelial expression of CXCL1 in human KRAS-TP53 co-altered (n=5) compared to KRAS-altered/TP53WT (n=3) tumors at single-cell resolution, with adjacent histogram showing quantification of average number of PanCK+CXCL1+ cells per 5000 single cells in each tumor section across groups; E, IMC image segmentation into PanCK+ tumor cells, αSMA+ fibroblasts, CD11b+ myeloid cells, CD3+ T cells in KRAS-TP53 co-altered (KRAS+TP53) vs. KRAS-altered/TP53WT (KRAS) human PDAC sections, with adjacent quantification of mean intensity of CXCL1 expression in each cell type across groups. Cell populations were grouped according to any positive pixel intensity for the respective marker, with discrepancies and overlap between phenotypes reconciled manually; F, Uniform Manifold Approximation and Projection (UMAP) showing annotated clusters from single-cell RNA sequencing (scRNAseq) data in human PDAC patient samples (n=16; top), with bubble plot showing relative CXCR2 expression between different clusters (bottom); G, Heatmap showing tumor cell (donor) to granulocyte (recipient) ligand-receptor interactome in human scRNAseq dataset using NicheNet algorithm, with CXCL1-CXCR2 interaction highlighted (red box); H, Schematic representation of IMC workflow to provide spatially resolved single-cell phenotypes of human PDAC tumors; I-J, H&E, spatial phenotype map, and image segmentation of representative KRAS-TP53 co-altered human PDAC tumor section (I), with single-cell clustering in T-distributed Stochastic Neighborhood Embedding (tSNE) maps (J) of 72,880 single-cells in 8 pre-defined ROIs each from a unique patient sample, distributed into epithelial/tumor cell (PanCK+CXCL1+), stromal/fibroblast (αSMA+), endothelial (CD31+), myeloid (CD11b+), PMN-MDSC (CD15+CXCR2+), M2-like macrophage (CD68+CD163+), and CD8+ T cell (CD3+CD8+) populations; K, Tissue heatmaps showing expression of αSMA, PanCK, CXCL1, CD15, CXCR2, CD3 and CD8 in representative KRAS-TP53 co-altered human PDAC tumor section; L, Heatmap depicting spatially resolved distances of single CXCR2+CD11b+CD15+ PMN-MDSC, CD11b+ myeloid cell, CD68+CD163+ M2-like macrophage, and CD3+CD8+ T-cells from PanCK+ tumor-cells in 8 ROIs from human PDAC sections.
Figure 2.
Figure 2.. KRAS and TP53 mutations cooperate to transcriptionally regulate CXCL1 via CREB activation in pancreatic cancer cells.
A, Schematic representing experimental constructs utilized to overexpress TP53WT or TP53R175H in isogenic hPNE-KRASWT or hPNE-KRASG12D pancreatic epithelial cells (top). Histogram showing Cxcl1 secretion from each hPNE cell system annotated by respective KRAS and/or TP53 mutational status (bottom); B, Bubble plot representing the top 10 transcription factors hyperphosphorylated in hPNE-KRASG12DTP53R175H compared with hPNE-KRASG12DTP53WT cells, with relative ratio of expression indicated on y-axis; C, Histograms representing relative fold change in CXCL1 gene expression (left) and secretion (in pg/mL; right) from hPNE-KRASG12DTP53WT and hPNE-KRASG12DTP53R175H in absence or presence of Creb inhibitor 666-15 (CREBi 0.5 μM for 24h, n=3); D, Chromatin immunoprecipitation and sequencing (ChIP-seq) peak signals and heat maps of CREB regions in CREB and RNApol-II ChIP material (n=2 biologic replicates each) in Kras-Trp53 cooperative KPC 6694c2 cells; E, ChIP-seq heatmaps showing co-occupied CREB and RNApol-II peaks (N=9488), CREB-unique peaks (N=6799), RNApol-II unique peaks (N=59032), with adjacent callout box showing curated gene module implicated in inflammatory signaling and innate immune regulation; F, Integrative Genome Viewer (IGV) plot visualizing co-occupancy of peaks in CREB and RNApol-II ChIP-seq data at the transcriptional start site of Cxcl1 promoter; G, ChIP-qPCR of Cxcl1 and Cdh8 (negative control) from CREB and RNApol-II immunoprecipitated purified DNA in KPC 6694c2 cells; H-I, CXCL1 gene expression (left) and secretion (right) each in human MiaPaCa-2 cells (H) and human PDM-168 patient-derived organoids (I) in absence or presence of CREBi 666-15 (0.5 μM for 24h) or absence or presence of Creb siRNA (n=3 each); J, Schematic of Creb inhibitor treatment of KPC orthotopic mice in vivo (top). Bar plots showing Cxcl1 gene expression via qPCR and protein levels via ELISA (in pg/mL) in whole tumor lysates from vehicle-treated vs. Crebi-treated mice (n=4–7 mice); K, Cxcl1 immunostaining with corresponding H&E staining in representative tumor sections from vehicle- vs. CREBi-treated mice (n=4–5/group; scale bar=50μm).
Figure 3.
Figure 3.. Genetic silencing of tumor cell-intrinsic Cxcl1 overcomes T-cell exclusion and controls tumor growth in a CD8+ T-cell dependent manner in-vivo.
A, Violin plot representing difference in primary tumor weights in C57/BL6 mice orthotopically-injected with KPCEV or KPC-Cxcl1KO tumor-cells (n=20/group; left), with representative images of tumors from each group showing phenotypic reproducibility (n=5 each; right); B, Kaplan-Meier curves showing overall survival of KPC-Cxcl1KO and KPCEV orthotopically-injected mice (n=15; median 48 vs. 21 days); C, Bubble plot visualizing differentially upregulated pathways (using KEGG and Reactome knowledgebases) in 3-week whole-tumor transcriptomes from KPCEV compared with KPC-Cxcl1KO orthotopic tumors via RNA-sequencing (n=3 biologic replicates); D, Volcano plot depicting significantly enriched genes related to immune regulation in KPCEV (Cxcl1, Vegfa, Il6, Csf2), and KPC-Cxcl1KO (Cxcl10, Gzmb, Cxcr3, Cxcl9, Cd96, Cd3d, Cd4, Ciita, H2-Eb1); E, Pie charts showing relative proportions of immune-cell fractions of macrophages (Mϕ), PMN-MDSC, CD4+ T-cells, and CD8+ T-cells using CIBERSORT immune deconvolution from transcriptomes in KPCEV vs. KPC-Cxcl1KO tumors (n=3 biologic replicates per group); F-G, viSNE contour plots of flow cytometric immunophenotyping in concatenated single-cell suspensions from KPCEV or KPC-Cxcl1KO orthotopic tumors (left), with adjacent violin plots (right) representing absolute cell counts of PMN-MDSC, CXCR2+ PMN-MDSC, monocytic MDSC (moMDSC), M2-like macrophage (F), CD4+ T-cells and CD8+ T-cells (G), and central memory T-cells, effector memory T-cells, degranulating CD8+ T-cells (H) from each biologic replicate (n=6–8/group); I, Schematic of experimental design utilizing CD8+ T-cell neutralizing antibodies (CD8neuAb) in C57Bl/6 mice or CD8α−/− transgenic mice (B6.Cd8atm1Mak; CD8KO) for orthotopic injections; J, Representative ultrasound images from mice in each treatment group showing tumor growth dynamics in vivo; K-L, tumor growth curves (K) and Kaplan-Meier survival estimates (L) from mice across 5 groups in T-cell depletion experiments (n=10 mice/group), with median survival (MS) of each cohort indicated in parentheses.
Figure 4.
Figure 4.. Silencing of cancer cell-intrinsic Cxcl1 reprograms trafficking dynamics and immunosuppressive potential of tumor-infiltrating PMN-MDSCs.
A, Experimental design of adoptive transfer experiments in which splenic neutrophils from donor mice are labeled with sulfur Cy5.5 maleimide, adoptively transferred into recipient flank tumor-bearing mice, and PMN-MDSC trafficking visualized using IVIS (left). Representative IVIS images visualizing trafficked adoptively transferred (A.T.) splenic MDSCs from KPCEV or KPC-Cxcl1KO tumor-bearing mice to subcutaneous KPCEV or KPC-Cxcl1KO tumor-bearing mice, as indicated in the legend (center), and adjacent quantification of total radiant efficiency (TRE) of trafficked Cy5.5-labeled PMN-MDSCs in each group via IVIS (n=4/group, right); B, Schematic of experimental design (left) with adjacent heatmap depicting relative fold change of Arg1, Mpo, Ido gene expressions via qPCR in Ly6G+ cells isolated from bone marrow (BM), spleen, or tumor sites in KPCEV and KPC-Cxcl1KO orthotopic tumor-bearing mice (right). Gene expression in all other groups are relative to reference expression of genes in intratumoral Ly6G+ cells from KPCEV mice; C, Representative contour plots of arginase-1 (Arg-1) expression via flow cytometry in gated F4/80Ly6GhiLy6Cdim cells from BM, spleen, or tumor sites in KPCEV and KPC-Cxcl1KO orthotopic tumor-bearing mice (left), with adjacent histogram showing arginase-1 mean fluorescence intensity (MFI) at respective sites in designated mice (n=6/group). Arg-1 expression in intratumoral PMN-MDSCs is also quantified from KPC-Cxcl1KO mice treated with anti-CD8 neutralizing antibody (CD8neuAb); D, Arginase-1 enzymatic activity via colorimetric assay in intratumoral PMN-MDSCs from KPCEV and KPC-Cxcl1KO mice (n=2–3/group); E, Heatmap depicting relative fold change of curated gene module from activated-PMN signature (22) via qPCR from RNA extracted from intratumoral Ly6G+ cells in KPCEV vs. KPC-Cxcl1KO tumors; F, Schematic of experimental design (left), with adjacent histogram showing IFN-γ release (in pg/mL) from CD3/CD28-stimulated T-cells alone, or when co-cultured (1:3 T-cell:MDSC ratio) in combination with intratumoral PMN-MDSCs from KPCEV and/or KPC-Cxcl1KO tumor-bearing mice (n=4/group).
Figure 5.
Figure 5.. Neutrophil-intrinsic TNF is a central regulator of MDSC function via Cxcl1-CXCR2-MAPK signaling.
A, Schematic of intratumoral-PMN-MDSC isolation and subsequent RNA-sequencing from KPCEV and KPC-Cxcl1KO orthotopic tumors 3-weeks post-injection (left). Bubble plot depicts strongest differentially upregulated signaling pathways (using KEGG and Reactome knowledgebases) in PMN-MDSC infiltrating KPCEV relative to KPC-Cxcl1KO tumors (right), with adjusted P-value indicated in legend; B, Histogram representing top 10 predicted upstream regulators of MDSC function comparing KPCEV vs. KPC-Cxcl1KO-derived PMN-MDSCs via Ingenuity Pathway Analysis (IPA), with -log(P-value) indicated on x-axis; C, Volcano plot showing all genes from curated MAPK signaling pathways (using KEGG database) relatively enriched in MDSC-KPCEV vs. MDSC-KPC-Cxcl1KO tumors, with Tnf highlighted. Data are plotted as log(Fold Change) against -Log10P-value; D, Putative mechanism of CXCR2-MAPK-TNF signaling cascade in PMN-MDSCs (top), with heatmap visualizing relative reduction in Tnf expression upon treatment of J774M PMN-MDSCs with CXCR2 inhibitor AZD5069 (1 μM), IKK inhibitor BAY-110782 (0.1 μM), MAP3K8 inhibitor #871307–18-5 (250 nM), and MEK inhibitor trametinib (250 nM) (bottom), with relative fold change indicated in legend; E, In vivo dosing scheme of trametinib treatment in orthotopic KPC mice (top), with violin plot and representative histogram plot from flow cytometry experiments showing TNF mean fluorescence intensity (MFI) in intratumoral CXCR2+ PMN-MDSCs compared between vehicle and MEKi-treated groups (n=5/group); F, Dot plot showing relative TNF gene expression across cell clusters in single-cell RNA sequencing data from human PDAC patients (n=16)(15), PKT genetically engineered mouse model (GEMM) (16), and KPC GEMM (29); G, Plot and adjacent histogram plots showing TNF mean fluorescence intensity (MFI) via flow cytometry in peripheral blood mononuclear cells (PBMC) retrieved from treatment-naïve PDAC patients at UMiami (n=57); H, Bubble plot highlighting top 5 downregulated oncogenic signaling pathways (KEGG) in KPC-Cxcl1KO compared with KPCEV whole-tumor transcriptomes, with TNF signaling bolded; I, Violin plots showing TNF levels (in pg/mL) using ELISA in whole tumor lysates from KPCEV vs. KPC-Cxcl1KO (left), and vehicle-treated or CXCR2i AZD5069-treated orthotopic KPC mice (right) (n=5/group); J, Immunofluorescence using confocal microscopy showing Ly6G (red) and TNF (green) expression in polylysine coated cover slip-mounted intratumoral Ly6G+ cells from KPCEV, KPC-Cxcl1KO, KPCEV vehicle-treated, and KPCEV CXCR2i-treated tumor-bearing orthotopic mice.
Figure 6.
Figure 6.. PMN-MDSC-derived TNF sustains innate immunoregulatory and tolerogenic circuitry in the pancreatic tumor microenvironment.
A-B, Experimental design of ex vivo co-cultures of intratumoral PMN-MDSCs with KPC tumor cells or KPC cancer-associated fibroblasts (CAF) (left). Histograms depicting relative Cxcl1 expression in KPC tumor cells (A) or KPC CAFs (B) alone, or co-cultured with PMN-MDSCs with or without preconditioning with CXCR2 inhibitor AZD5069 (1 μM), TNFR2 inhibitor etanercept (20 μg/ml), or soluble TNF inhibitor infliximab (sTNFi; 20 μg/ml) (right, n=4/group); C, In vivo dosing scheme of etanercept in orthotopic KPC mice (top), with bar plot showing Cxcl1 production (in pg/mL) by ELISA in whole tumor lysates from vehicle or etanercept (ETA)-treated mice; D, H&E and Cxcl1 immunostaining in matched tumor sections from vehicle or ETA-treated mice (both 20X; scale bar=50μm), with inset showing magnified region depicting epithelial-specific staining pattern. Adjacent bar plot shows quantification of %area Cxcl1 staining across biologic replicates (n=5 mice/group, 1 ROI/mouse); E, In single cell RNA-sequencing dataset from PKT genetically engineered mice (15), Circos plot visualizing directionality of TNF signaling pathway network from donor PMN-MDSC cluster to various cellular clusters (top), with adjoining Circos plot showing top donor ligands from PMN-MDSC (TNF highlighted in purple box) predicted to induce pro-inflammatory signaling genes/pathways (CXCL highlighted) in recipient tumor cell and CAF clusters; F, Representative contour plots and adjacent violin plots from flow cytometry experiments showing proportions (%of CD45+CD11b+) of PMN-MDSC and (%of CD45+CD11b+F4/80+) M2-like macrophages infiltrating vehicle or etanercept-treated KPC tumors (n=9–10 mice/group); G, Experimental schematic (top), with representative contour plots showing proportion of intratumoral IFN-γ+ CD3+ T-cells, and adjacent bar plot showing quantification of IFN-γ mean fluorescence intensity (MFI) within TCR-β+ T-cells across biologic replicates in vehicle- and etanercept-treated orthotopic KPC mice (n=10 mice/group).
Figure 7.
Figure 7.. Systemic inhibition of TNFR2 mitigates stromal inflammation and sensitizes PDAC to chemotherapy.
A, Experimental design of ex vivo co-cultures of intratumoral PMN-MDSCs with KPC cancer-associated fibroblasts (CAF) (left), with histograms depicting relative fold change of Il6 gene expression via qPCR in KPC CAFs alone, or CAFs co-cultured with PMN-MDSC with or without preconditioning with CXCR2i AZD5069 (1 μM), TNFR2i etanercept (20 μg/ml), or soluble TNF inhibitor infliximab (sTNFi; 20 μg/ml) (n=4/group); B, In vivo dosing scheme of etanercept in orthotopic KPC mice (top), with bar plot showing Il6 transcription (left) or protein levels by ELISA in whole tumor lysates from vehicle (VEH) or etanercept (ETA)-treated mice (n=6–8 mice/group); C, Representative contour plots showing inflammatory CAF (iCAF; Ly6C+MHC-II), myofibroblastic CAF (myCAF; Ly6CMHC-II) and antigen-presenting CAF (apCAF; Ly6CMHC-II+) populations gated on CD45CD31PDPN+ cells via flow cytometry in vehicle and etanercept-treated mice, and adjacent bar plot visualizing iCAF/myCAF ratio quantification across biologic replicates (n=6 mice/group); D, Representative H&E showing stromal-tumor ratio via H&E, Alcian Blue, Trichrome, and Sirius Red staining in tumor sections from vehicle or ETA-treated mice (scale bar=50μm), with adjacent bar plot visualizing respective quantifications across biologic replicates (n=5 mice/group, 1 ROI/mouse); E, Experimental design showing MDSC:CAF co-culture groups—labeled 1 through 4—from which conditioned media was generated and incubated with KPC6694c2 tumor cells (top). Bar plot showing IL-6 secretion via ELISA in KPC CAFs from experimental conditions 1–4 (bottom left, n=3). Western blot for pStat3 (tyr-705), total Stat3, and β-actin protein levels in KPC6694c2 tumor cell lysates upon conditioning with media from co-culture groups 1–4 (bottom center), with adjacent bar plot showing respective quantification of pStat3/β-actin ratio (bottom right); F, pSTAT3 immunostaining in tumor sections from vehicle or ETA-treated mice (both 20x; scale bar=50μm), with inset showing magnified region depicting epithelial-specific staining pattern. Adjacent bar plot shows quantification of %area staining for pSTAT3 across biologic replicates (n=5 mice/group); G, Enrichment plot (left) and net plot (right) showing disproportionate downregulation of KEGG_JAK_STAT_SIGNALING_PATHWAY in KPC-Cxcl1KO compared with KPCEV tumor transcriptomes; H, In vivo treatment schedules (top), and Kaplan-Meier survival curves for each of the treatment groups (n=10 mice/group): vehicle, etanercept (Eta) alone, gemcitabine+paclitaxel (Gem-Pac) alone, and Eta+Gem-Pac. Median survival (MS) of each group is indicated in parentheses.

Comment in

References

    1. Kleeff J, Korc M, Apte M, La Vecchia C, Johnson CD, Biankin AV, et al. Pancreatic cancer. Nat Rev Dis Primers 2016;2:16022 doi 10.1038/nrdp.2016.22. - DOI - PubMed
    1. Yu S, Zhang C, Xie KP. Therapeutic resistance of pancreatic cancer: Roadmap to its reversal. Biochim Biophys Acta Rev Cancer 2021;1875(1):188461 doi 10.1016/j.bbcan.2020.188461. - DOI - PubMed
    1. Maddalena M, Mallel G, Nataraj NB, Shreberk-Shaked M, Hassin O, Mukherjee S, et al. TP53 missense mutations in PDAC are associated with enhanced fibrosis and an immunosuppressive microenvironment. Proc Natl Acad Sci U S A 2021;118(23) doi 10.1073/pnas.2025631118. - DOI - PMC - PubMed
    1. Trovato R, Fiore A, Sartori S, Cane S, Giugno R, Cascione L, et al. Immunosuppression by monocytic myeloid-derived suppressor cells in patients with pancreatic ductal carcinoma is orchestrated by STAT3. J Immunother Cancer 2019;7(1):255 doi 10.1186/s40425-019-0734-6. - DOI - PMC - PubMed
    1. Banerjee K, Kumar S, Ross KA, Gautam S, Poelaert B, Nasser MW, et al. Emerging trends in the immunotherapy of pancreatic cancer. Cancer Lett 2018;417:35–46 doi 10.1016/j.canlet.2017.12.012. - DOI - PMC - PubMed

Publication types

MeSH terms

Substances