. 2023 Apr 15;12(4):bio059669.
doi: 10.1242/bio.059669. Epub 2023 May 4.

Kinetics of Arf1 inactivation regulates Golgi organisation and function in non-adherent fibroblasts

Affiliations

Kinetics of Arf1 inactivation regulates Golgi organisation and function in non-adherent fibroblasts

Rajeshwari B R et al. Biol Open. .

Abstract

Arf1 belongs to the Arf family of small GTPases that localise at the Golgi and plasma membrane. Active Arf1 plays a crucial role in regulating Golgi organisation and function. In mouse fibroblasts, loss of adhesion triggers a consistent drop (∼50%) in Arf1 activation that causes the Golgi to disorganise but not fragment. In suspended cells, the trans-Golgi (GalTase) disperses more prominently than cis-Golgi (Man II), accompanied by increased active Arf1 (detected using GFP-ABD: ARHGAP10 Arf1 binding domain) associated with the cis-Golgi compartment. Re-adhesion restores Arf1 activation at the trans-Golgi as it reorganises. Arf1 activation at the Golgi is regulated by Arf1 Guanine nucleotide exchange factors (GEFs), GBF1, and BIG1/2. In non-adherent fibroblasts, the cis-medial Golgi provides a unique setting to test and understand the role GEF-mediated Arf1 activation has in regulating Golgi organisation. Labelled with Man II-GFP, non-adherent fibroblasts treated with increasing concentrations of Brefeldin-A (BFA) (which inhibits BIG1/2 and GBF1) or Golgicide A (GCA) (which inhibits GBF1 only) comparably decrease active Arf1 levels. They, however, cause a concentration-dependent increase in cis-medial Golgi fragmentation and fusion with the endoplasmic reticulum (ER). Using selected BFA and GCA concentrations, we find a change in the kinetics of Arf1 inactivation could mediate this by regulating cis-medial Golgi localisation of GBF1. On loss of adhesion, a ∼50% drop in Arf1 activation over 120 min causes the Golgi to disorganise. The kinetics of this drop, when altered by BFA or GCA treatment causes a similar decline in Arf1 activation but over 10 min. This causes the Golgi to now fragment which affects cell surface glycosylation and re-adherent cell spreading. Using non-adherent fibroblasts this study reveals the kinetics of Arf1 inactivation, with active Arf1 levels, to be vital for Golgi organisation and function.

Keywords: Adhesion; Arf1; GBF1; Golgi; Kinetics.


Conflict of interest statement

Competing interests The authors declare no competing or financial interests.

Figures
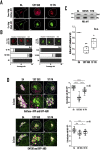
Fig. 1.
Fig. 1.
Adhesion-dependent Arf1 activation differentially regulates cis-medial- versus trans-Golgi organisation in WT-MEFs. (A) Representative de-convoluted maximum intensity projection (MIP) images of the Golgi in WT-MEFs transfected with GalTase-RFP (trans-Golgi marker) and ManII-GFP (cis-Golgi marker) when stable adherent (SA), held in suspension for 120 min (120′ SUS), and re-adherent on FN for 15 min (15′ FN). (B) The percentage distribution profile of WT-MEFs with disorganised (clear), partially disorganised (grey), and intact (black) cis-medial Golgi (ManII-GFP) and trans-Golgi (GalTase-RFP) was calculated. The graph represents their mean±standard error (SE) of percentage distribution in SA, 120′ SUS, and 15′FN from three independent experiments. (C) Western blot detection of active Arf1 (WB: Arf1) pulled down using GST-GGA3 (GGA3 PD) and total Arf1 in the whole-cell lysate (WCL) from SA, suspended (120′ SUS), and re-adherent (15′ FN) WT-MEFs. The box and whisker plot represents the densitometric band intensity ratio of active to total Arf1 from four independent experiments, normalised to stable adherent cells. (D) Representative de-convoluted MIP images of SA, suspended (120′ SUS), and re-adherent (15′ FN) WT-MEFs expressing GFP-ABD (shown in green) with GalTase-RFP (shown in magenta) (top panel) or immunostained with GM130 (shown in magenta) (lower panel). The box and whisker plot represents Pearson's coefficient of co-localisation for GFP-ABD with GalTase-RFP or GM130 in 34 cells from three independent experiments. Statistical analysis was using the Mann–Whitney test, *P<0.05, **P<0.001, ***P<0.0001, ****P<0.00001, or with normalised data using single sample t-test, *P<0.05, **P<0.001, ***P<0.0001, ****P<0.00001.
Fig. 2.
Fig. 2.
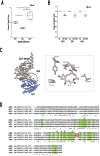
Arf1-GEFs expression in WT-MEFs. (A) Arf GEF expression profile in stable adherent WT-MEFs detected by RT-PCR shows BIG1 to be better expressed (lower Δ Ct values) than GBF1 and BIG2. The box and whisker plot represents the Δ Ct values relative to actin from four independent reactions. Statistical analysis of normalised data was done using the single-sample t-test (*P<0.05). (B) Arf GEF expression profile in WT-MEFs detected by RT-PCR compares the expression of GBF1, BIG1, BIG2 in SA and suspended (120′ SUS) cells. The box and whisker plot represents the Δ Ct values for each GEF in 120′ SUS cells relative to SA cells relative to respective Δ Ct values of actin from four independent reactions. All data were analysed using the single sample t-Test, and P values are as indicated (* P<0.05). (C) Ribbon representation of the Arf-GEF Sec7 domain in complex with BFA. Only the BIG1 Sec7-BFA-Arf1 complex is represented here. The sec7 domain of BIG1 is in blue ribbons, and Arf1 is represented in grey ribbons. The BFA sandwiched between the Arf1 and GEF is shown in a ball and stick representation. The inset shows the residues marked by blue arrows in Fig. 2D represented as sticks interacting with BFA (in a ball and stick representation). The inset was rendered using UCSF Chimera (Pettersen et al., 2004). (D) Multiple sequence alignment of the sec7 domains of the mouse BIG1, BIG2, GBF1, and human ARNO as constructed by Clustal Omega. The amino acids highlighted in green interact with Arf1 (within 4.0 Å) in the homology models. The residue positions marked with blue arrows are the residues making contact (within 4.0 Å) with BFA in these models. The red box marks the QNA residues unique to GBF1 and responsible for its specific interactions with GCA (Sáenz et al., 2009).
Fig. 3.
Fig. 3.
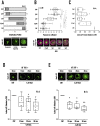
Concentration-dependent BFA treatment of suspended WT-MEFs. (A) WT-MEFs expressing cis-medial Golgi (ManII-GFP) marker were held in suspension for 60 min and treated for 30 min without (CNT) or with increasing concentrations of BFA (0.7 µM, 1.8 µM, 3.6 µM, 17.8 µM). The distribution of cells with disorganised (clear), partially fragmented (dark grey), and fragmented (grey) Golgi were manually counted, and the graph represents their mean±SE of percentage distribution from three independent experiments. Selected representative images for each phenotype are presented below the graph. (B) The box and whisker plot represent the Pearson's coefficient of co-localisation for cis-Golgi (ManII-GFP) and ER (ss-KDEL-RFP) in WT-MEFs suspended for 60 min and treated for 30 min without (CNT) or with BFA (0.7 µM, 1.8 µM, 3.6 µM, 17.8 µM), 30 cells from three independent experiments. Selected representative images for the prominent phenotype of each BFA concentration are presented below the graph, ManII-GFP is shown in green, and ss-KDEL-RFP is shown in magenta. (C) Western-blot detection of active Arf1 pulled down using GST-GGA3 and equated to total Arf1 in whole-cell lysate from WT-MEFs in suspension for 60 min and treated for 30 min without CNT or with BFA (0.7 µM, 1.8 µM, 3.6 µM, or 17.8 µM). The box and whisker plot represents the densitometric band intensity ratio of active to total Arf1 normalised to respective control (CNT) from three independent experiments. (D,E) Representative images of cis-medial Golgi (ManII-GFP) phenotype in cells held in suspension for 60 min (60′ SUS+), treated without (CNT) or with (D) low BFA (0.7 µM) or (E) high BFA (17.8 µM) for 10 min, 20 min, and 30 min, respectively. The box and whisker plot represents the densitometric band intensity ratio of active to total Arf1 normalised to respective control (CNT) from three to six independent experiments. Statistical analysis was done using the Mann–Whitney test, *P<0.05, **P<0.001, ***P<0.0001, ****P<0.00001, or with normalised data using single sample t-test, *P<0.05, **P<0.001, ***P<0.0001, ****P<0.00001.
Fig. 4.
Fig. 4.
Concentration-dependent GCA treatment of suspended WT-MEFs. (A) WT-MEFs expressing cis-medial Golgi (ManII-GFP) marker were held in suspension for 60 min treated for 30 min without (CNT) or with increasing concentrations of GCA (0.5 µM, 1 µM, 2 µM, 3 µM). The distribution of cells with disorganised (clear), partially fragmented (dark grey), and fragmented (grey) Golgi were manually counted, and the graph represents their mean±SE of percentage distribution from three independent experiments. Selected representative images are presented below the graph. (B) The box and whisker plot represent the Pearson's coefficient of co-localisation for cis-medial Golgi (ManII-GFP) and ER (ss-KDEL-RFP) in WT-MEFs suspended for 60 min and treated for 30 min without (CNT) or with GCA (0.5 µM, 1 µM, 2 µM, 3 µM), 30 cells from three independent experiments. Selected representative images for the prominent phenotype of each GCA concentration are presented below the graph, ManII-GFP is shown in green, and ss-KDEL-RFP is shown in magenta. (C) Western-blot detection of active Arf1 pulled down using GST-GGA3 and equated to total Arf1 in whole-cell lysate from WT-MEFs suspended for 60 min and treated for 30 min without (CNT) or with GCA (0.5 µM, 1 µM, 2 µM, 3 µM). The box and whisker plot represents the densitometric band intensity ratio of active to total Arf1 normalised to respective control (CNT) from three independent experiments. (D,E) Representative images of cis-medial Golgi (ManII-GFP) phenotype in cells held in suspension for 60 min (60′ SUS+), treated without (CNT) or with (D) low GCA (1 µM) or (E) high GCA (3 µM) for 10 min, 20 min, and 30 min. The box and whisker plot represents the densitometric band intensity ratio of active to total Arf1 from five or six independent experiments. Statistical analysis was using the Mann–Whitney test, *P<0.05, **P<0.001, ***P<0.0001, ****P<0.00001, or normalised data using single sample t-test, *P<0.05, **P<0.001, ***P<0.0001, ****P<0.00001.
Fig. 5.
Fig. 5.
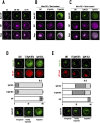
Localisation of GBF1 and ManII-GFP labelled Golgi in WT-MEFs. (A) Representative immunostained images of GBF1 in ManII-GFP expressing WT-MEFs, SA, suspended (120′ SUS), and re-adherent on fibronectin (15′ FN). (B,C) ManII-GFP expressing WT-MEFs (CNT) suspended for 60 min and treated with (B) 0.7 µM BFA or 17.8 µM BFA for 30 min (60′ SUS+30 min treatment) or (C) 1 µM GCA or 3 µM GCA for 30 min (60′ SUS+30 min treatment) and immunostained with GBF1. Representative ManII-GFP, GBF1, and merged images are shown. (D,E) WT-MEFs expressing (D) WT-Arf1-mCherry or (E) Q71L-Arf1-mCherry held in suspension for 60 min and treated with 17.8 µM BFA or 3 µM GCA for30 min (60′ SUS+30 min treatment). The upper panel shows representative images of the predominant Golgi phenotype (ManII-GFP) in (D) WT-Arf1-mCherry or (E) Q71L-Arf1-mCherry expressing cells. The graph shows the percentage distribution of cells with disorganised (clear), partially fragmented (dark grey), and fragmented (grey) Golgi, represented as their mean±SE from three independent experiments. Selected representative images for each Golgi phenotype (ManII-GFP) are presented below the graph.
Fig. 6.
Fig. 6.
Kinetics of Arf1 inactivation on the loss of adhesion in WT-MEFs. Western-blot detection of active Arf1 (WB: Arf1) pulled down using GST-GGA3 (GGA3 PD) and total Arf1 in the whole-cell lysate (WCL) from WT-MEFs, (A) detached and held in suspension for increasing time (10′, 30′, 60′, 90′, 120′ SUS) relative to SA cells or (B,C) cells suspended and treated for 10 min in suspension, with (B) BFA 1.8 µM, 3.6 µM and 17.8 µM, or (C) GCA 0.5 µM, 1 µM, and 3 µM relative to respective stable adherent control cells (CNT, untreated). The box and whisker plot represents the densitometric band intensity ratio of active to total Arf1 normalised to respective control (CNT) from three independent experiments. (D) Representative cross-section images of cis-Golgi (ManII-GFP) phenotype in WT-MEFs, SA, suspended for 10 min (10′ SUS), 120 min (120′ SUS), or suspended for 10 min (10′ SUSP) with 0.5 µM GCA and 3.6 µM BFA. (E) WT-MEFs held in suspension for 10 min (SUS 10′), without (CNT), or with 3.6 µM BFA or 0.5 µM GCA was surface labelled with ConA-Alexa-488. The graph represents the median surface-bound ConA fluorescence normalised to CNT from three independent experiments. Representative images are shown above the graph. (F) WT-MEFs held in suspension for 10 min (SUS 10′), without (CNT), or with 3.6 µM BFA, or 0.5 µM GCA or in suspension for 120 min, were replated on fibronectin for 15 min (FN15′) and cell spreading was evaluated by phalloidin staining. The box and whisker plot represents six independent experiments’ mean cell-spread area. Representative images are shown above their respective graph. Statistical analysis was using the Mann–Whitney test, *P<0.05, **P<0.001, ***P<0.0001, ****P<0.00001, or for normalised data using single sample t-test, *P<0.05, **P<0.001, ***P<0.0001, ****P<0.00001.

Similar articles

Cited by

References

    1. Altan-Bonnet, N., Sougrat, R., Liu, W., Snapp, E. L., Ward, T. and Lippincott-Schwartz, J. (2006). Golgi inheritance in mammalian cells is mediated through endoplasmic reticulum export activities. Mol. Biol. Cell 17, 990-1005. 10.1091/mbc.e05-02-0155 - DOI - PMC - PubMed
    1. Alvarez, C., Garcia-Mata, R., Brandon, E. and Sztul, E. (2003). COPI recruitment is modulated by a Rab1b-dependent mechanism. Mol. Biol. Cell 14, 2116-2127. 10.1091/mbc.e02-09-0625 - DOI - PMC - PubMed
    1. Bannykh, S. I., Plutner, H., Matteson, J. and Balch, W. E. (2005). The role of ARF1 and Rab GTPases in polarisation of the Golgi stack. Traffic 6, 803-819. 10.1111/j.1600-0854.2005.00319.x - DOI - PubMed
    1. Boal, F. and Stephens, D. J. (2010). Specific functions of BIG1 and BIG2 in endomembrane organization. PLoS One 5, e9898. 10.1371/journal.pone.0009898 - DOI - PMC - PubMed
    1. Boehm, M., Aguilar, R. C. and Bonifacino, J. S. (2001). Functional and physical interactions of the adaptor protein complex AP-4 with ADP-ribosylation factors (ARFs). EMBO J. 20, 6265-6276. 10.1093/emboj/20.22.6265 - DOI - PMC - PubMed

Publication types

MeSH terms

Substances