. 2023 Jun 5;220(6):e20222129.
doi: 10.1084/jem.20222129. Epub 2023 Mar 22.

CCL5-producing migratory dendritic cells guide CCR5+ monocytes into the draining lymph nodes

Affiliations

CCL5-producing migratory dendritic cells guide CCR5+ monocytes into the draining lymph nodes

Kavita Rawat et al. J Exp Med. .

Abstract

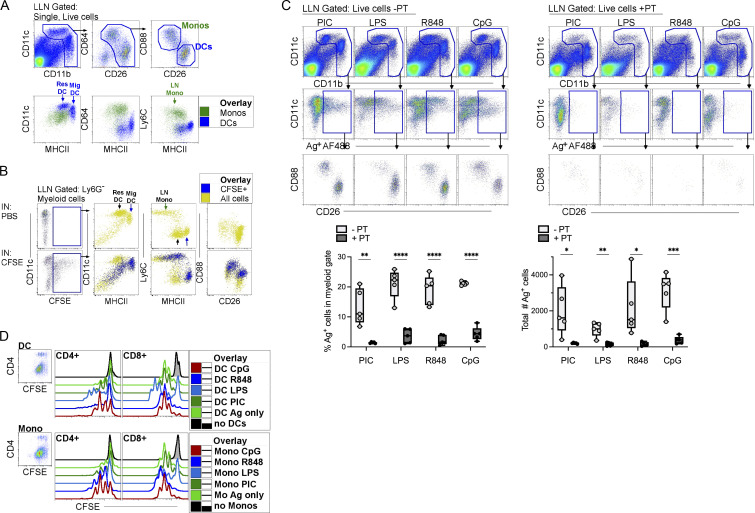
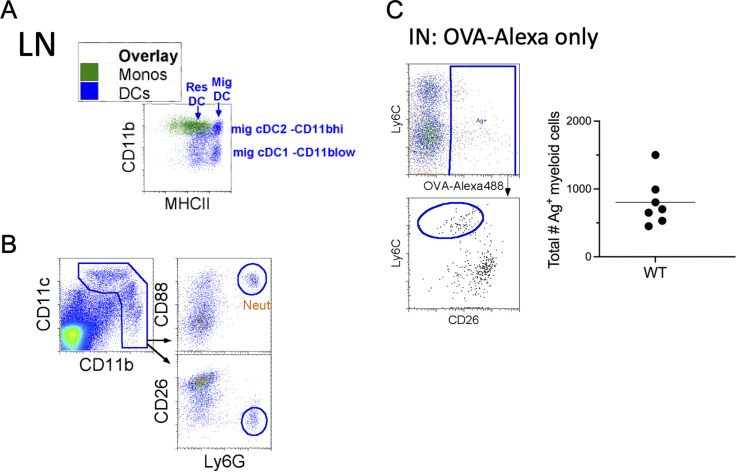
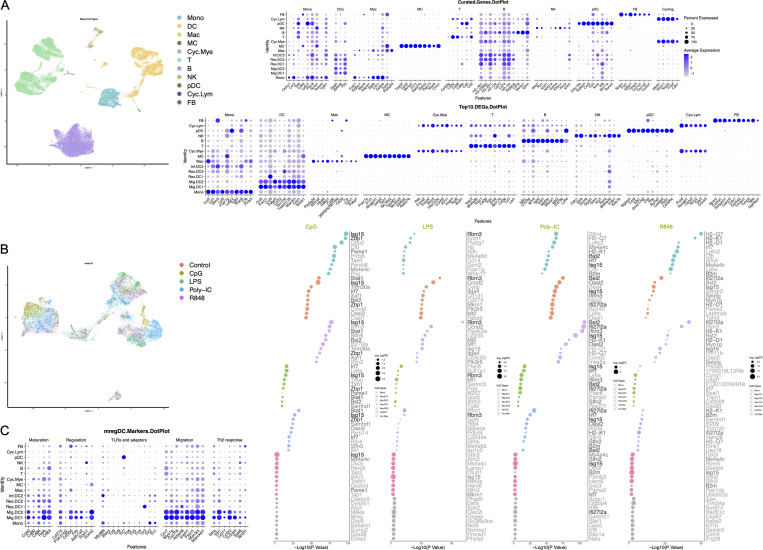
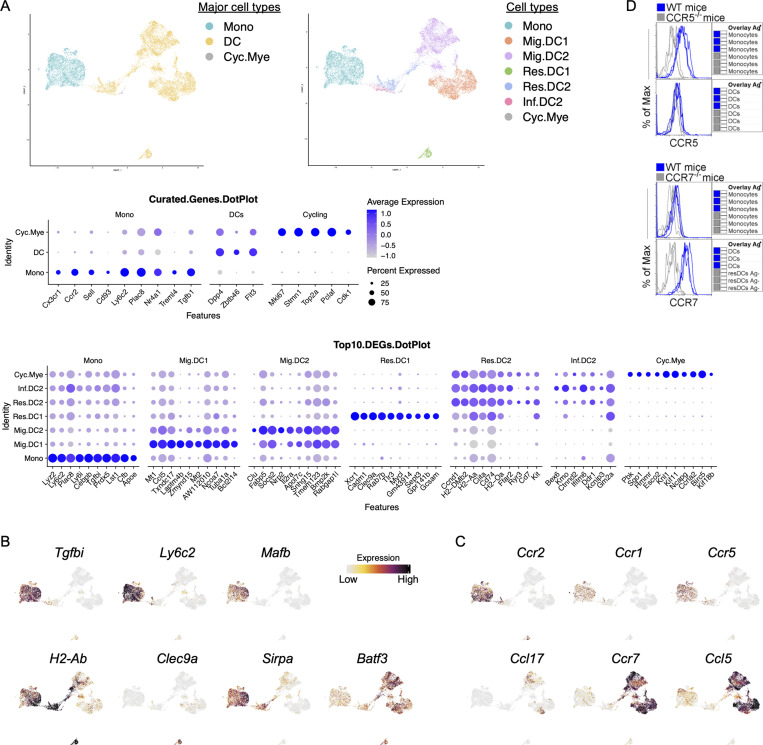
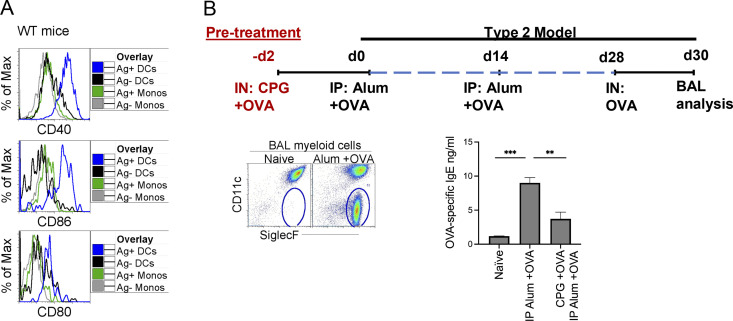
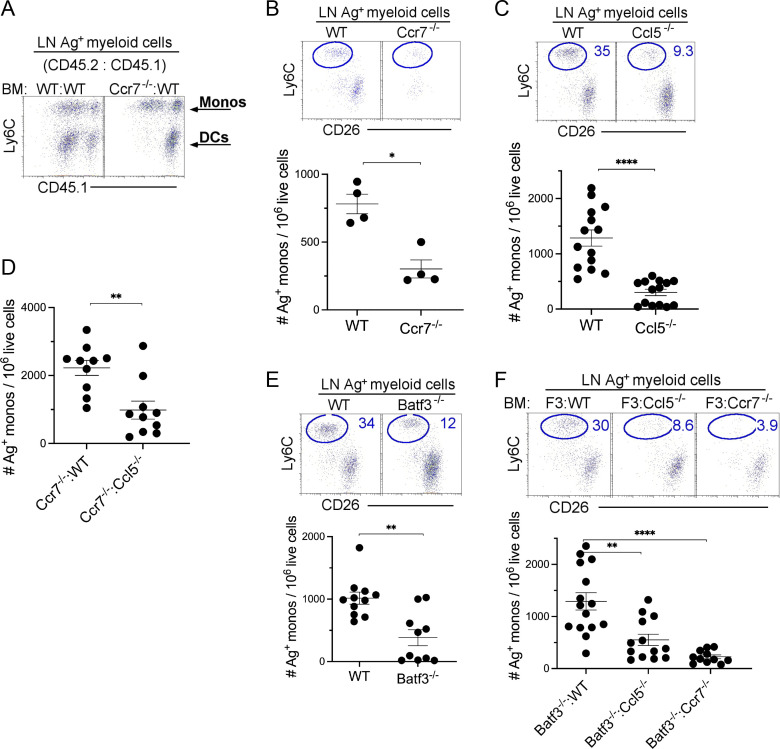
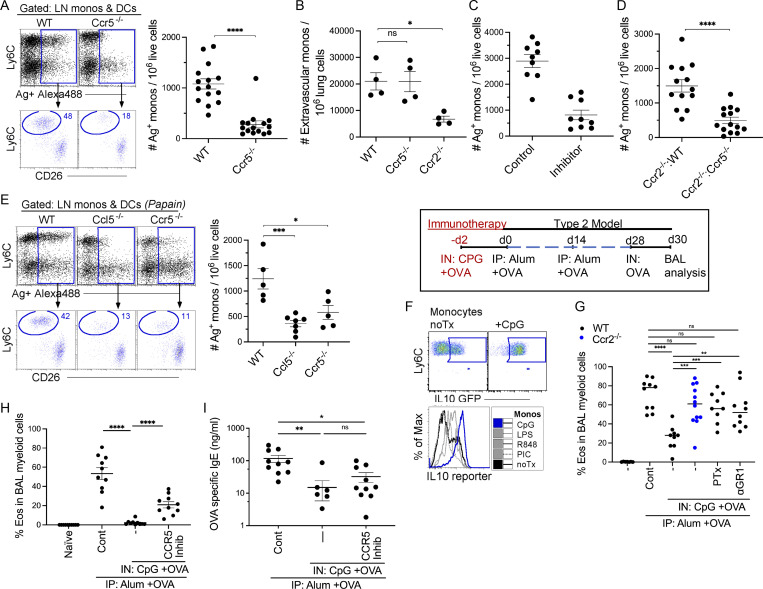
Dendritic cells (DCs) and monocytes capture, transport, and present antigen to cognate T cells in the draining lymph nodes (LNs) in a CCR7-dependent manner. Since only migratory DCs express this chemokine receptor, it is unclear how monocytes reach the LN. In steady-state and following inhalation of several PAMPs, scRNA-seq identified LN mononuclear phagocytes as monocytes, resident, or migratory type 1 and type 2 conventional (c)DCs, despite the downregulation of Xcr1, Clec9a, H2-Ab1, Sirpa, and Clec10a transcripts on migratory cDCs. Migratory cDCs, however, upregulated Ccr7, Ccl17, Ccl22, and Ccl5. Migratory monocytes expressed Ccr5, a high-affinity receptor for Ccl5. Using two tracking methods, we observed that both CD88hiCD26lomonocytes and CD88-CD26hi cDCs captured inhaled antigens in the lung and migrated to LNs. Antigen exposure in mixed-chimeric Ccl5-, Ccr2-, Ccr5-, Ccr7-, and Batf3-deficient mice demonstrated that while antigen-bearing DCs use CCR7 to reach the LN, monocytes use CCR5 to follow CCL5-secreting migratory cDCs into the LN, where they regulate DC-mediated immunity.


Conflict of interest statement

Disclosures: The authors declare no competing interests exist.

Figures

Figure 1.
Figure 1.
CD88+ monocytes capture antigen in the periphery, transport, and present the antigen to cognate T cells in the LLNs. (A) Top row: WT naive LLN were plotted as CD11c and CD11b to gate on myeloid cells. CD88+ neutrophils were excluded as CD64CD26cells by plotting myeloid cells as CD64 vs. CD26. LN mononuclear phagocytes were then plotted as CD88 vs. CD26 to identify CD88+CD26lo monocytes and CD88CD26hi DCs. Bottom row: Overlay of monocytes (green) and DCs (blue) to illustrate the intensity of expression of CD11c, MHCII, CD64, and Ly6C on monocytes, resident DCs, and migratory DCs. Data shown are representative of three independent experiments; n = 3–5. (B) LLN 24 h after i.n. delivery of CFSE or PBS. Top row: Control mice given PBS (no CFSE). Bottom row: Mice given CFSE. Left gate is CFSE+ myeloid cells. Bottom row: Overlay of CFSE+ migratory cells (blue) and all myeloid cells (yellow) illustrating that only migratory cDCs (MHCII high) migrate and not resident DCs (MHCII low). Data represent two independent experiments; n = 5. (C) LLN 24 h after i.n. delivery of OVA-AF488, a TLR agonist ± pertussis toxin (PT; no PT, left plots; with PT, right plots). Top row: Flow plots illustrate the myeloid gate, followed by (middle row) gated Ag+ myeloid cells, which were plotted as CD88 vs. CD26 to identify Ag+ monocytes and DCs (bottom row). Bar graphs compile the frequency and the total number of Ag+ myeloid cells in the LLNs; n = 4–5 mice per group. Data represent two independent experiments. (D) LLN Ag+ monocytes and cDCs were sorted 24 h after i.n. delivery with OVA-AF488 and a TLR agonist. Representative histograms show in vitro proliferation of CFSE-labeled antigen-specific CD8+ OTI and CD4+ OTII T cells. Data are representative of three independent experiments. *P < 0.05, **P < 0.01, ***P < 0.001, and ****P < 0.0001, mean ± SEM. One-way ordinary ANOVA, with post hoc Tukey’s multiple comparison test (C).
Figure S1.
Figure S1.
Neutrophil exclusion and monocyte migration with OVA-AF488 without TLR adjuvants in the LLN. (A) Overlay of LN monocytes and DCs, plotted as CD11b vs. MHCII. (B) Excluding CD88+ neutrophils from gated myeloid cells. (C) i.n. (IN) delivery of OVA-AF488 into WT mice, LLN harvested 24 h after instillation. Total Ag+ myeloid cells were assessed.
Figure S2.
Figure S2.
scRNA-seq of hashtags for PBS and TLR ligand stimulated mononuclear phagocytes in the LLN. (A) UMAP demonstrating the distribution of all cells acquired on the 10X from the five different TLR adjuvant treatment groups: no treatment control (Control), CpG, LPS, Poly-IC, R848. Dot chart shows curated genes and the top 10 DEGs for the entire dataset. (B) Re-clustering identified mononuclear phagocytes, UMAP demonstrating the distribution of cells from the five different TLR adjuvant treatment groups: no treatment control (Control), CpG, LPS, Poly-IC, R848. Dot chart shows the top 10 DEGs in samples with each treatment group compared with no treatment control for the seven specific myeloid cell types. UMAP annotations and platform for self-analysis: https://cells.ucsc.edu/?ds=ln-mono-dc. (C) Dot chart shows mregDC marker genes across defined clusters. MC, mast cells; Mono, monocytes; Cyc.Mye, cycling myeloid cells; Cyc.Lym., cyclin lymphocytes; FB, fibroblasts; NK, natural killer; pDC, plasmacytoid DC.
Figure 2.
Figure 2.
scRNA-seq defines LN myeloid cell types with a potential internal Ccl5-Ccr5/Ccr1 axis interaction. (A) Left: UMAP demonstrates the three major myeloid cell types: monocytes (Mono), DCs, and cycling myeloid cells (Cyc.Mye). Right: UMAP demonstrates seven distinct myeloid cell types: monocytes (Mono), migratory cDC1 (Mig.DC1), migratory cDC2 (Mig.DC2), resident cDC1 (Res.DC1), resident cDC2 (Res.DC2), inflammatory cDC2 (Inf.DC2), and cycling myeloid cells (Cyc.Mye). Middle: Dot plot shows the expression of curated genes in each individual major myeloid cell type. Bottom: Dot plot shows the top 10 DEGs in each individual myeloid cell type. (B) Feature plots show the expression of genes of interest including monocyte-defining Tgfbi, Ly6c2, and Mafb; and cDC-defining H2-Ab, Clec9a, Sipra, and Batf3. (C) Feature plots show the expression of genes of interest: chemokines Ccr2, Ccr1, Ccr5, Ccl17, Ccr7, and Ccl5. UMAP annotations: https://cells.ucsc.edu/?ds=ln-mono-dc. (D) Histograms illustrate the expression of CCR5 on monocytes (top) and CCR7 on migratory DCs (bottom). Each line represents biological replicates from three independent experiments.
Figure S3.
Figure S3.
Alum OVA model and CpG immunotherapy. (A) 24 h after instillation of 20 μg of CpG and 3 μg OVA-AF488, LLNs were harvested and analyzed. Histograms illustrate expression of costimulatory molecules (CD40, CD80, and CD86) on Ag+ monocytes and migratory DCs in the LLN. (B) Alum OVA model. Flow plots illustrate gating strategy for eosinophils in the BAL. Graph bar, OVA-specific IgE production after alum OVA ± pretreatment with CpG and OVA. **P < 0.01, ***P < 0.001, mean ± SEM, one-way ordinary ANOVA, with post hoc Tukey’s multiple comparison test (B).
Figure 3.
Figure 3.
Monocyte migration via afferent lymphatics is attenuated in the absence of CCL5-secreting migratory cDC1s. 24 h after the instillation of 20 μg of CpG and 3 μg OVA-AF488, LLNs were harvested and analyzed. (A) Flow plots illustrate the Ag+ monocytes and DC migration in the LLN derived from (1:1) BM chimera mice: WT CD45.2:WT CD45.1 and Ccr7−/− CD45.2:WT CD45.1 mice. (B) Representative flow plot with scatter plot showing the total number of Ag+ monocytes in WT and Ccr7−/− mice with scatter plot showing the total number of Ag+ monocytes. Data are representative of two independent experiments; n = 4 per group. (C) Representative flow plot with scatter plot showing the total number of Ag+ monocytes in WT and Ccl5−/− mice with scatter plot showing the total number of Ag+ monocytes. Data combine three independent experiments; n = 4–5 per group. (D) Scatter plot showing the total number of Ag+ monocytes in Ccr7−/−: WT CD45.1 and Ccr7−/−: Ccl5−/− (1:1) BM chimera mice. Data combine two independent experiments with four to five mice per group. (E) Representative flow plot with scatter plot showing the total number of Ag+ monocytes in WT and Batf3−/− mice with scatter plot showing the total number of Ag+ monocytes. Data combine two independent experiments with five mice per group. (F) Representative flow plot with scatter plot showing the total number of Ag+ monocytes in Batf3−/−:WT, Batf3−/−:Ccl5−/−, and Batf3−/−:Ccr7−/− BM chimera mice. Each dot represents one mouse. *P < 0.05, **P < 0.01, ****P < 0.0001, mean ± SEM, a two-tailed t test (B–E) and one-way ordinary ANOVA, with post hoc Tukey’s multiple comparison test (F).
Figure 4.
Figure 4.
Monocyte migration to draining LNs depends on CCR5 expression. (A) 24 h after instillation of 20 μg of CpG and 3 μg OVA-AF488, LLNs were harvested and analyzed in WT and Ccr5−/− mice. Flow plots, myeloid cells plotted as Ly6C vs. OVA+AF488+ to gate on Ag+ monocytes and DCs with scatter plot showing the total number of Ag+ monocytes in WT and Ccr5−/− mice. Data combine two independent experiments; n = 4–5 per group. (B) WT, Ccr5−/−, and Ccr2−/− mice were analyzed for extravascular monocyte migration into the lungs after immunization. Data represent two independent experiments. Each dot represents one mouse. (C) WT mice were treated with 20 μg Maraviroc (CCR5 inhibitor) 4 h prior to i.n. delivery with 20 μg of CpG and 3 μg OVA-AF488. Scatter plot displays the number of Ag+ monocytes in the LLN. Data combine two independent experiments with four to five mice per group. (D) Scatter plot illustrates the number of Ag+ monocytes in the LLNs of Ccr2−/−:WT and Ccr2−/−:Ccr5−/− BM chimeric mice. Data combine three independent experiments with four to five mice per group. (E) WT, Ccl5−/−, and Ccr5−/− mice were i.n. instilled with 8 μg of papain and 3 μg OVA-AF488 and harvested 24 h later. Flow plots illustrate myeloid cells plotted as Ly6C vs. OVA+AF488+ to gate on Ag+ monocytes and DCs with scatter plots showing the total number of Ag+ monocytes. Data represent two independent experiments with three to four mice per group. (F) Flow plot shows IL10 expression of LN monocytes 24 h after CpG stimulation. Histogram monocyte overlays illustrate IL10 reporter expression of monocytes stimulated with different TLR agonists. (G) Control mice received no CpG-OVA prior to sensitization with Alum + OVA and challenge with OVA. Ccr2−/− mice, WT mice with blocked APC migration (pertussis toxin [PTx]) or depleted of monocytes (anti-Gr1 antibody) during exposure to CpG-OVA, developed significantly more airway eosinophilia compared to CpG-OVA treated WT mice. Scatter plot shows the frequency of eosinophil migration into the airways. Data combine three independent experiments with three to five mice per group. (H) Scatter plot shows the frequency of eosinophil migration into the airways of WT mice treated with CpG-OVA ± CCR5 inhibitor (Maraviroc) followed by sensitization with alum + OVA and OVA challenge. Data combine two independent experiments with four to five mice per group. (I) Scatter plot illustrates the total OVA-specific IgE in the serum of the mice from experiment H. *P < 0.05, **P < 0.01, ***P < 0.001, ****P < 0.0001, mean ± SEM, a two-tailed t test (A–D), and one-way ordinary ANOVA, with post hoc Tukey’s multiple comparison test (E–I).

References

    1. Aegerter, H., Lambrecht B.N., and Jakubzick C.V.. 2022. Biology of lung macrophages in health and disease. Immunity. 55:1564–1580. 10.1016/j.immuni.2022.08.010 - DOI - PMC - PubMed
    1. Bakocević, N., Worbs T., Davalos-Misslitz A., and Förster R.. 2010. T cell-dendritic cell interaction dynamics during the induction of respiratory tolerance and immunity. J. Immunol. 184:1317–1327. 10.4049/jimmunol.0902277 - DOI - PubMed
    1. Bosteels, C., Fierens K., De Prijck S., Van Moorleghem J., Vanheerswynghels M., De Wolf C., Chalon A., Collignon C., Hammad H., Didierlaurent A.M., and Lambrecht B.N.. 2021a. CCR2- and flt3-dependent inflammatory conventional type 2 dendritic cells are necessary for the induction of adaptive immunity by the human vaccine adjuvant system AS01. Front. Immunol. 11:606805. 10.3389/fimmu.2020.606805 - DOI - PMC - PubMed
    1. Bosteels, C., Neyt K., Vanheerswynghels M., van Helden M.J., Sichien D., Debeuf N., De Prijck S., Bosteels V., Vandamme N., Martens L., et al. . 2020b. Inflammatory type 2 cDCs acquire features of cDC1s and macrophages to orchestrate immunity to respiratory virus infection. Immunity. 52:1039–1056.e9. 10.1016/j.immuni.2020.04.005 - DOI - PMC - PubMed
    1. Cabeza-Cabrerizo, M., Cardoso A., Minutti C.M., Pereira da Costa M., and Reis e Sousa C.. 2021. Dendritic cells revisited. Annu. Rev. Immunol. 39:131–166. 10.1146/annurev-immunol-061020-053707 - DOI - PubMed

Publication types