

Heterozygous OT-I mice reveal that antigen-specific CD8+ T cells shift from apoptotic to necrotic killers in the elderly
- PMID: 36947105
- PMCID: PMC10265152
- DOI: 10.1111/acel.13824
Heterozygous OT-I mice reveal that antigen-specific CD8+ T cells shift from apoptotic to necrotic killers in the elderly
Abstract
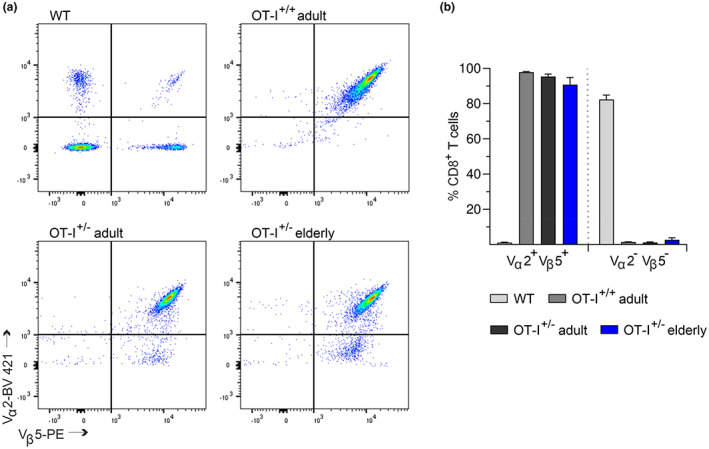
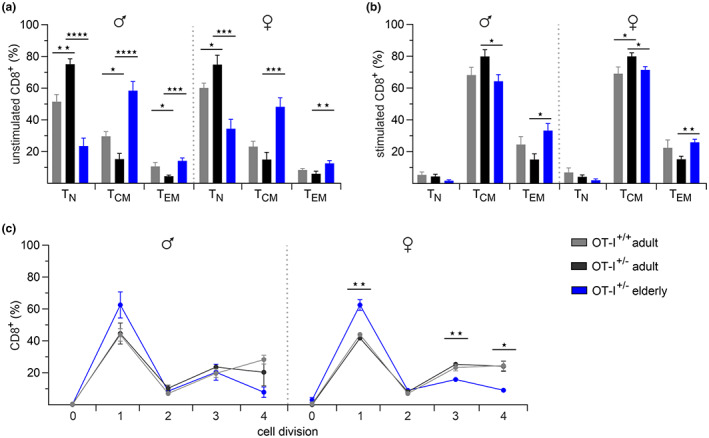
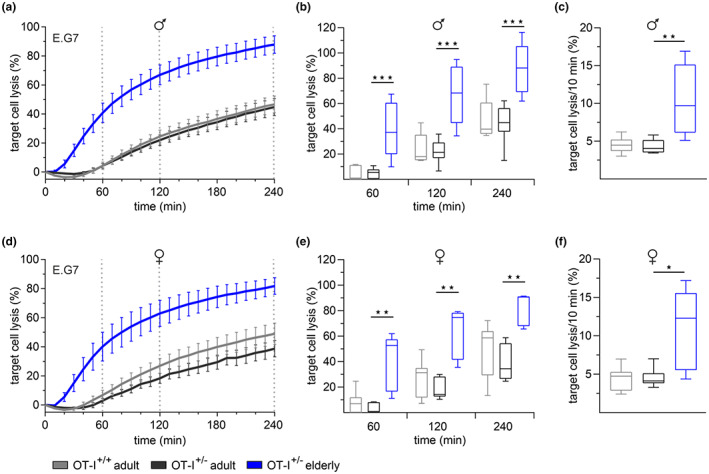
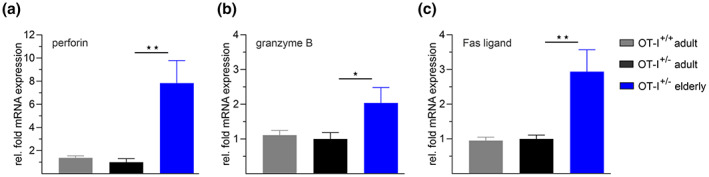
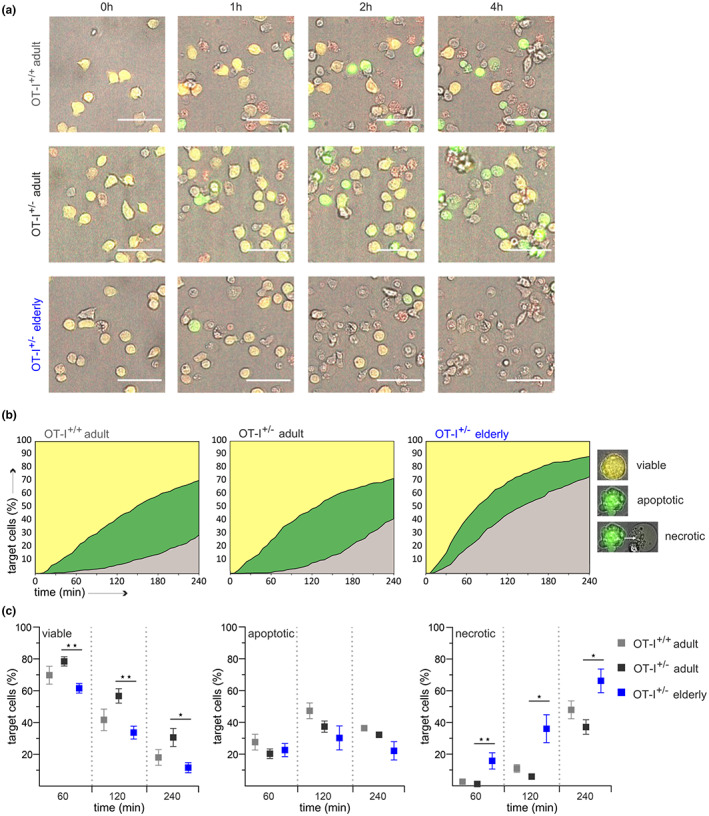
Numerous alterations in CD8+ T cells contribute to impaired immune responses in elderly individuals. However, the discrimination between cell-intrinsic dysfunctions and microenvironmental changes is challenging. TCR transgenic OT-I mice are utilized to investigate CD8+ T-cell immunity, but their immunodeficient phenotype hampers their use especially in aging. Here, we demonstrate that using a heterozygous OT-I model minimizes the current limitations and provides a valuable tool to assess antigen-specific T-cell responses even at old age. We analyzed phenotypic and functional characteristics of CD8+ T cells from OT-I+/+ and OT-I+/- mice to prove the applicability of the heterozygous system. Our data reveal that OVA-activated CD8+ T cells from adult OT-I+/- mice proliferate, differentiate, and exert cytolytic activity equally to their homozygous counterparts. Moreover, common age-related alterations in CD8+ T cells, including naive T-cell deterioration and decreased proliferative capacity, also occur in elderly OT-I+/- mice, indicating the wide range of applications for in vivo and in vitro aging studies. We used the OT-I+/- model to investigate cell-intrinsic alterations affecting the cytotoxic behavior of aged CD8+ T cells after antigen-specific in vitro activation. Time-resolved analysis of antigen-directed target cell lysis confirmed previous observations that the cytotoxic capacity of CD8+ T cells increases with age. Surprisingly, detailed single cell analysis revealed that transcriptional upregulation of perforin in aged CD8+ T cells shifts the mode of target cell death from granzyme-mediated apoptosis to rapid induction of necrosis. This unexpected capability might be beneficial or detrimental for the aging host and requires detailed evaluation.
Keywords: CD8+ T cells; OT-I; adaptive immunity; aging; apoptosis; cytotoxicity; necrosis; perforin.
© 2023 The Authors. Aging Cell published by Anatomical Society and John Wiley & Sons Ltd.
Conflict of interest statement
The authors declare that they have no competing interests.
Figures
Similar articles
-
In vitro generation of regulatory CD8+ T cells similar to those found in mice with anterior chamber-associated immune deviation.Invest Ophthalmol Vis Sci. 2000 Jun;41(7):1803-11. Invest Ophthalmol Vis Sci. 2000. PMID: 10845601
-
Maternal CD4⁺ and CD8⁺ T cell tolerance towards a fetal minor histocompatibility antigen in T cell receptor transgenic mice.Biol Reprod. 2013 Oct 31;89(4):102. doi: 10.1095/biolreprod.113.110445. Print 2013 Oct. Biol Reprod. 2013. PMID: 24025737 Free PMC article.
-
Aspergillus fumigatus extract differentially regulates antigen-specific CD4+ and CD8+ T cell responses to promote host immunity.J Leukoc Biol. 2006 Sep;80(3):529-37. doi: 10.1189/jlb.0106026. Epub 2006 Jun 22. J Leukoc Biol. 2006. PMID: 16793916
-
CD8+ T regulatory cells use a novel genetic program that includes CD103 to suppress Th1 immunity in eye-derived tolerance.Invest Ophthalmol Vis Sci. 2006 Apr;47(4):1533-42. doi: 10.1167/iovs.04-1454. Invest Ophthalmol Vis Sci. 2006. PMID: 16565389
-
The CD8 T cell response to vaccinia virus exhibits site-dependent heterogeneity of functional responses.Int Immunol. 2007 Jun;19(6):733-43. doi: 10.1093/intimm/dxm039. Epub 2007 Jun 1. Int Immunol. 2007. PMID: 17545279
Cited by
-
Characterization of the tumor microenvironment in the mouse oral cancer (MOC1) model after orthotopic implantation in the buccal mucosa.Head Neck. 2024 May;46(5):1056-1062. doi: 10.1002/hed.27722. Epub 2024 Mar 6. Head Neck. 2024. PMID: 38445546 Free PMC article.
References
-
- Aggarwal, S. , & Gupta, S. (1998). Increased apoptosis of T cell subsets in aging humans: Altered expression of Fas (CD95), Fas ligand, Bcl‐2, and Bax. Journal of Immunology, 160(4), 1627–1637 http://www.ncbi.nlm.nih.gov/pubmed/9469419 - PubMed
-
- Backes, C. S. , Friedmann, K. S. , Mang, S. , Knörck, A. , Hoth, M. , & Kummerow, C. (2018). Natural killer cells induce distinct modes of cancer cell death: Discrimination, quantification, and modulation of apoptosis, necrosis, and mixed forms. Journal of Biological Chemistry, 293(42), 16348–16363. 10.1074/jbc.RA118.004549 - DOI - PMC - PubMed
-
- Becklund, B. R. , Purton, J. F. , Ramsey, C. , Favre, S. , Vogt, T. K. , Martin, C. E. , Spasova, D. S. , Sarkisyan, G. , LeRoy, E. , Tan, J. T. , Wahlus, H. , Bondi‐Boyd, B. , Luther, S. A. , & Surh, C. D. (2016). The aged lymphoid tissue environment fails to support naïve T cell homeostasis. Scientific Reports, 6(1), 30842. 10.1038/srep30842 - DOI - PMC - PubMed
-
- Clarke, S. R. , Barnden, M. , Kurts, C. , Carbone, F. R. , Miller, J. F. , & Heath, W. R. (2000). Characterization of the ovalbumin‐specific TCR transgenic line OT‐I: MHC elements for positive and negative selection. Immunology and Cell Biology, 78(2), 110–117. 10.1046/j.1440-1711.2000.00889.x - DOI - PubMed
Publication types
MeSH terms
Substances
LinkOut - more resources
Full Text Sources
Research Materials
