. 2023 May 1;30(Pt 3):643-649.
doi: 10.1107/S1600577523001625. Epub 2023 Mar 22.

Resonant inelastic X-ray scattering endstation at the 1C beamline of Pohang Light Source II

Affiliations

Resonant inelastic X-ray scattering endstation at the 1C beamline of Pohang Light Source II

Jin Kwang Kim et al. J Synchrotron Radiat. .

Abstract

An endstation for resonant inelastic X-ray scattering (RIXS), dedicated to operations in the hard X-ray regime, has been constructed at the 1C beamline of Pohang Light Source II. At the Ir L3-edge, a total energy resolution of 34.2 meV was achieved, close to the theoretical estimation of 34.0 meV, which considers factors such as the incident energy bandpass, intrinsic analyzer resolution, geometrical broadening of the spectrometer, finite beam-size effect and Johann aberration. The performance of the RIXS instrument is demonstrated by measuring the RIXS spectra of Sr2IrO4. The endstation can be easily reconfigured to measure energy-integrated intensities with very low background for diffuse scattering and diffraction experiments.

Keywords: 1C beamline; PLS-II; RIXS spectrometer; hard X-rays; resonant inelastic X-ray scattering.


Figures

Figure 1
Figure 1
Schematic of the layout for the RIXS endstation at the 1C beamline. The beam propagates from left to right and the position of the beamline components with respect to the center of the undulator are given in meters.
Figure 2
Figure 2
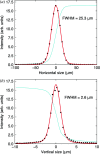
(a) Measured horizontal size of the focused beam by KB mirrors at the sample position. (b) Measured vertical size of the focused beam by KB mirrors at the sample position. The beam sizes are estimated by fitting (red curves) the derivatives (black dots) of knife-edge scans (light blue curves).
Figure 3
Figure 3
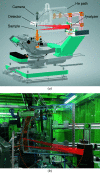
(a) Drawing of a RIXS spectrometer installed on a four-circle kappa diffractometer. A sample is mounted on the cryostat and manipulated by micro-motion stages. Scattered X-rays are reflected and focused onto the detector following the Rowland circle geometry. A flight path filled with helium gas is installed on the X-ray path to minimize air scattering. A sample camera is installed above the sample and the detector. Arrows indicate the rotations that are used to implement the chi (χ) rotation. (b) Photograph of the RIXS spectrometer installed at the 1C beamline of PLS-II.
Figure 4
Figure 4
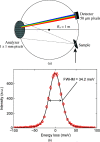
(a) Schematic of the RIXS spectrometer. The sample, analyzer and detector are placed on the Rowland circle so that the energies of the scattered X-rays can be analyzed by their position on the detector. The large arrow under the sample indicates the incident X-rays. (b) Total energy resolution of the RIXS spectrometer measured by a reference elastic scatterer, twelve layers of 3M Magic Scotch tape. The red dots are the measured points and the black curve is the fitting with a pseudo-Voigt function, which gives 34.2 meV full width at half-maximum (FWHM).
Figure 5
Figure 5
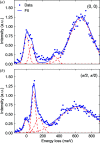
(a) RIXS spectrum of Sr2IrO4 at q = (0, 0). The peak at 40 meV corresponds to the out-of-plane magnon mode, the peak around 350 meV to spin-orbit excitons and the broad continuum around 600 meV to dd-excitations within t 2g orbitals. (b) RIXS spectrum of Sr2IrO4 at q = (π/2, π/2). The peak around 100 meV corresponds to single-magnon excitations, the broader peak around 150 meV corresponds to multimagnons and the broad continuum around 600 meV to dd-excitations within t 2g orbitals. The spectra shown in (a) and (b) are collected at 80 K over 1 h each. Gaussian functions are used to fit all the peaks, displayed as red-dashed curves. The sum of all fit functions is drawn as a blue curve.
Figure 6
Figure 6
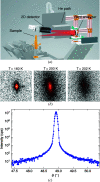
(a) Drawing of an X-ray diffuse scattering setup. This setup is a reconfiguration from the original RIXS spectrometer shown in Fig. 3 ▸(a) by incorporating a bent analyzer in place of a diced spherical analyzer. Additionally, a 2D area detector is placed before a position-sensitive detector, resulting in a slightly altered flight path with reduced dimensions. (b) Raw 2D detector images of a charge density wave (CDW) peak in TiSe2, taken at three different temperatures (T = 160, 200, 202 K) across the critical temperature T c = 200 K. The measurements were performed at the wavevector (0.5 0.5 4.5). An Si(844)-bent spherical analyzer was used with 11.215 keV incident X-rays. With this incident energy, the bent analyzer with a 10 cm diameter accepts a circular area in momentum space with a diameter of 0.3 Å−1 in a single shot which corresponds to about 0.17 r.l.u. H (or K) for TiSe2. (c) θ–2θ rocking curve measurement of the (1 0 5) charge peak of TiSe2 at room temperature.

References

    1. Ament, L. J. P., Khaliullin, G. & van den Brink, J. (2011b). Phys. Rev. B, 84, 020403.
    1. Ament, L. J. P., van Veenendaal, M., Devereaux, T. P., Hill, J. P. & van den Brink, J. (2011a). Rev. Mod. Phys. 83, 705–767.
    1. Bertinshaw, J., Kim, J. K., Porras, J., Ueda, K., Sung, N. H., Efimenko, A., Bombardi, A., Kim, J., Keimer, B. & Kim, B. J. (2020). Phys. Rev. B, 101, 094428.
    1. Braicovich, L., Ament, L. J. P., Bisogni, V., Forte, F., Aruta, C., Balestrino, G., Brookes, N. B., De Luca, G. M., Medaglia, P. G., Granozio, F. M., Radovic, M., Salluzzo, M., van den Brink, J. & Ghiringhelli, G. (2009). Phys. Rev. Lett. 102, 167401. - PubMed
    1. Gao, X., Casa, D., Kim, J., Gog, T., Li, C. & Burns, C. (2016). Rev. Sci. Instrum. 87, 083107. - PubMed