. 2023 Mar 23;388(12):1101-1110.
doi: 10.1056/NEJMoa2210063.

Covid-19 Surveillance Testing and Resident Outcomes in Nursing Homes

Affiliations

Covid-19 Surveillance Testing and Resident Outcomes in Nursing Homes

Brian E McGarry et al. N Engl J Med. .

Abstract

Background: Despite widespread adoption of surveillance testing for coronavirus disease 2019 (Covid-19) among staff members in skilled nursing facilities, evidence is limited regarding its relationship with outcomes among facility residents.

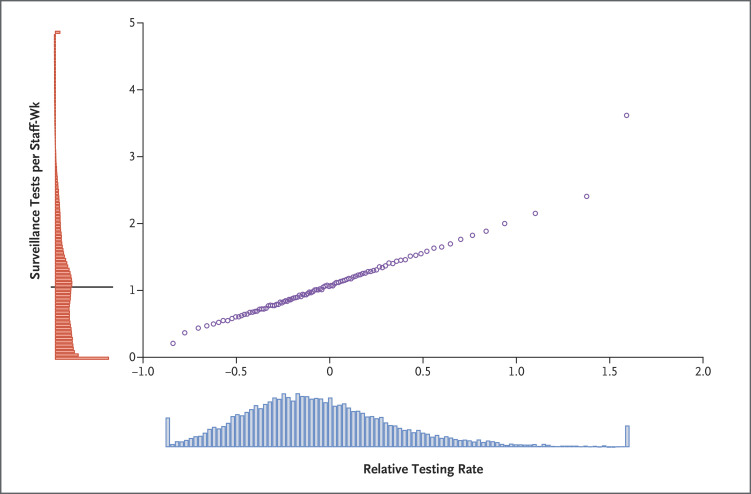
Methods: Using data obtained from 2020 to 2022, we performed a retrospective cohort study of testing for severe acute respiratory syndrome coronavirus 2 (SARS-CoV-2) among staff members in 13,424 skilled nursing facilities during three pandemic periods: before vaccine approval, before the B.1.1.529 (omicron) variant wave, and during the omicron wave. We assessed staff testing volumes during weeks without Covid-19 cases relative to other skilled nursing facilities in the same county, along with Covid-19 cases and deaths among residents during potential outbreaks (defined as the occurrence of a case after 2 weeks with no cases). We reported adjusted differences in outcomes between high-testing facilities (90th percentile of test volume) and low-testing facilities (10th percentile). The two primary outcomes were the weekly cumulative number of Covid-19 cases and related deaths among residents during potential outbreaks.

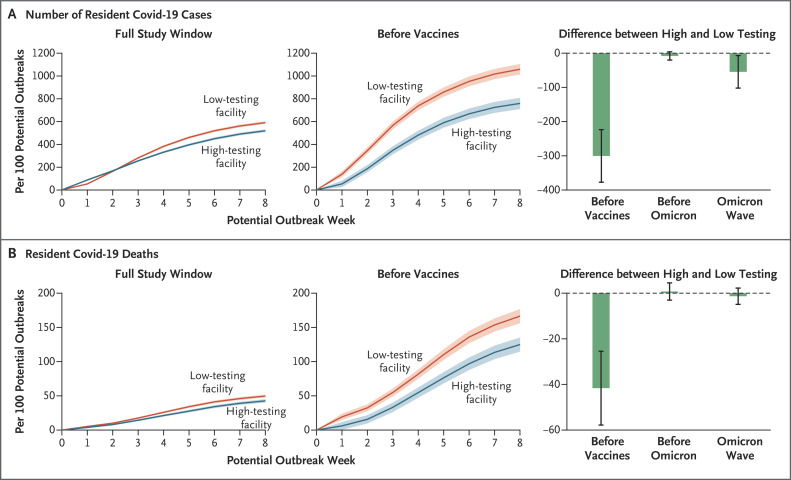
Results: During the overall study period, 519.7 cases of Covid-19 per 100 potential outbreaks were reported among residents of high-testing facilities as compared with 591.2 cases among residents of low-testing facilities (adjusted difference, -71.5; 95% confidence interval [CI], -91.3 to -51.6). During the same period, 42.7 deaths per 100 potential outbreaks occurred in high-testing facilities as compared with 49.8 deaths in low-testing facilities (adjusted difference, -7.1; 95% CI, -11.0 to -3.2). Before vaccine availability, high- and low-testing facilities had 759.9 cases and 1060.2 cases, respectively, per 100 potential outbreaks (adjusted difference, -300.3; 95% CI, -377.1 to -223.5), along with 125.2 and 166.8 deaths (adjusted difference, -41.6; 95% CI, -57.8 to -25.5). Before the omicron wave, the numbers of cases and deaths were similar in high- and low-testing facilities; during the omicron wave, high-testing facilities had fewer cases among residents, but deaths were similar in the two groups.

Conclusions: Greater surveillance testing of staff members at skilled nursing facilities was associated with clinically meaningful reductions in Covid-19 cases and deaths among residents, particularly before vaccine availability.


Figures

Figure 1
Figure 1. Correlation between Distribution of Observed Surveillance Test Volume and Estimated Relative Testing Rate.
Shown is the distribution of the surveillance test volume (y axis) and the estimated relative testing rate (x axis), as well as the association between the two measures (purple circles) on a binned scatter plot in which facility-week samples are divided into 100 equal-size categories according to their relative testing rate. The black horizontal line in the distribution of test volumes represents the mean test volume across all surveillance testing weeks. The clustering of observations at the extremes of the distributions reflect the winsorization of data to account for outliers.
Figure 2
Figure 2. Association of Surveillance Testing Volume among Staff and Covid-19 Outcomes among Residents.
Shown are the results of regression analysis of coronavirus disease 2019 (Covid-19) cases (Panel A) and deaths (Panel B) among residents of skilled nursing facilities (measured as the number of resident cases or deaths per 100 potential outbreaks), according to the level of surveillance testing of staff members. In the graph at left in each panel, data are shown for the full study window (potential outbreaks from November 22, 2020, to March 20, 2022); in the middle graph, for the period before vaccines were available (November 22, 2020, to January 17, 2021); and in the graph at right, for the differences between high-testing facilities and low-testing facilities during the period before vaccines were available, before the wave of the B.1.1.529 (omicron) variant (January 18 to October 31, 2021), and during the omicron wave (November 1, 2021, to March 20, 2022). Shading and 𝙸 bars indicate 95% confidence intervals. Confidence intervals were not adjusted for multiplicity and may not be used in place of hypothesis testing. Details regarding the regression analyses are provided in Section S1.6.
Figure 3
Figure 3. Association of Turnaround Time for Test Results and Covid-19 Outcomes among Residents.
Shown are the results of regression analysis of Covid-19 cases (Panel A) and deaths (Panel B) among residents of skilled nursing facilities (measured as the number of resident cases or deaths per 100 potential outbreaks) during the full study window according to the average length of turnaround time for testing results (≥3 days or 0 to 2 days), as measured at the start of a potential outbreak. The analyses were restricted to potential outbreaks in which a facility reported that the predominant testing method was not point-of-care (typically, polymerase-chain-reaction assay) before the start of the potential outbreak. Confidence intervals (shaded areas) were not adjusted for multiplicity and may not be used in place of hypothesis testing.

Comment in

Similar articles

Cited by

References

    1. Peeling RW, Heymann DL, Teo Y-Y, Garcia PJ. Diagnostics for COVID-19: moving from pandemic response to control. Lancet 2022;399:757-768. - PMC - PubMed
    1. Mercer TR, Salit M. Testing at scale during the COVID-19 pandemic. Nat Rev Genet 2021;22:415-426. - PMC - PubMed
    1. Kissler SM, Fauver JR, Mack C, et al. Viral dynamics of acute SARS-CoV-2 infection and applications to diagnostic and public health strategies. PLoS Biol 2021;19(7):e3001333-e3001333. - PMC - PubMed
    1. Chin ET, Huynh BQ, Chapman LAC, Murrill M, Basu S, Lo NC. Frequency of routine testing for coronavirus disease 2019 (COVID-19) in high-risk healthcare environments to reduce outbreaks. Clin Infect Dis 2021;73(9):e3127-e3129. - PMC - PubMed
    1. Evans S, Agnew E, Vynnycky E, et al. The impact of testing and infection prevention and control strategies on within-hospital transmission dynamics of COVID-19 in English hospitals. Philos Trans R Soc Lond B Biol Sci 2021;376:20200268-20200268. - PMC - PubMed

Publication types

MeSH terms