. 2023 Mar 28;120(13):e2214567120.
doi: 10.1073/pnas.2214567120. Epub 2023 Mar 22.

Coastal upwelling drives ecosystem temporal variability from the surface to the abyssal seafloor

Affiliations

Coastal upwelling drives ecosystem temporal variability from the surface to the abyssal seafloor

Monique Messié et al. Proc Natl Acad Sci U S A. .

Abstract

Long-term biological time series that monitor ecosystems across the ocean's full water column are extremely rare. As a result, classic paradigms are yet to be tested. One such paradigm is that variations in coastal upwelling drive changes in marine ecosystems throughout the water column. We examine this hypothesis by using data from three multidecadal time series spanning surface (0 m), midwater (200 to 1,000 m), and benthic (~4,000 m) habitats in the central California Current Upwelling System. Data include microscopic counts of surface plankton, video quantification of midwater animals, and imaging of benthic seafloor invertebrates. Taxon-specific plankton biomass and midwater and benthic animal densities were separately analyzed with principal component analysis. Within each community, the first mode of variability corresponds to most taxa increasing and decreasing over time, capturing seasonal surface blooms and lower-frequency midwater and benthic variability. When compared to local wind-driven upwelling variability, each community correlates to changes in upwelling damped over distinct timescales. This suggests that periods of high upwelling favor increase in organism biomass or density from the surface ocean through the midwater down to the abyssal seafloor. These connections most likely occur directly via changes in primary production and vertical carbon flux, and to a lesser extent indirectly via other oceanic changes. The timescales over which species respond to upwelling are taxon-specific and are likely linked to the longevity of phytoplankton blooms (surface) and of animal life (midwater and benthos), which dictate how long upwelling-driven changes persist within each community.

Keywords: California Current; animal lifespan; coastal upwelling; deep sea; ecosystem variability.


Conflict of interest statement

The authors declare no competing interest.

Figures

Fig. 1.
Fig. 1.
Presentation of the three time series programs. A map indicates their location (stars; S = surface, M = midwater, B = benthos) as well as wind stations where local upwelling was calculated (Monterey Bay and Point Conception, black dots). Taxon-specific time series are displayed in colors (Fourth-root-transformed and mean removed): (A) surface plankton (originally mg m−3), (B) 200 to 1,000 m averaged midwater animal density (originally counts per m3), (C) benthic animal density (originally counts per m2). Taxon names are color-coded according to major groups specific to each time series (see taxon group legend). Photographs of key representative taxa from each time series are shown below each panel. See SI Appendix, Fig. S1 for a time-series plot.
Fig. 2.
Fig. 2.
First PCA mode for the three communities: (A) surface, (B) midwater, and (C) benthos. For each community, the Top panel displays the principal component (PC1), averaged monthly with 1-mo gaps filled by linear interpolation for better visualization (remaining gaps are indicated in black). The Bottom panel displays the taxon-specific loadings, sorted graphically so that taxa scoring similarly on a given mode are displayed next to each other. For each community, this mode shows most taxa increasing and decreasing over time with little change in community structure, although the temporal variability differs between the three communities. Due to space constraints, midwater taxon names are displayed in two columns. The benthic time series had to be shortened to obtain a first PCA mode statistically separable from the second (Materials and Methods). The colors correspond to taxonomic groups specific to each time series.
Fig. 3.
Fig. 3.
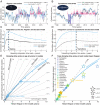
Relationship between integrated upwelling and PC1 for the three communities. (A) Integration curves: correlation coefficients between each PC1 and integrated upwelling for a range of integration timescales. Correlations for which ≥ 0.01 (adjusted for autocorrelation) are indicated with dots; the P values are displayed in SI Appendix, Fig. S2. The high correlations suggest that periods of high upwelling favor increases in organism biomass or density, although each community responds over different timescales. The damping timescale (maximum correlation, vertical dashed lines) is 16 d for the surface, 4.5 y for the benthos, and undefined for midwater. Shaded areas highlight the spread of correlation (width one SD, centered around the mean) when considering 500 randomly subsampled datasets for surface and midwater based on benthos temporal resolution. (B) Original upwelling time series for Monterey Bay (no integration). (C and D) Monthly PC1 for the surface and midwater communities as in Fig. 2 (shaded blue/pink) and daily Monterey Bay upwelling integrated using different timescales, normalized to PC1 (black lines). (E) Same as (B) for the Point Conception upwelling. (F) Same as (C) and (D) for the benthic community using Point Conception upwelling. Correlation coefficients (< 0.01, adjusted for autocorrelation) were computed between PC1 (original temporal resolution) and integrated upwelling time series on coincident daily time steps, except for the benthos where monthly averages were used. The same correlations with nonintegrated upwelling are: surface r = 0.24, midwater r = −0.18, benthos r = −0.04.
Fig. 4.
Fig. 4.
Direct and indirect processes connecting wind forcing to biological communities through the water column. Large-scale and local climate variability impact local winds and environmental conditions such as oceanic currents, temperature, oxygen concentrations, and nutrient concentration at depth. As such, atmospheric forcing is connected to biological communities both directly (via changes in wind-driven nutrient supply) and indirectly (via changes in local environmental conditions). Upwelling, driven by local winds, brings nutrients to the sunlit waters sustaining phytoplankton. Midwater animals are connected to surface biological communities via feeding in surface waters at night during diel vertical migration (DVM), and via the vertical export of surface organic matter to depth (carbon export). A portion of carbon export ultimately sinks to the seafloor, sustaining benthic communities. The surface, midwater, and benthic communities each integrate the upwelling forcing but do so at different frequencies (damping timescales), resulting in different temporal variation (Fig. 3).
Fig. 5.
Fig. 5.
Relationship between taxon-specific time series, integrated upwelling, and age structure. (A) Comparisons between observed taxon density (colors), Monterey Bay integrated upwelling (black), and output from an age-structured model (blue) for the medusa group Aegina+ (includes several species of Aegina-like narcomedusae). Observed density was fourth-root-transformed and averaged monthly with 1-mo gaps filled as in Fig. 2. Upwelling was integrated using the Aegina+ damping timescale of 9 mo. The model parameterization best representing Aegina+ (characterized by a natural mortality rate of 1.3 y−1) was used. (B) Similar to (A) but for the fish Cyclothone instead of Aegina+. The model parameterization best representing the Cyclothone time series was characterized by a natural mortality rate of 0.25 y−1. In (A) and (B) legends, significance levels are indicated as ** (< 0.01) or * (< 0.05). (C) Integration curves for Aegina+ (black) and the model output (blue, computed over the 1989 to 2018 time period). Dashed lines indicate the damping timescale (best-fitting integration timescale) for the data and model time series. Even though correlation strength differs, the shape of the two integration curves is similar, indicating that age structure (as implemented in the model) is sufficient to explain the relationship with integrated upwelling and is likely to drive the damping timescale. (D) Similar to (C) but for the fish Cyclothone instead of Aegina+. In (C) and (D), correlations for which ≥ 0.01 are dotted (P remains <0.05 for Cyclothone). Taken together, these four panels show that Cyclothone and Aegina+ both are correlated with integrated upwelling but their temporal variability, best model parameterization, and integration curves are very different. (E) Blue: relationship between damping timescale and mean lifespan across the different model parameterizations (“+” = each parameterization, line = second-order polynomial fit). For a given parameterization, the damping timescale of modeled time series is the best-fitting integration timescale when comparing integrated upwelling (forcing the model) and the model output [e.g., dashed blue lines in panels (C) and (D)]. Bold highlights the best parameterization identified for Aegina+ and Cyclothone. Grey/black lines indicate the age at which a given percentage of the population survived, from 100% (at age 0) to 1% (maximum lifespan in the model). The damping timescale (“+” for each parameterization) falls between the mean (1:1 line) and median lifespans. (F) Relationship between individual midwater taxa damping timescales when identified (bold numbers in SI Appendix, Table S4; dashed black lines in panels C and D for Aegina+ and Cyclothone) and the mean lifespan characterizing the model output best correlated with the taxon time series (i.e., same x-value as in panel (E). Taxa are sorted according to the correlation between each taxon time series and its associated model output, also represented by the size of the stars. Filled stars indicate < 0.01; open when < 0.05 (not displayed otherwise).

References

    1. Doney S. C., et al. , Climate change impacts on marine ecosystems. Ann. Rev. Mar. Sci. 4, 11–37 (2012), 10.1146/annurev-marine-041911-111611. - DOI - PubMed
    1. Borja A., Grand challenges in marine ecosystems ecology. Front. Mar. Sci. 1, 1 (2014), 10.3389/fmars.2014.00001. - DOI
    1. Bonan G. B., Doney S. C., Climate, ecosystems, and planetary futures: The challenge to predict life in Earth system models. Science 359, eaam8328 (2018), 10.1126/science.aam8328. - DOI - PubMed
    1. Benway H. M., et al. , Ocean time series observations of changing marine ecosystems: An era of integration, synthesis, and societal applications. Front. Mar. Sci. 6, 393 (2019), 10.3389/fmars.2019.00393. - DOI
    1. Smith K. L. Jr., et al., Navigating the uncertain future of global oceanic time series. Eos 96 (2015), 10.1029/2015EO038095. - DOI

Publication types