. 2023 Mar 22;19(3):e1010154.
doi: 10.1371/journal.pcbi.1010154. eCollection 2023 Mar.

A real data-driven simulation strategy to select an imputation method for mixed-type trait data

Affiliations

A real data-driven simulation strategy to select an imputation method for mixed-type trait data

Jacqueline A May et al. PLoS Comput Biol. .

Abstract

Missing observations in trait datasets pose an obstacle for analyses in myriad biological disciplines. Considering the mixed results of imputation, the wide variety of available methods, and the varied structure of real trait datasets, a framework for selecting a suitable imputation method is advantageous. We invoked a real data-driven simulation strategy to select an imputation method for a given mixed-type (categorical, count, continuous) target dataset. Candidate methods included mean/mode imputation, k-nearest neighbour, random forests, and multivariate imputation by chained equations (MICE). Using a trait dataset of squamates (lizards and amphisbaenians; order: Squamata) as a target dataset, a complete-case dataset consisting of species with nearly complete information was formed for the imputation method selection. Missing data were induced by removing values from this dataset under different missingness mechanisms: missing completely at random (MCAR), missing at random (MAR), and missing not at random (MNAR). For each method, combinations with and without phylogenetic information from single gene (nuclear and mitochondrial) or multigene trees were used to impute the missing values for five numerical and two categorical traits. The performances of the methods were evaluated under each missing mechanism by determining the mean squared error and proportion falsely classified rates for numerical and categorical traits, respectively. A random forest method supplemented with a nuclear-derived phylogeny resulted in the lowest error rates for the majority of traits, and this method was used to impute missing values in the original dataset. Data with imputed values better reflected the characteristics and distributions of the original data compared to complete-case data. However, caution should be taken when imputing trait data as phylogeny did not always improve performance for every trait and in every scenario. Ultimately, these results support the use of a real data-driven simulation strategy for selecting a suitable imputation method for a given mixed-type trait dataset.


Conflict of interest statement

The authors have declared that no competing interests exist.

Figures

Fig 1
Fig 1. Visualization of missingness.
Visualization of missingness (proportion of present vs. missing observations) in Squamata trait data obtained from the primary literature. Superscripts indicate the original sources of the trait data: 1) amniote life history database [12,13], 2) vertebrate home range sizes dataset [14,15], 3) traits of lizards of the world [16,17] and 4) AnAge [18,19]. See S1 File for further detail on trait sources.
Fig 2
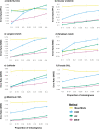
Fig 2. MCAR performance without phylogeny.
Performances of the methods mean/mode imputation, KNN, missForest (RF), and multivariate imputation by chained equations (MICE) across different proportions of missingness when data were missing completely at random (MCAR). For MICE, logistic regression and predictive mean matching were used for imputing categorical and numerical traits, respectively. Error rate was measured as proportion falsely classified (PFC) for the categorical traits a) activity time and b) insular endemic and as mean squared error (MSE) for the numerical traits c) largest clutch, d) smallest clutch, e) latitude, f) female snout-vent length (SVL), and g) maximum SVL. PFC and MSE values for each trait were averaged across 100 dataset replicates. In both cases, error rates closer to 0 are indicative of better performance.
Fig 3
Fig 3. Imputation performance under different missingness mechanisms for categorical traits.
Comparison of error rates (PFC) for the methods mean/mode imputation, KNN, RF, and MICE under different missingness mechanisms with and without the addition of phylogenetic information. Phylogenetic information was added in the form of trees built from sequence data of mitochondrial cytochrome c oxidase subunit I (COI), nuclear oocyte maturation factor (c-mos), recombination activating gene 1 (RAG1), and a composite multigene (MG) tree. Performances were quantified using PFC for the categorical traits a) activity time and b) insular endemic. PFC values for each trait were averaged across 100 dataset replicates. MAR = missing at random; MNAR = missing not at random.
Fig 4
Fig 4. Imputation performance under different missingness mechanisms for numerical traits.
Comparison of error rates for the methods mean/mode imputation, KNN, RF, and MICE under different missingness mechanisms with and without the addition of phylogenetic information. Phylogenetic information was added in the form of trees built from sequence data of COI, c-mos, RAG1, and a composite multigene (MG) tree. Performances were quantified using MSE for the numerical traits a) largest clutch, b) smallest clutch, c) latitude, d) female SVL, and e) maximum SVL. MSE values for each trait were averaged across 100 dataset replicates.
Fig 5
Fig 5. Association between error ratio and phylogenetic signal.
Association between error ratio (error rate without phylogeny/error rate with phylogeny) and phylogenetic signal (Fritz and Purvis’ D [41] for categorical traits and Pagel’s λ [42] for numerical traits) at different proportions of missingness. Error ratio values above 1 (indicated by the gray line) signify an improvement in performance when phylogeny is added. In the case of D, lower values are indicative of higher levels of phylogenetic conservation for the trait; conversely, higher values of λ suggest stronger phylogenetic signal. Results are not shown for MAR in a) as only one trait (activity time) was simulated under this mechanism. To improve visualization, values were jittered (random noise introduced to data) using the package “ggplot2” [43]. Additionally, results are only shown for the c-mos gene (categorical traits) and RAG1 gene (numerical traits) as other genes followed similar patterns and these genes displayed the greatest range in phylogenetic signal.
Fig 6
Fig 6. Comparison of quantitative characteristics across datasets.
Comparison of a) categorical frequencies for the trait activity time and distributions for the traits b) largest clutch, c) smallest clutch, and d) female SVL of the complete-case data, original data, and imputed data. The natural logarithm (ln) of the numerical data were taken to improve visualization.
Fig 7
Fig 7. Workflow of the real data-driven simulation strategy.
1) Missing values are simulated in the near complete-case dataset under MCAR, MAR, and MNAR mechanisms. Missing dataset refers to the near complete-case dataset with simulated missing values; 2) imputation of simulated missing values using different candidate methods (with or without phylogeny); 3) identification of the best-suited method based on the performances (MSE and PFC) of the candidate methods. The imputed values from 2) are compared to the true observed values in the near complete-case dataset to derive MSE and PFC for numerical and categorical traits, respectively. Note that the “true observed values” refer to the trait values reported in the source Meiri (2018) dataset [16,17]. These values are assumed to contain a negligible amount of measurement error in this context and provide a close representation of the true biological values for squamates. MSE and PFC are averaged across 100 replicates; and 4) application of the best-suited imputation method to the original target dataset with missing values. Original data, original data with imputed values, and complete-case data characteristics and distributions are compared to assess how imputation impacts dataset properties.

References

    1. Voituron Y, de Fraipont M, Issartel J, Guillaume O, Clobert J. Extreme lifespan of the human fish (Proteus anguinus): a challenge for ageing mechanisms. Biol Lett. 2011;7(1):105–7. doi: 10.1098/rsbl.2010.0539 - DOI - PMC - PubMed
    1. Valcu M, Dale J, Griesser M, Nakagawa S, Kempenaers B. Global gradients of avian longevity support the classic evolutionary theory of ageing. Ecography. 2014. Oct 1;37(10):930–8.
    1. Howard SD, Bickford DP. Amphibians over the edge: silent extinction risk of Data Deficient species. Divers Distrib. 2014. Jul 1;20(7):837–46.
    1. Pacifici M, Visconti P, Butchart SHM, Watson JEM, Cassola FM, Rondinini C. Species’ traits influenced their response to recent climate change. Nat Clim Change. 2017. Mar 1;7(3):205–8.
    1. Garamszegi LZ, Møller AP. Nonrandom variation in within-species sample size and missing data in phylogenetic comparative studies. Syst Biol. 2011;60(6):876–80. doi: 10.1093/sysbio/syr060 - DOI - PubMed

Publication types