. 2023 Mar 22;9(12):eadd6734.
doi: 10.1126/sciadv.add6734. Epub 2023 Mar 22.

Identification of IgA autoantibodies targeting mesangial cells redefines the pathogenesis of IgA nephropathy

Affiliations

Identification of IgA autoantibodies targeting mesangial cells redefines the pathogenesis of IgA nephropathy

Yoshihito Nihei et al. Sci Adv. .

Abstract

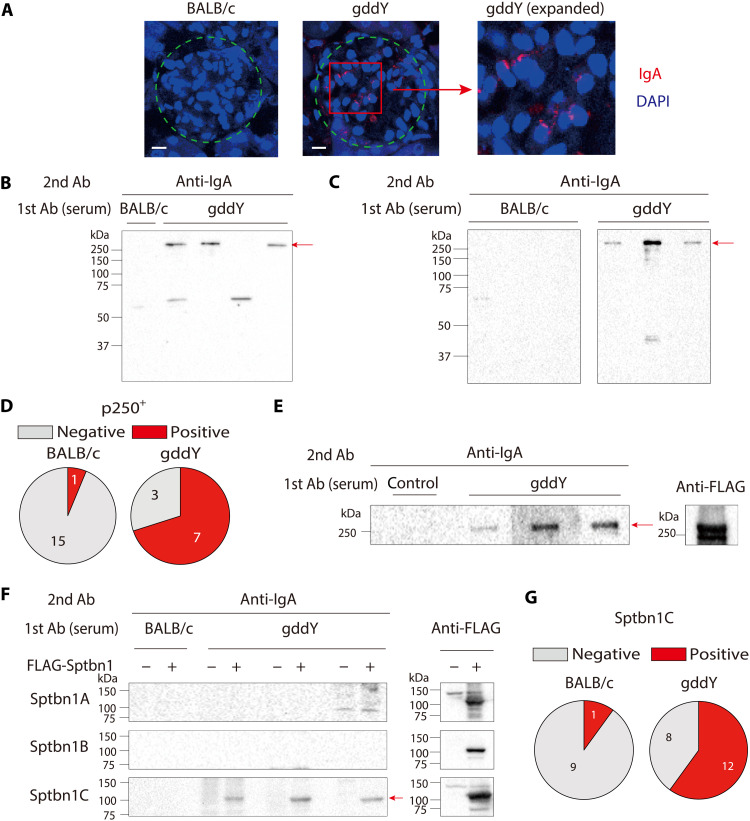
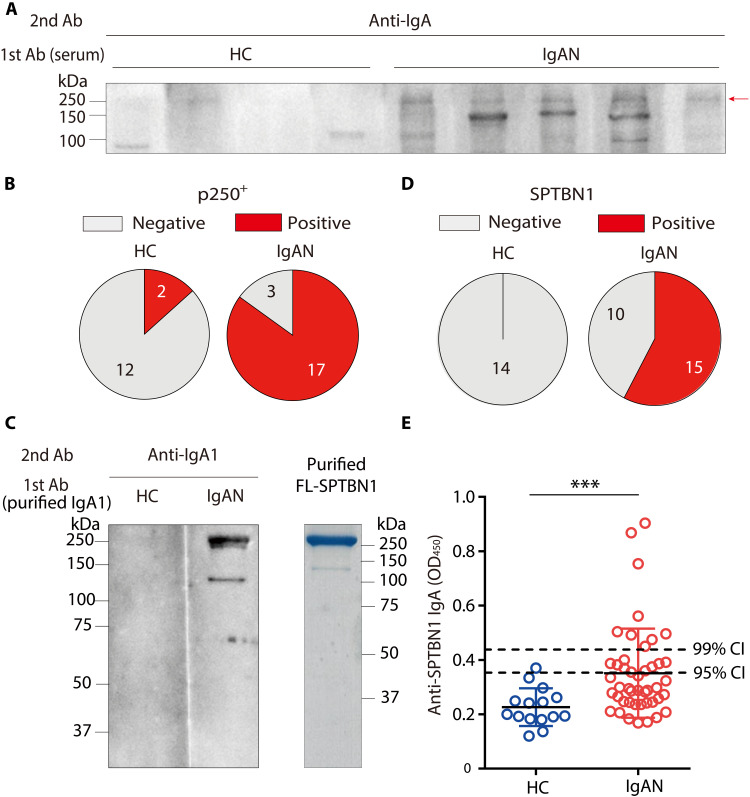
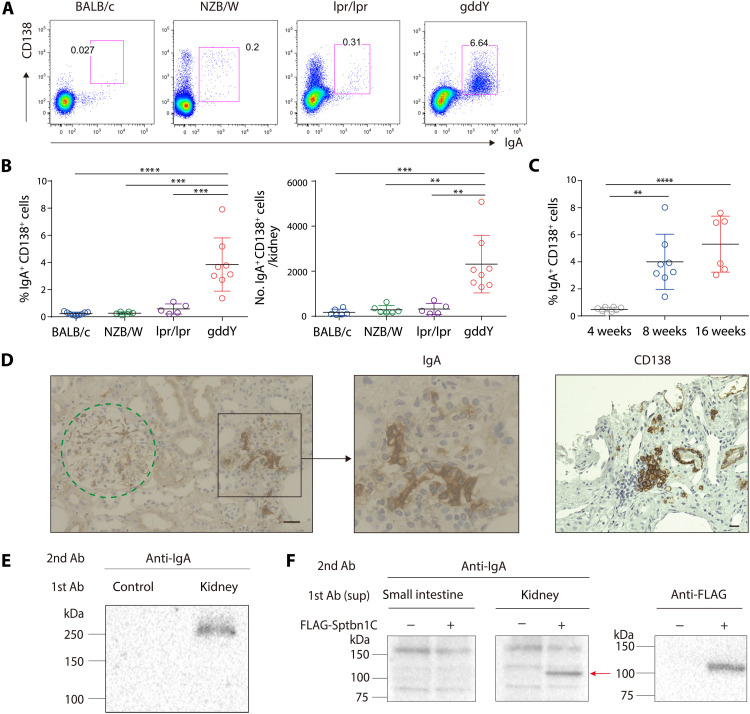
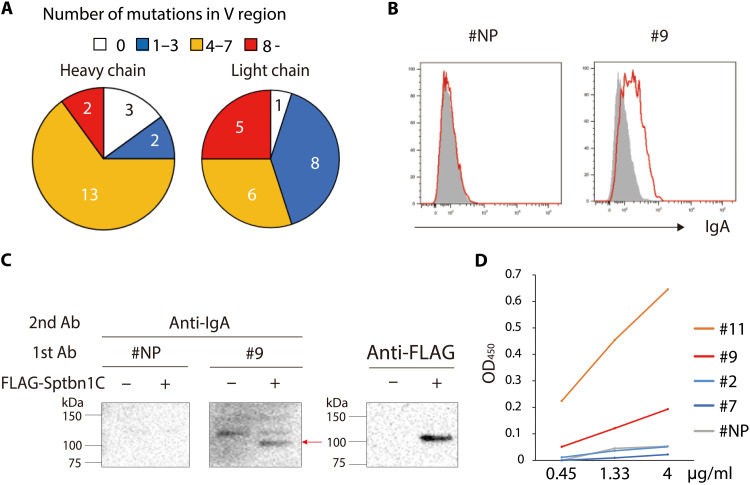
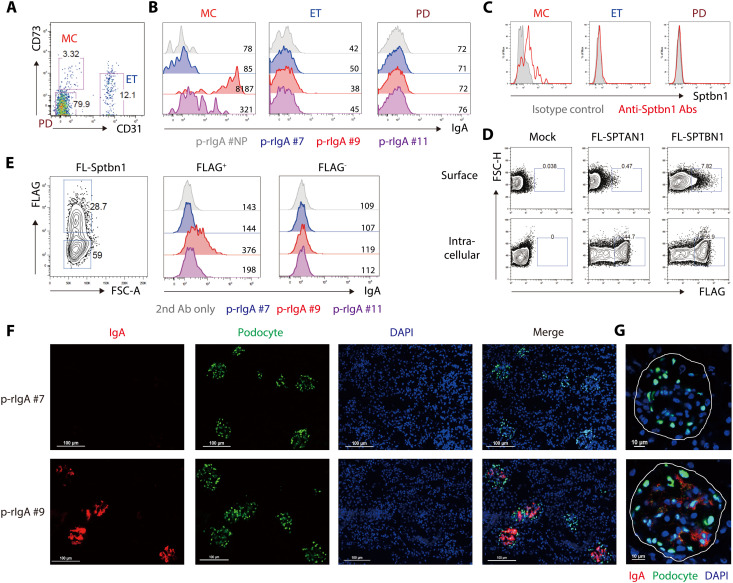
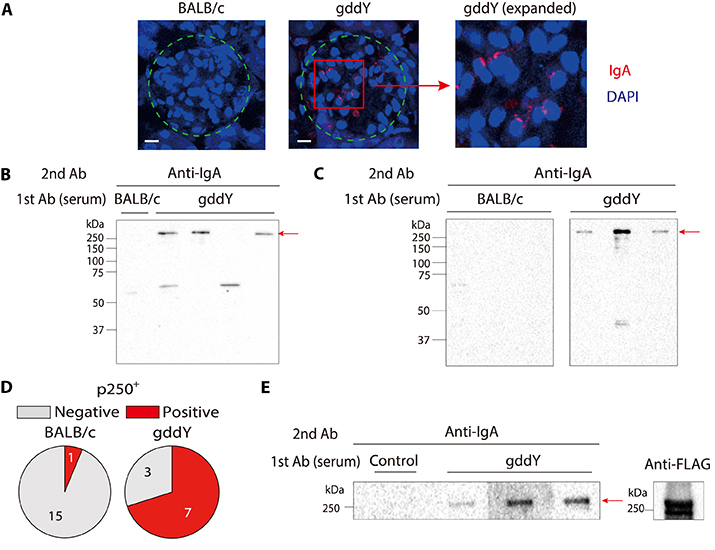
Immunoglobulin A (IgA) nephropathy (IgAN) is the most common type of primary glomerulonephritis, often progressing to renal failure. IgAN is triggered by IgA deposition in the glomerular mesangium by an undefined mechanism. Here, we show that grouped ddY (gddY) mice, a spontaneous IgAN model, produce serum IgA against mesangial antigens, including βII-spectrin. Most patients with IgAN also have serum anti-βII-spectrin IgA. As in patients with IgAN, IgA+ plasmablasts accumulate in the kidneys of gddY mice. IgA antibodies cloned from the plasmablasts carry substantial V-region mutations and bind to βII-spectrin and the surface of mesangial cells. These IgAs recognize transfected and endogenous βII-spectrin exposed on the surface of embryonic kidney-derived cells. Last, we demonstrate that the cloned IgA can bind selectively to glomerular mesangial regions in situ. The identification of IgA autoantibody and its antigen in IgAN provides key insights into disease onset and redefines IgAN as a tissue-specific autoimmune disease.


Figures

Fig. 1.
Fig. 1.. Serum IgA auto-Abs in gddY mice recognizing βII-spectrin in MCs.
(A) Kidney sections from AID-knockout mice were stained with sera from 16-week-old (wo) BALB/c (left) or gddY (center, right) mice followed by PE–anti-IgA Ab (red) and with 4′,6-diamidino-2-phenylindole (DAPI; blue). Dashed circles indicate areas of glomeruli. The scale bars are shown as white lines (10 μm). (B) WB of glomeruli of gddY mice blotted with pooled serum of 12-wo BALB/c or gddY mice (n = 4), followed by anti-IgA Ab. The red arrow indicates the p250+ band. Shown is a representative of three independent experiments. (C) WB of mouse primary MCs blotted with sera of 12-wo BALB/c or 8-wo gddY mice (n = 3), followed by anti-IgA Ab. The red arrow indicates the p250+ band. (D) Reactivity of serum IgA from 8- to 16-wo BALB/c or gddY mice to p250+. The numbers of serum samples are denoted in the pie charts. (E) WB of purified FLAG-FL-Sptbn1 protein probed with serum from a 12-wo ddY mouse (control) or sera from 12-wo gddY mice (n = 3), followed by anti-IgA Ab (left). The presence of the FLAG-FL-Sptbn1 was confirmed by using an anti-FLAG Ab (right). (F) WB of HEK293T cells transfected with mock (−) or FLAG-tagged Sptbn1A, Sptbn1B, or Sptbn1C (+) and probed with pooled sera from four 16-wo BALB/c mice or sera from gddY mice (n = 3), followed by anti-IgA Ab (left). The red arrow indicates Sptbn1C. The expression of each Sptbn1 fragment was confirmed by WB with an anti-FLAG Ab (right). (G) Reactivity of serum IgA of 12- to 16-wo BALB/c (left) and 8- to 16-wo gddY (right) mice to Sptbn1C determined by WB as shown in (F).
Fig. 2.
Fig. 2.. Presence of IgA auto-Abs against βII-spectrin in the sera of patients with IgAN.
(A) A representative WB of primary human MCs probed with sera from healthy control individuals (HC; n = 4) or patients with IgAN (IgAN; n = 5) followed by anti-human IgA Ab. The red arrow indicates the p250+ band. (B) Reactivity of serum IgA from HC or patients with IgAN to p250+. (C) WB of purified FLAG-tagged FL-SPTBN1 protein probed with purified IgA1 (25 μg/ml) from pooled sera of three HCs or three patients with IgAN, followed by anti-IgA Abs (left). The purified FLAG-tagged FL-SPTBN1 protein developed on an SDS-PAGE gel (5 μg per lane) was stained with Coomassie Brilliant Blue dye (right). (D) Reactivity of serum IgA1 from HC or patients with IgAN to SPTBN1. (E) ELISA determination of anti-SPTBN1 IgA Abs in the sera from HC (n = 15) or patients with IgAN (n = 45). ***P = 0.0007 (Mann-Whitney U test). The dashed lines show the 95% confidence interval(CI) and 99% CI of the control sera. Shown is one of two ELISA experiments with reproducible results. OD, optical density.
Fig. 3.
Fig. 3.. Increased serum IgA/C3 ratio in IgAN patients with higher anti–βII-spectrin IgA.
(A to D) eGFR (A), serum IgA (B), serum C3 (C), and serum IgA/C3 ratio (D) were compared between the anti-SPTBN1 IgA “low” (Low) and “high” (High) groups of patients with IgAN. Small horizontal lines indicate the mean (black) ± SD (colored) of each group. **P < 0.01 and ****P < 0.0001 (Mann-Whitney U test).
Fig. 4.
Fig. 4.. Accumulation of PBs producing anti–βII-spectrin IgA in gddY mouse kidneys.
(A and B) Leukocytes isolated from the kidneys of the following mice were surface-stained for CD138 and then intracellularly stained for IgA: BALB/c (8 weeks old, n = 6), NZB/W F1 (24 weeks old, n = 6), Faslpr/lpr (24 weeks old, n = 5), and gddY (8 weeks old, n = 8). The numbers in the panels indicate the percentages of IgA+ CD138+ cells among live cells (A). The frequency (left) and the number (right) of IgA+ CD138+ cells in each mouse kidney (B). (C) Frequency of the IgA+ CD138+ cells among live cells in each kidney of gddY mice at the indicated age (n = 8, 8, and 6 for the 4-, 8-, and 16-wo mice, respectively). (D) IHC staining for IgA and CD138 in kidney biopsies from patients with IgAN. The dashed circle indicates a glomerulus. The scale bars are shown as black lines (20 μm). (E) WB of glomerular lysates blotted with the culture supernatants of IgA+ CD138+ cells from gddY mouse kidneys (kidney) or no cells (control) cultured on 40LB/APRIL cells (fig. S7A). (F) WB of HEK293T cells transfected with mock (−) or FLAG-Sptbn1C (+) vectors blotted with supernatants of IgA+ CD138+ cells from the small intestine or kidney of gddY mice cultured as in (E) (left). The arrow indicates exogenous Sptbn1C, as confirmed with an anti-FLAG Ab (right). Data are representative of two or three independent experiments. Small horizontal lines indicate the mean (black) ± SD (colored) of each group (B and C). **P < 0.01, ***P < 0.001, and ****P < 0.0001 (one-way ANOVA with multiple comparison test) (B and C).
Fig. 5.
Fig. 5.. Characterization of rIgA generated from IgA+ PBs of gddY mouse kidneys.
(A) Pie charts showing the number of sequences of heavy- or light-chain variable (V) regions carrying the indicated numbers of amino acid mutations per sequence. The V-region genes were cloned from single cells (n = 20) of IgA+ PBs from the kidneys of gddY mice. (B) Flow cytometric analysis of primary cultured mouse MCs stained intracellularly with anti-NP rIgA (#NP) or rIgA #9 followed by anti-IgA Ab (red). Shaded histograms indicate the cells stained with the secondary Ab alone. (C) Anti-FLAG immunoprecipitates from lysates of HEK293T cells transfected with mock (−) or FLAG-Sptbn1C (+) vectors were blotted with rIgA (#NP or #9) followed by anti-IgA Ab (left). The arrow indicates exogenous Sptbn1C, as confirmed with anti-FLAG Abs (right). (D) Reactivity to FL-Sptbn1 of the indicated p-rIgAs at the indicated concentration was evaluated by ELISA and presented as OD450 values. Data are representative of two or three independent experiments.
Fig. 6.
Fig. 6.. Binding to βII-spectrin on the MC surface by IgA auto-Abs from gddY mice.
(A) Flow cytometric analysis of mouse glomerular CD45 cells; MCs (CD73+ CD31), endothelial cells (ETs; CD73 CD31+), and podocytes (PDs; CD73 CD31). The numbers indicate the percentages of live cells. (B and C) Histograms with MFIs of the cells as defined in (A), after being stained with the indicated p-rIgA Abs followed by anti-IgA Ab (B) or with anti-Sptbn1 Ab (red line) or isotype-matched control Ab (shaded) (C). (D) HEK293T cells were transfected with mock or FLAG-tagged FL-SPTAN1 or FL-SPTBN1 vectors and stained with anti-FLAG Ab on the surface (top) or intracellularly (bottom) 2 days later. The numbers indicate the percentages of dead cell–excluded cells. (E) HEK293T cells transfected with FLAG-tagged FL-Sptbn1 vector and stained 3 days later with anti-FLAG Ab and the indicated p-rIgA Ab (or without the primary Ab), followed by anti-mouse IgA Ab. Histograms with MFIs of FLAG+ or FLAG (gates shown in the left panel) live cells are shown (center and right). (F and G) IF microscopy. Kidney sections of AID-knockout mice intravenously injected with p-rIgA #7 or p-rIgA #9 (300 μg per mouse) 2 hours previously were stained with anti-IgA (red), anti-WT1 (indicating PDs; green), and DAPI (blue). High-power field presentation of the merged images, with white lines indicating areas of glomeruli, is shown in (G). The scale bars are shown as white lines. Data are one of two independent experiments with similar results.
Description

References

    1. R. J. Wyatt, B. A. Julian, IgA nephropathy. N. Engl. J. Med. 368, 2402–2414 (2013). - PubMed
    1. K. N. Lai, S. C. Tang, F. P. Schena, J. Novak, Y. Tomino, A. B. Fogo, R. J. Glassock, IgA nephropathy. Nat. Rev. Dis. Primers. 2, 16001 (2016). - PubMed
    1. Y. Nihei, M. Kishi, H. Suzuki, A. Koizumi, M. Yoshida, S. Hamaguchi, M. Iwasaki, H. Fukuda, H. Takahara, M. Kihara, S. Tomita, Y. Suzuki, IgA nephropathy with gross hematuria following COVID-19 mRNA vaccination. Intern. Med. 61, 1033–1037 (2022). - PMC - PubMed
    1. L. Negrea, B. H. Rovin, Gross hematuria following vaccination for severe acute respiratory syndrome coronavirus 2 in 2 patients with IgA nephropathy. Kidney Int. 99, 1487 (2021). - PMC - PubMed
    1. N. Klomjit, M. P. Alexander, F. C. Fervenza, Z. Zoghby, A. Garg, M. C. Hogan, S. H. Nasr, M. A. Minshar, L. Zand, COVID-19 vaccination and glomerulonephritis. Kidney Int. Rep. 6, 2969–2978 (2021). - PMC - PubMed