. 2023 Mar 22;9(12):eadd5028.
doi: 10.1126/sciadv.add5028. Epub 2023 Mar 22.

Breast tumors interfere with endothelial TRAIL at the premetastatic niche to promote cancer cell seeding

Affiliations

Breast tumors interfere with endothelial TRAIL at the premetastatic niche to promote cancer cell seeding

Carla Riera-Domingo et al. Sci Adv. .

Abstract

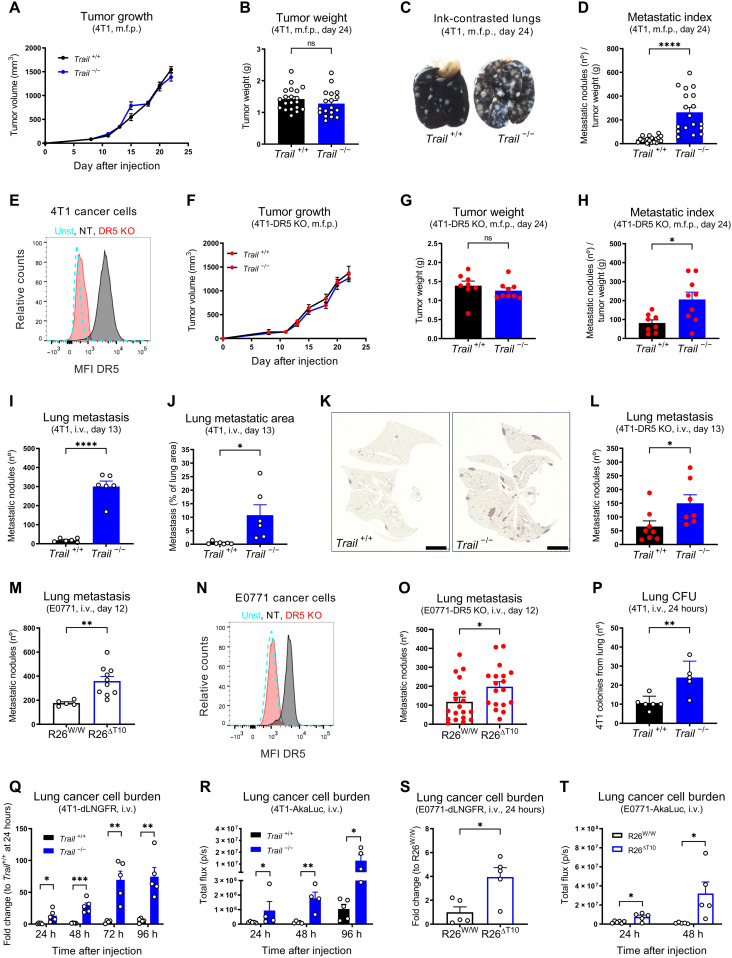
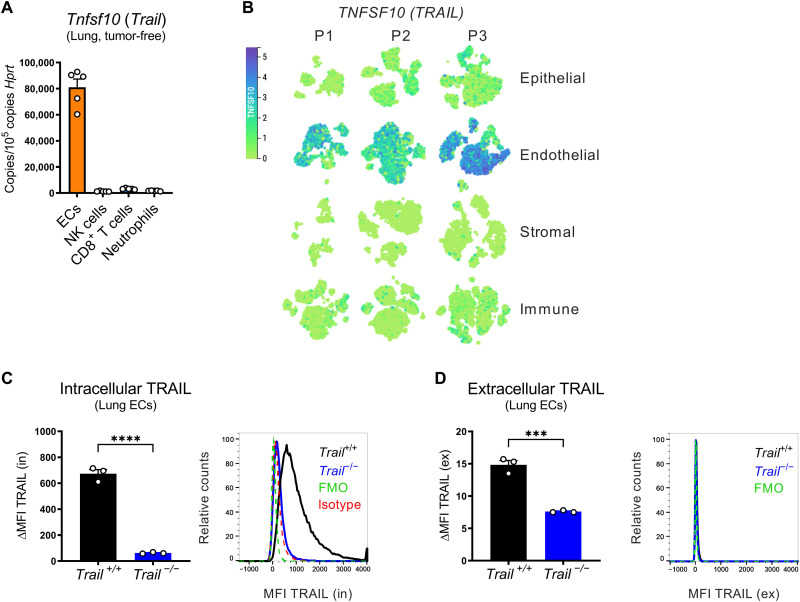
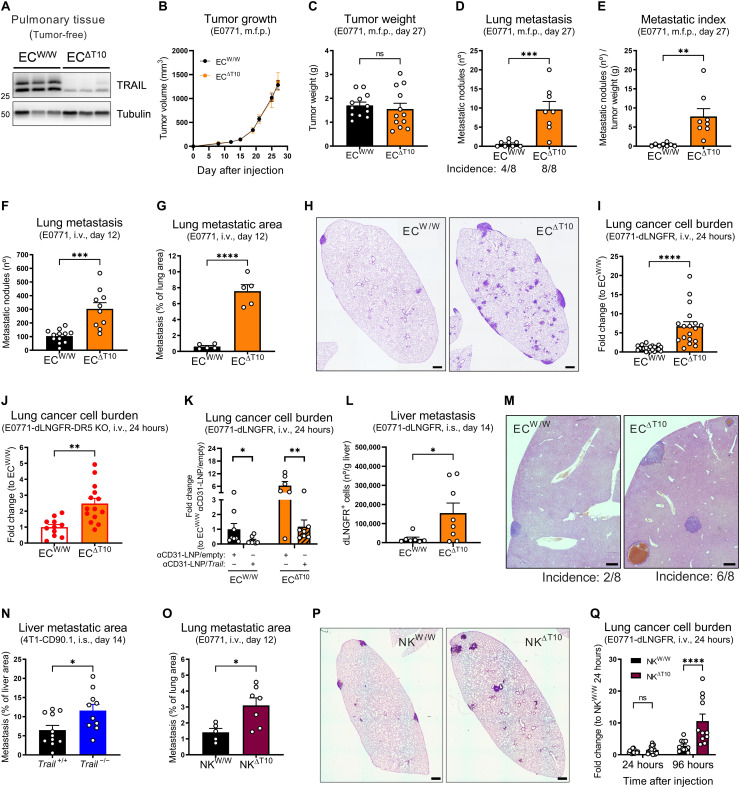
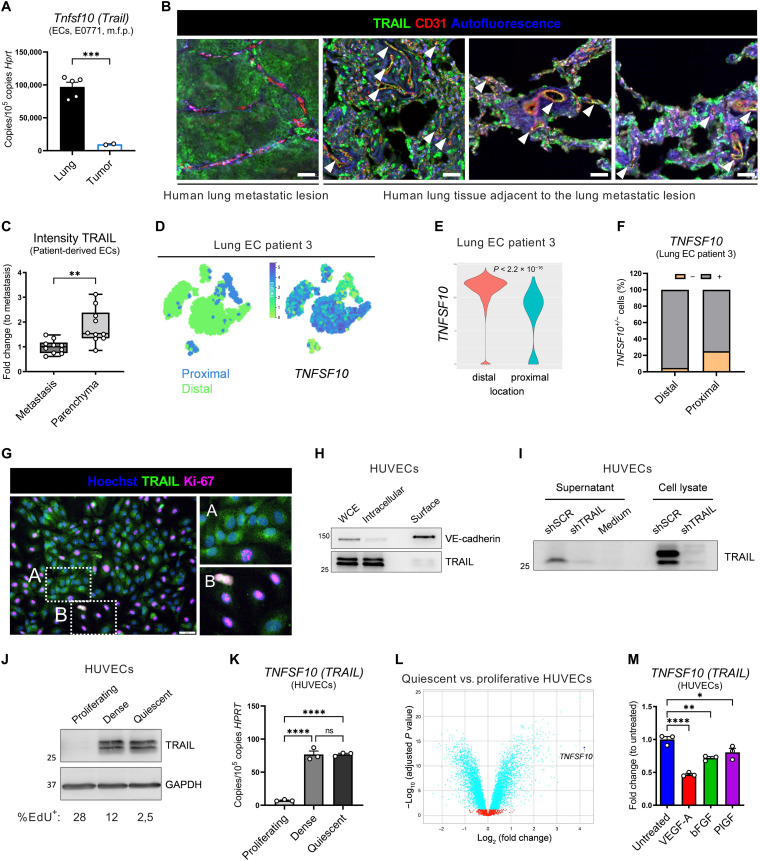
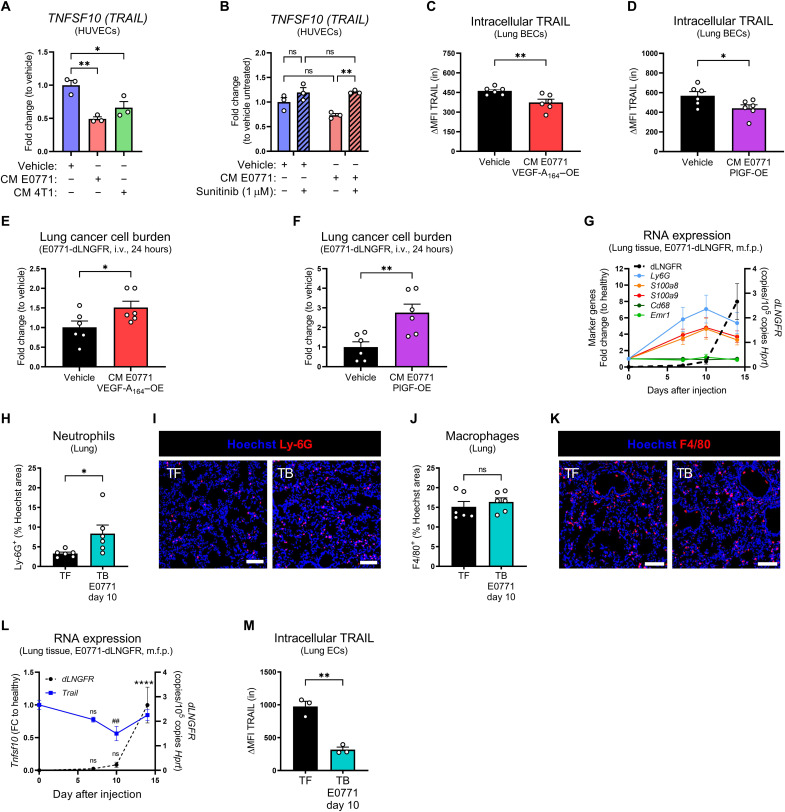
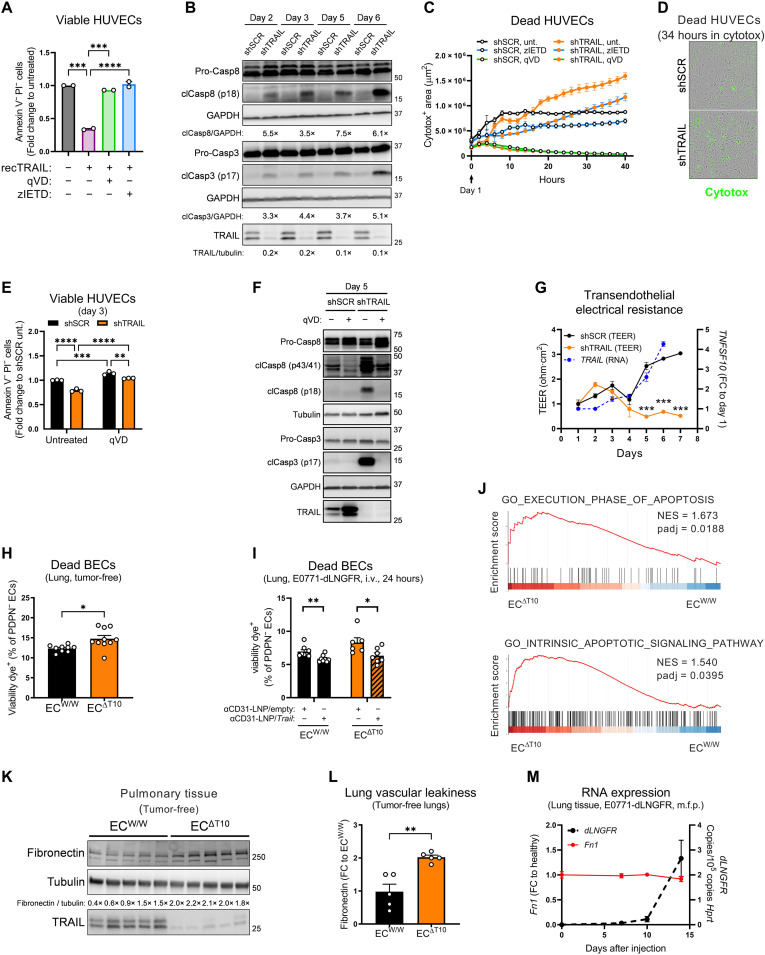
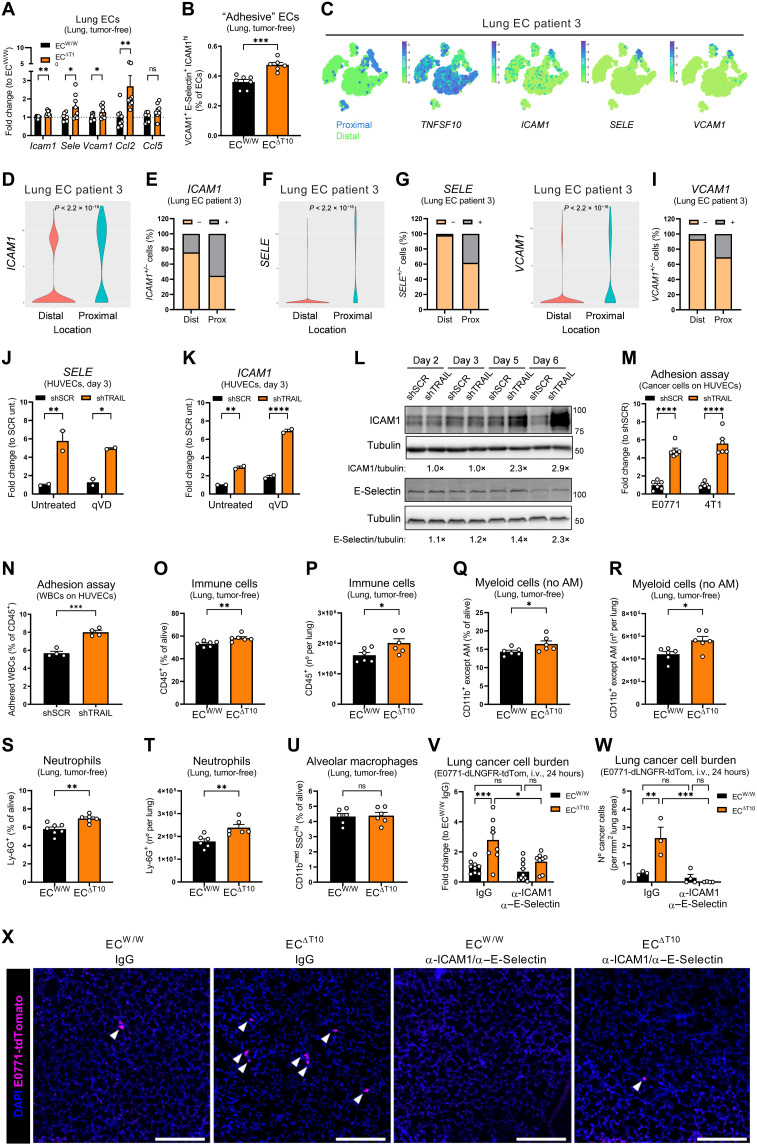
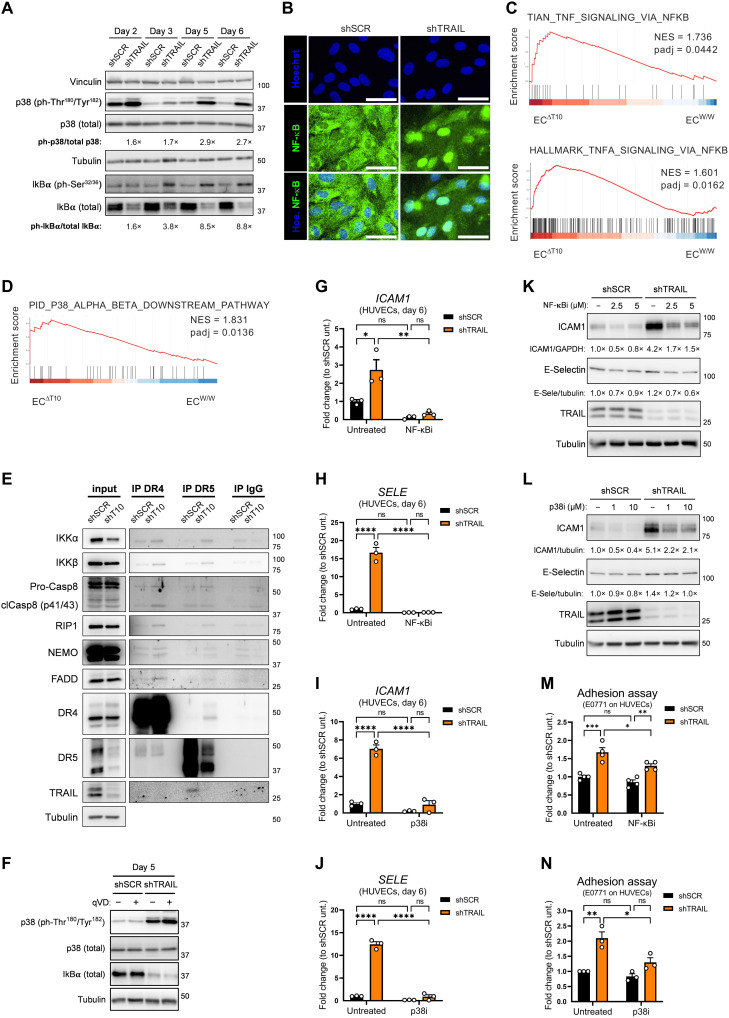
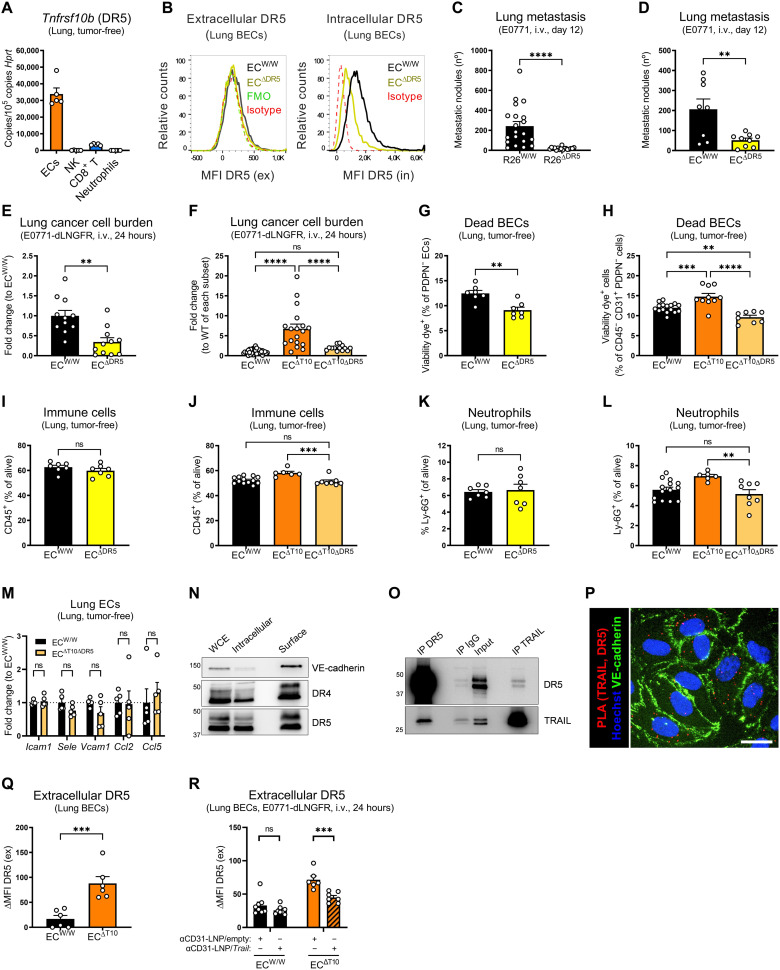
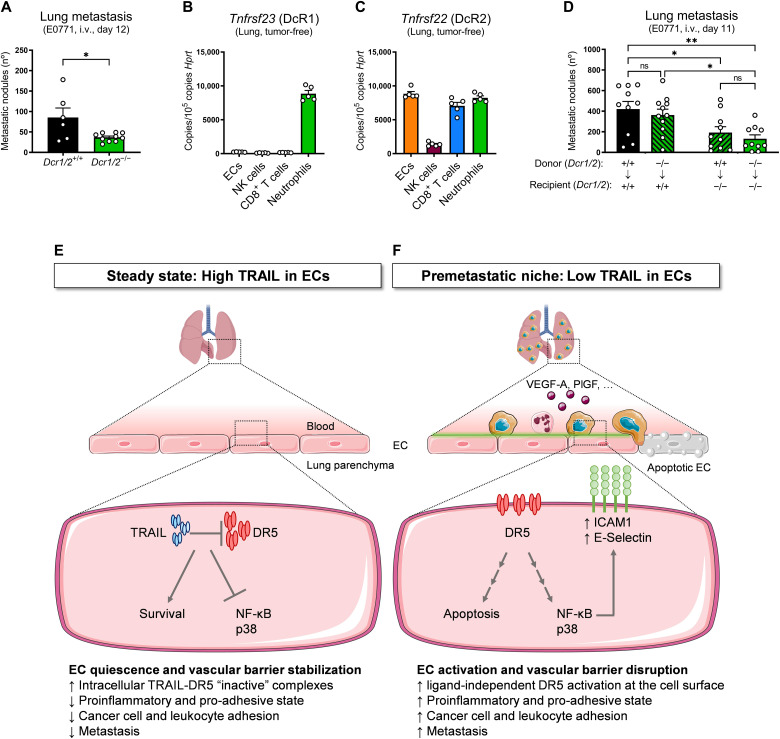
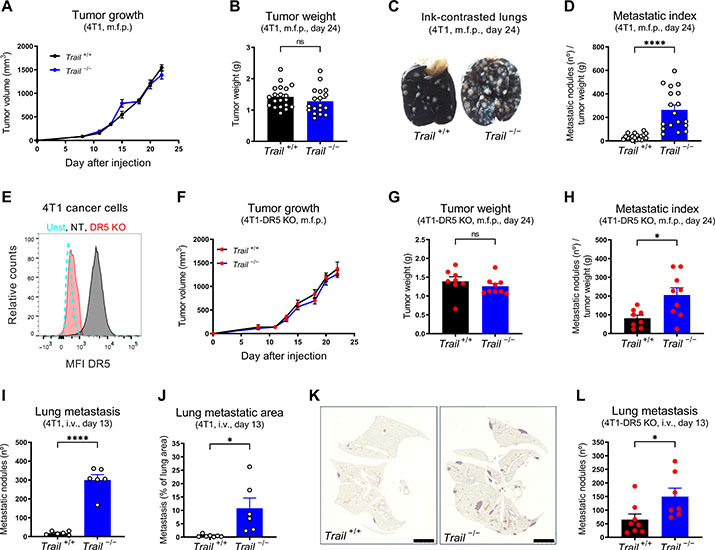
Endothelial cells (ECs) grant access of disseminated cancer cells to distant organs. However, the molecular players regulating the activation of quiescent ECs at the premetastatic niche (PMN) remain elusive. Here, we find that ECs at the PMN coexpress tumor necrosis factor-related apoptosis-inducing ligand (TRAIL) and its cognate death receptor 5 (DR5). Unexpectedly, endothelial TRAIL interacts intracellularly with DR5 to prevent its signaling and preserve a quiescent vascular phenotype. In absence of endothelial TRAIL, DR5 activation induces EC death and nuclear factor κB/p38-dependent EC stickiness, compromising vascular integrity and promoting myeloid cell infiltration, breast cancer cell adhesion, and metastasis. Consistently, both down-regulation of endothelial TRAIL at the PMN by proangiogenic tumor-secreted factors and the presence of the endogenous TRAIL inhibitors decoy receptor 1 (DcR1) and DcR2 favor metastasis. This study discloses an intracrine mechanism whereby TRAIL blocks DR5 signaling in quiescent endothelia, acting as gatekeeper of the vascular barrier that is corrupted by the tumor during cancer cell dissemination.


Figures

Fig. 1.
Fig. 1.. Endogenous TRAIL restrains cancer cell colonization and metastasis independently of DR5 expression in cancer cells.
(A to D) Tumor growth (A), tumor weight (B), representative images of ink-contrasted lungs (C), and metastatic index (D) 24 days after orthotopic mammary fat pad (m.f.p.) injection of 4T1 cells in constitutive TRAIL WT (Trail+/+) and KO (Trail −/−) mice. (E) Fluorescence-activated cell sorting (FACS) analysis of cell surface DR5 protein in sorted 4T1-DR5 KO and 4T1–NT [nontargeting guide RNA (gRNA) control] cells. unst, unstained. (F to H) Tumor growth (F), tumor weight (G), and metastatic index (H) 24 days after orthotopic m.f.p. injection of 4T1-DR5 KO cells in Trail+/+ and Trail −/− mice. (I to K) Number of ink-contrasted lung metastasis (I) or metastatic area in hematoxylin and eosin (H&E) staining (J and K) 13 days after intravenous (i.v.) injection of 4T1 cells in Trail+/+ and Trail −/− mice. Scale bars, 2,5 mm. (L and M) Number of ink-contrasted lung metastasis 13 days after i.v. injection of 4T1-DR5 KO cells in Trail+/+ and Trail −/− mice (L) or 12 days after i.v. injection of E0771 cells in induced ubiquitous TRAIL KO (R26ΔT10) versus control (R26W/W) mice (M). (N) FACS analysis of cell surface DR5 protein in E0771-DR5 KO and E0771-NT cells. (O) Number of ink-contrasted lung metastasis 12 days after i.v. injection of E0771-DR5 KO cells in induced R26W/W and R26ΔT10 mice. (P to R) Number of 4T1 cancer cell colony-forming units (CFU) (P), mRNA expression of dLNGFR (Q), or bioluminescent signal (R) in perfused lung tissue after i.v. injection of 4T1 (P), 4T1-dLNGFR (Q), or 4T1-Akaluc cells (R) in Trail+/+ and Trail−/− mice. (S and T) mRNA expression of dLNGFR (S) or bioluminescent signal (T) in perfused lung tissue after i.v. injection of E0771-dLNGFR (S) or E0771-Akaluc cells (T) in induced R26W/W and R26ΔT10 mice. All graphs show means ± SEM. ns, not significant. *P < 0.05; **P < 0.01; ***P < 0.001; ****P < 0.0001.
Fig. 2.
Fig. 2.. ECs in the premetastatic lung (and liver) are the main source of TRAIL.
(A) mRNA expression of Tnfsf10 in cells sorted from perfused lungs of tumor-free WT mice. (B) T-distributed stochastic neighbor embedding (t-SNE) plots showing the expression of TNFSF10 for different cell subsets (epithelial, endothelial, stromal, and immune) from uninvolved pulmonary tissue of three different patients with lung cancer (P1, P2, and P3). (C and D) FACS analysis of intracellular (in) (C) or extracellular (ex) (D) TRAIL protein on lung ECs from Trail+/+ and Trail−/− mice. ΔMFI = MFIstained − MFIisotype (C) or ΔMFI = MFIstained − MFIFMO (D). All graphs show means ± SEM. ***P < 0.001; ****P < 0.0001.
Fig. 3.
Fig. 3.. EC-derived TRAIL at the PMN restrains early metastatic colonization.
(A) Protein levels of TRAIL in perfused lung tissue lysates of induced EC-specific TRAIL WT (ECW/W) and KO (ECΔT10) mice. (B to E) Tumor growth (B), tumor weight (C), number of ink-contrasted lung metastasis (D), and metastatic index (E) 27 days after orthotopic m.f.p. injection of E0771 cells in induced ECW/W and ECΔT10 mice. (F to H) Number of ink-contrasted lung metastasis (F) or metastatic area in H&E staining (G and H) 12 days after i.v. injection of E0771 cells in induced ECW/W and ECΔT10 mice. Scale bars, 500 μm. (I to K) mRNA expression of dLNGFR in perfused lung tissue 24 hours after i.v. injection of E0771-dLNGFR (I and K) or E0771-dLNGFR-DR5 KO cells (J) in induced ECW/W and ECΔT10 mice. In (K), anti-CD31 (αCD31)–LNP/empty or anti-CD31–LNP/Trail (8 μg per mouse) was injected i.v. 48 and 24 hours before cancer cell injection, and statistical significance was calculated by one-tailed unpaired t test. (L) FACS analysis of the cancer cell burden 14 days after intrasplenic (i.s.) injection of E0771-dLNGFR cells in ECW/W and ECΔT10 mice. (M) Representative images of H&E staining of livers 14 days after i.s. injection of E0771-dLNGFR cells in ECW/W and ECΔT10 mice. Incidence indicates the fraction of mice displaying metastatic lesions upon pathological analysis of liver cross sections. Scale bars, 500 μm. (N) Liver metastatic area in H&E staining 14 days after i.s. injection of 4T1-CD90.1 cells in Trail+/+ and Trail−/− mice. (O and P) Lung metastatic area in H&E staining 12 days after i.v. injection of E0771 cells in NK-specific TRAIL WT (NKW/W) and KO (NKΔT10) mice. Scale bars, 500 μm. (Q) mRNA expression of dLNGFR in perfused lung tissue after i.v. injection of E0771-dLNGFR cells in NKW/W and NKΔT10 mice. All graphs show means ± SEM. *P < 0.05; **P < 0.01; ***P < 0.001; ****P < 0.0001.
Fig. 4.
Fig. 4.. TRAIL expression is a trait of EC quiescence.
(A) mRNA expression of Tnfsf10 in ECs sorted from perfused lungs or primary tumors of E0771 tumor–bearing WT mice (day 14). (B and C) Histological analysis of vasculature (CD31; red), TRAIL (green), and autofluorescence (blue) in a metastatic lesion or its adjacent parenchymal tissue in postmortem lung samples from two patients with breast cancer. Dots in (C) represent the average intensity in 10 different fields (5 fields per patient). Arrowheads in (B) show colocalization of CD31 and TRAIL (yellow). Scale bars, 50 μm. (D to F) t-SNE plots showing the origin (distal versus proximal) or expression of indicated genes (D), violin plot showing expression levels (E), or the percentage of expressing (+) and nonexpressing (−) cells (F) in ECs from patient 3. (G) Immunofluorescence costaining of TRAIL (green), Ki-67 (magenta), and Hoechst (blue). Higher-resolution inset of confluent (A) or proliferative (Ki-67+) areas (B). Scale bar, 50 μm. (H to J) Protein levels of TRAIL in whole-cell extract (WCE), intracellular, or surface fractions of quiescent HUVECs (H); in supernatant protein precipitates or WCE of quiescent HUVECs treated with the pan-caspase inhibitor q-VD-OPh (qVD) (50 μM) for 18 hours (I); or in proliferating, dense, or quiescent HUVECs (5-ethynyl-2’-deoxyuridine, EdU) (J). In (H), VE-cadherin is the representative surface protein. (K) mRNA expression of TNFSF10 in proliferating, dense, or quiescent HUVECs. (L) Volcano plot showing TNFSF10 transcript distribution. Positive and negative log2 (fold change) values (x axis) represent up-regulation or down-regulation, respectively, in quiescent compared to proliferative HUVECs. Dots in blue represent significant differentially expressed genes. (M) mRNA expression of TNFSF10 in quiescent HUVECs treated with VEGF-A (50 ng/ml), bFGF (10 ng/ml), or PlGF-1 (50 ng/ml) for 17 hours. All graphs show means ± SEM. *P < 0.05; **P < 0.01; ***P < 0.001; ****P < 0.0001.
Fig. 5.
Fig. 5.. TRAIL expression is down-regulated by tumor-derived factors during PMN formation.
(A and B) mRNA expression of TNFSF10 in HUVECs treated for 24 hours with a conditioned medium (CM) of E0771 or 4T1 cancer cells for 48 hours and/or with sunitinib (1 μM). (C and D) FACS analysis of intracellular TRAIL protein in lung ECs from WT mice injected 12 times i.v. with a CM of E0771 cells overexpressing (OE) murine VEGF-A164 (C) or PlGF (D) for 48 hours. ΔMFI = MFIstained − MFIisotype. (E and F) mRNA expression of dLNGFR in perfused lung tissue 24 hours after i.v.injection of E0771-dLNGFR in WT mice injected 12 times i.v. with a CM of E0771 cells overexpressing VEGF-A164 (E) or PlGF (F) for 48 hours. Vehicle represents a mock medium, pseudo-conditioned in absence of cancer cells. (G) mRNA expression of Ly6g, S100a8, S100a9, Cd68, Emr1, and dLNGFR in perfused lung tissue from WT mice after orthotopic m.f.p. injection of E0771-dLNGFR cells. (H to K) Histological analysis of Ly-6G+ neutrophil area (H and I) and F4/80+ macrophage area (J and K) in tumor-free (TF) WT mice or tumor-bearing (TB) WT mice 10 days after orthotopic m.f.p. injection of E0771-dLNGFR cells. Scale bars, 50 μm. (L) mRNA expression of Tnfsf10 and dLNGFR in perfused lung tissue from WT mice after orthotopic m.f.p. injection of E0771-dLNGFR cells. FC, fold change. (M) FACS analysis of intracellular TRAIL protein in lung ECs from tumor-free WT mice or 10 days after orthotopic m.f.p. injection of E0771-dLNGFR cells. ΔMFI = MFIstained − MFIisotype. All graphs show means ± SEM. *P < 0.05; **P < 0.01; ##P < 0.01; ****P < 0.0001.
Fig. 6.
Fig. 6.. EC-specific depletion of TRAIL triggers apoptosis.
(A) FACS analysis of viable [annexin V propidium iodide (PI)] HUVECs treated with SuperKillerTRAIL (recTRAIL; 100 ng/ml), pan-caspase inhibitor qVD (50 μM), or caspase-8–specific inhibitor zIETD (50 μM) for 5 days. (B) Protein levels of pro–caspase-8, cleaved caspase-8 (clCasp8), pro–caspase-3, cleaved caspase-3 (clCasp3), and TRAIL in shSCR or shTRAIL HUVECs. For each time point, the densitometry fold change of shTRAIL toward shSCR is indicated. (C and D) Time-dependent analysis of cell death by cytotox incorporation in shSCR and shTRAIL HUVECs treated with qVD (50 μM; green line) or zIETD (100 μM; blue line) since day 1. Representative images at 34 hours (D). (E) Analysis of viable (annexin V PI) shSCR and shTRAIL HUVECs at day 3 treated with qVD (20 μM) since day 1. (F) Protein levels of pro–caspase-8, cleaved caspase-8, pro–caspase-3, cleaved caspase-3, and TRAIL in shSCR and shTRAIL HUVECs at day 5 treated with qVD (50 μM) since day 0. (G) TEER measurement and mRNA expression of TNFSF10 of shSCR and shTRAIL HUVEC monolayers. (H and I) FACS analysis of the percentage of dead blood vessel ECs (BECs; CD45CD31+PDPN) in perfused lungs from tumor-free induced ECW/W and ECΔT10 mice. In (I), anti-CD31 (αCD31)–conjugated LNP/empty or anti-CD31–LNP/Trail (8 μg per mouse) was injected i.v. 48 and 24 hours before cancer cell injection, and statistical significance was calculated by one-tailed unpaired t test. (J) GSEA enrichment plots showing the comparison of the gene expression profiles in lung ECs sorted from tumor-free induced ECW/W and ECΔT10 mice. NES, normalized enrichment score. (K and L) Protein levels of fibronectin and TRAIL in perfused lung tissue lysates of tumor-free induced ECW/W and ECΔT10 mice. (M) mRNA expression of Fn1 (fibronectin) and dLNGFR in perfused lung tissue from WT mice after orthotopic m.f.p. injection of E0771-dLNGFR cells. All graphs show means ± SEM. *P < 0.05; **P < 0.01; ***P < 0.001; ****P < 0.0001.
Fig. 7.
Fig. 7.. EC-specific depletion of TRAIL favors a proinflammatory state that facilitates leukocyte and cancer cell adhesion.
(A) mRNA expression of indicated genes in lung ECs sorted from tumor-free induced ECW/W and ECΔT10 mice. (B) FACS analysis of the percentage of adhesive ECs [vascular cell adhesion molecule–1+ (VCAM1+) E-Selectin+ ICAM1high] in perfused lungs from tumor-free induced ECW/W and ECΔT10 mice. (C to I) t-SNE plots showing the origin (distal versus proximal) or expression of indicated genes (C), violin plot showing expression levels (D, F, and H), or the percentage of expressing (+) and nonexpressing (−) cells (E, G, and I) in ECs from patient 3. (J and K) mRNA expression of SELE (J) and ICAM1 (K) in shSCR and shTRAIL HUVECs at day 3 treated with qVD (50 μM) since day 0. (L) Protein levels of ICAM1 and E-Selectin in shSCR and shTRAIL HUVECs. For each time point, the densitometry fold change of shTRAIL toward shSCR is indicated. TRAIL knockdown efficiency is shown in Fig. 6B. (M and N) E0771 or 4T1 cells (M) or white blood cells (WBC) (N) adhered to shSCR and shTRAIL HUVEC monolayers at day 6 after 1 hour of contact. (O to U) FACS analysis of the percentage or number of immune cells (O and P), myeloid cells excluding alveolar macrophages (AMs) (Q and R), neutrophils (S and T), and AM (U) in perfused lungs from tumor-free induced ECW/W and ECΔT10 mice. (V to X) mRNA expression of dLNGFR in perfused lung tissue (V), number of cancer cells (W), and representative images (X) showing tdTomato+ cancer cells (magenta) and 4′,6-diamidino-2-phenylindole (DAPI) (blue) in lungs 24 hours after i.v. injection of E0771-dLNGFR-tdTomato cells in induced ECW/W and ECΔT10 mice. Anti-ICAM1 and anti–E-Selectin blocking antibodies (each 10 mg/kg) or immunoglubulin G (IgG) control (20 mg/kg) were injected intravenously 3 hours before cancer cell injection. Scale bars, 250 μm. All graphs show means ± SEM. *P < 0.05; **P < 0.01; ***P < 0.001; ****P < 0.0001.
Fig. 8.
Fig. 8.. Activation of p38 and NF-κB underlies the proadhesive state of the endothelium upon TRAIL depletion.
(A) Protein levels of p38 (total and ph-Thr180/Tyr182) and IκBα (total and ph-Ser32/36) in shSCR or shTRAIL HUVECs. For each time point, the densitometry fold change of shTRAIL toward shSCR is indicated. For TRAIL knockdown efficiency, see Fig. 6B. (B) Immunofluorescence staining of NF-κB (green) and Hoechst (blue) in shSCR or shTRAIL HUVECs. Scale bars, 20 μm. (C and D) GSEA enrichment plots showing the comparison of the gene expression profiles in lung ECs sorted from tumor-free induced ECW/W and ECΔT10 mice. (E) Coimmunoprecipitation (co-IP) of DR4, DR5, or IgG control in HUVECs at day 3, showing protein levels of IKKα, ΙΚΚβ, caspase-8, RIP1, NEMO, FADD, DR4, DR5, and TRAIL. Input = WCE. (F) Protein levels of p38 (total and ph-Thr180/Tyr182) and total IκBα in shSCR and shTRAIL HUVECs at day 5 treated with the pan-caspase inhibitor qVD (50 μM) since day 0. For TRAIL knockdown efficiency and caspase cleavage inhibition, see Fig. 6F. (G to J) mRNA expression of ICAM1 (G and I) and SELE (H and J) in shSCR and shTRAIL HUVECs at day 6 treated either with the IκB inhibitor IKK-16 (NF-κBi; 2,5 μM) (G and H) or with the p38 inhibitor SB203580 (p38i; 10 μM) (I and J) since day 4. (K and L) Protein levels of ICAM1, E-Selectin, and TRAIL in shSCR and shTRAIL HUVECs at day 6 treated either with NF-κBi (2.5 or 5 μM) (K) or with p38i (1 or 10 μM) (L) since day 4. (M and N) E0771 cancer cells adhered to shSCR and shTRAIL HUVEC monolayers at day 6 after 1 hour of contact. HUVECs were treated either with NF-κBi (2.5 μM) for 24 hours (M) or with p38i (10 μM) for 48 hours (N). All graphs show means ± SEM. *P < 0.05; **P < 0.01; ***P < 0.001; ****P < 0.0001.
Fig. 9.
Fig. 9.. Endothelial DR5 favors metastatic spread.
(A) mRNA expression of Tnfrsf10b in cells sorted from perfused lungs of tumor-free WT mice. (B) FACS analysis of DR5 protein on lung BECs from tumor-free induced EC-specific DR5 WT (ECW/W) or KO (ECΔDR5) mice. (C and D) Number of ink-contrasted lung metastasis 12 days after i.v. injection of E0771 cells in induced ubiquitous DR5 WT (R26W/W) or KO (R26ΔDR5) (C) or ECW/W and ECΔDR5 mice (D). (E and F) mRNA expression of dLNGFR in perfused lung tissue after i.v. injection of E0771-dLNGFR cells in induced ECW/W, ECΔDR5, ECΔT10, or EC-specific TRAIL and DR5 double KO mice (ECΔT10ΔDR5) mice. Figure 3I previously showed dataset relative to ECΔT10. (G to L) FACS analysis of the percentage of dead BECs (G and H), immune cells (I and J), and neutrophils (K and L) in perfused lungs from tumor-free induced ECW/W, ECΔDR5, or ECΔT10ΔDR5 mice. Figures 6H and 7 (O, P, S, and T) previously showed datasets relative to ECΔT10. (M) mRNA expression of indicated genes in lung ECs sorted from tumor-free induced ECW/W and ECΔT10ΔDR5 mice. (N) Protein levels of DR4 and DR5 in WCE, intracellular, or surface fractions in quiescent HUVECs. VE-cadherin is the representative surface protein. (O) Co-IP of DR5, TRAIL, or IgG control in quiescent HUVECs. Input = WCE. (P) Proximity ligation assay (PLA) between TRAIL and DR5 (red), VE-cadherin (green), and Hoechst (blue) in HUVECs. Scale bar, 10 μm. (Q and R) FACS analysis of extracellular DR5 protein on lung BECs from induced ECW/W and ECΔT10 mice. In (R), anti-CD31 (αCD31)–conjugated LNP/empty or anti-CD31–LNP/Trail (8 μg per mouse) was injected i.v. 48 and 24 hours before cancer cell injection, and statistical significance was calculated by one-tailed unpaired t test. ΔMFI = MFIstained − MFIFMO. All graphs show means ± SEM. **P < 0.01; ***P < 0.001; ****P < 0.0001.
Fig. 10.
Fig. 10.. Endogenous TRAIL DcRs favor metastatic spread.
(A) Number of ink-contrasted lung metastasis 12 days after i.v. injection of E0771 cells in constitutive DcR1/2 WT (Dcr1/2+/+) and KO (Dcr1/2−/−) mice. (B and C) mRNA expression of Tnfrsf23 (DcR1) (B) and Tnfrsf22 (DcR2) (C) in ECs, NK cells, CD8+ T cells, and neutrophils sorted from perfused lungs of tumor-free WT mice. (D) Number of ink-contrasted lung metastasis 11 days after i.v. injection of E0771 cells in chimeras obtained from the reciprocal bone marrow transplantation of constitutive DcR1/2 WT (Dcr1/2+/+) and KO (Dcr1/2−/−) mice. Arrows indicate genotypes of the bone marrow donor → recipient mice. (E and F) Graphical abstract. (E) Steady-state, high TRAIL in ECs. In steady state, endothelial TRAIL holds DR5 intracellularly and prevents its activation in quiescent ECs, thereby supporting cell survival, quiescence, and a resting anti-inflammatory/antiadhesive state. Together, this ensures the stability of the vascular barrier. (F) PMN, low TRAIL in ECs. Tampering with TRAIL in the PMN by transcriptional down-regulation in response to tumor-derived factors (i.e., VEGF-A, PlGF, and others) or by DcR-mediated entrapment liberates DR5. The increased availability of DR5 at the cell surface is sufficient to trigger its activation in a ligand-independent manner. As a result, vascular integrity is compromised by the occurring EC apoptosis and NF-κB/p38–mediated stickiness, favoring immune cell recruitment and ICAM1/E-Selectin–mediated cancer cell adhesion. Together, this process promotes cancer cell dissemination and metastasis in distant organs. All graphs show means ± SEM. *P < 0.05; **P < 0.01.
Description

References

    1. P. S. Steeg, Targeting metastasis. Nat. Rev. Cancer 16, 201–218 (2016). - PMC - PubMed
    1. L. Bejarano, M. J. C. Jordāo, J. A. Joyce, Therapeutic targeting of the tumor microenvironment. Cancer Discov. 11, 933–959 (2021). - PubMed
    1. J. Fares, M. Y. Fares, H. H. Khachfe, H. A. Salhab, Y. Fares, Molecular principles of metastasis: A hallmark of cancer revisited. Signal Transduct. Target. Ther. 5, 28 (2020). - PMC - PubMed
    1. N. Wettschureck, B. Strilic, S. Offermanns, Passing the vascular barrier: Endothelial signaling processes controlling extravasation. Physiol. Rev. 99, 1467–1525 (2019). - PubMed
    1. D. Hanahan, Hallmarks of cancer: New dimensions. Cancer Discov. 12, 31–46 (2022). - PubMed

MeSH terms

Substances