. 2023:38:103377.
doi: 10.1016/j.nicl.2023.103377. Epub 2023 Mar 15.

Neurovascular coupling is preserved in chronic stroke recovery after targeted photothrombosis

Affiliations

Neurovascular coupling is preserved in chronic stroke recovery after targeted photothrombosis

Smrithi Sunil et al. Neuroimage Clin. 2023.

Abstract

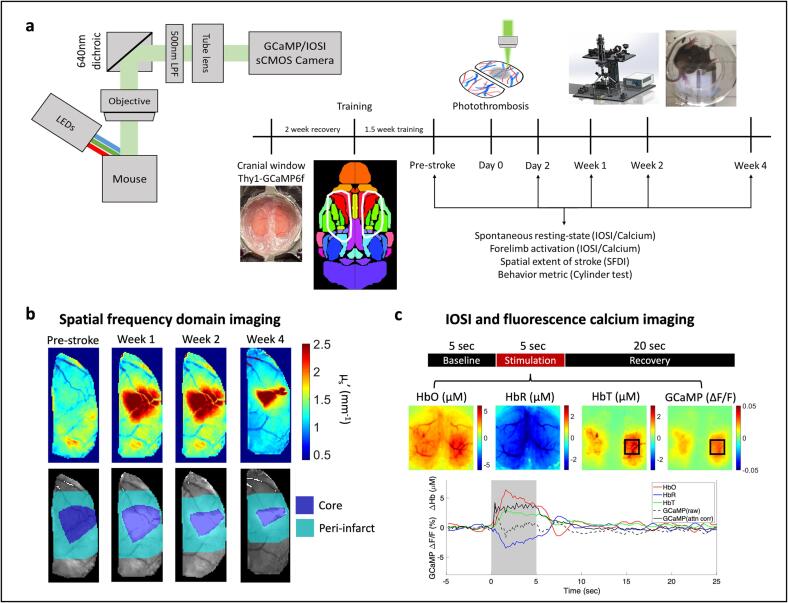
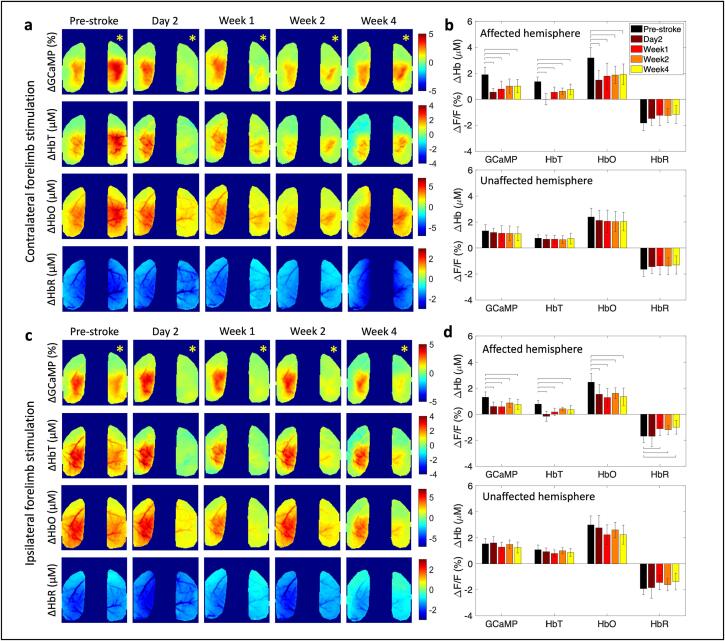
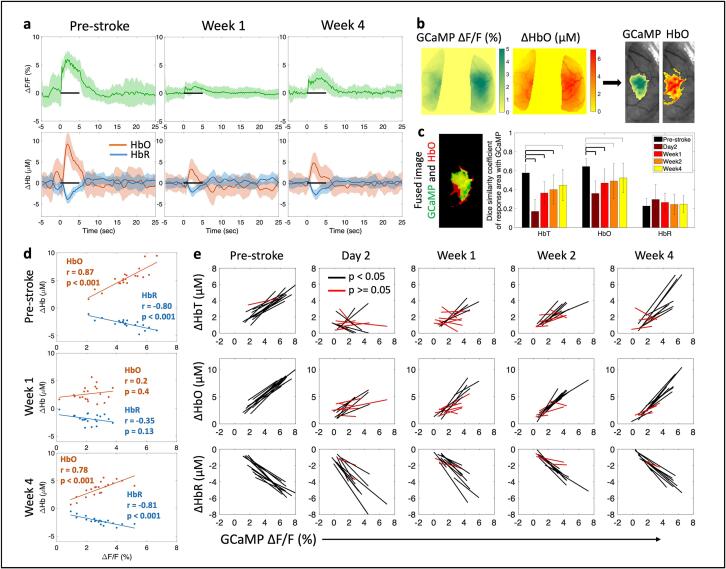
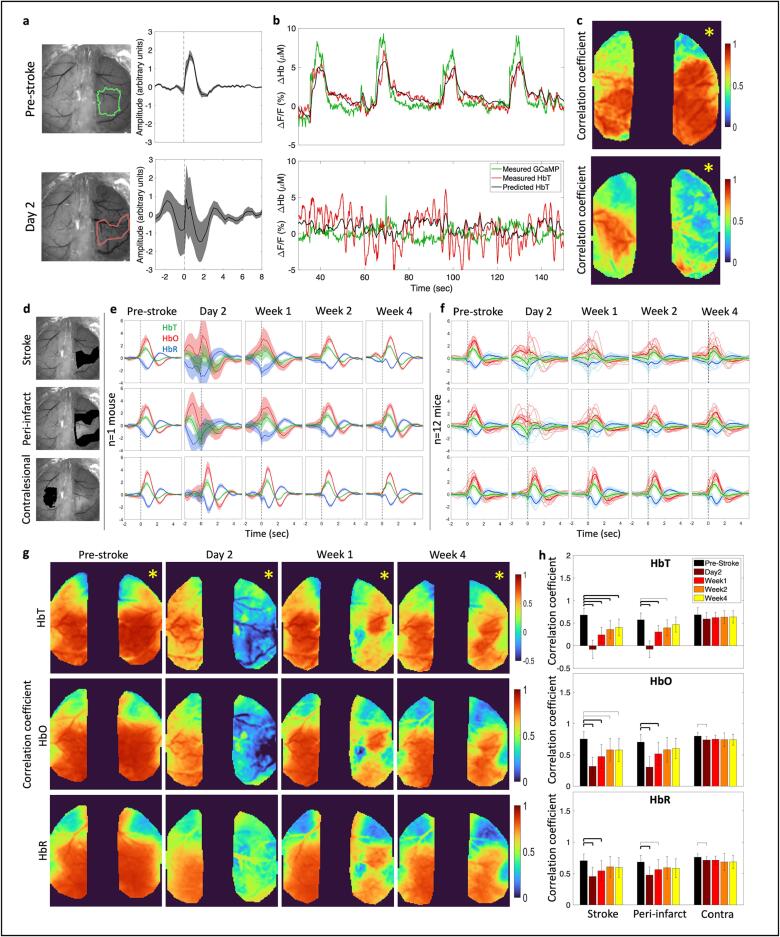
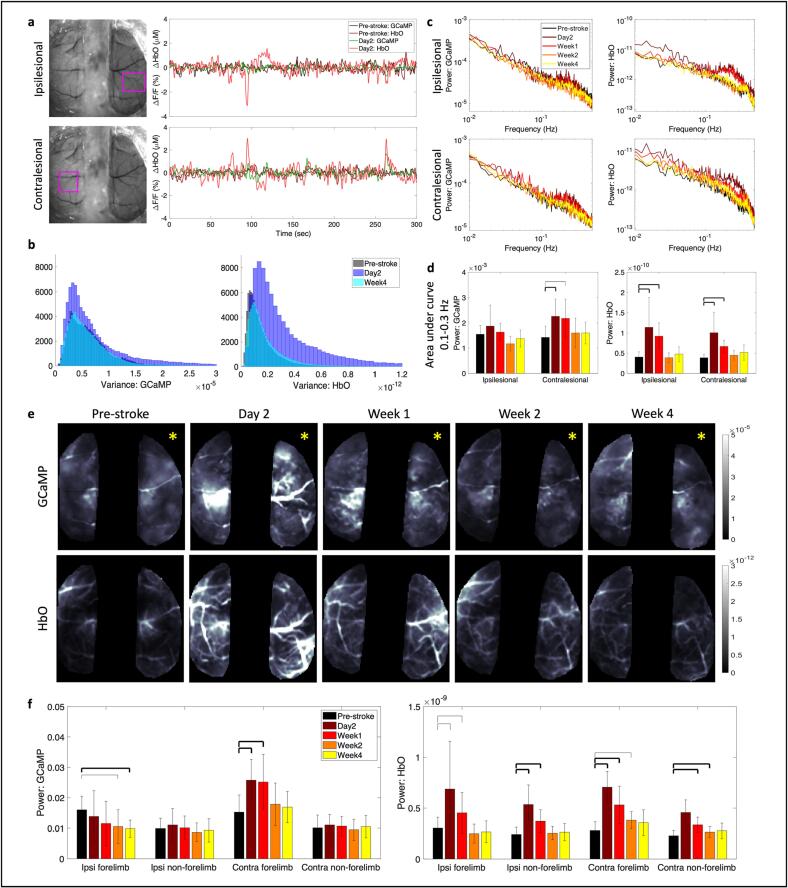
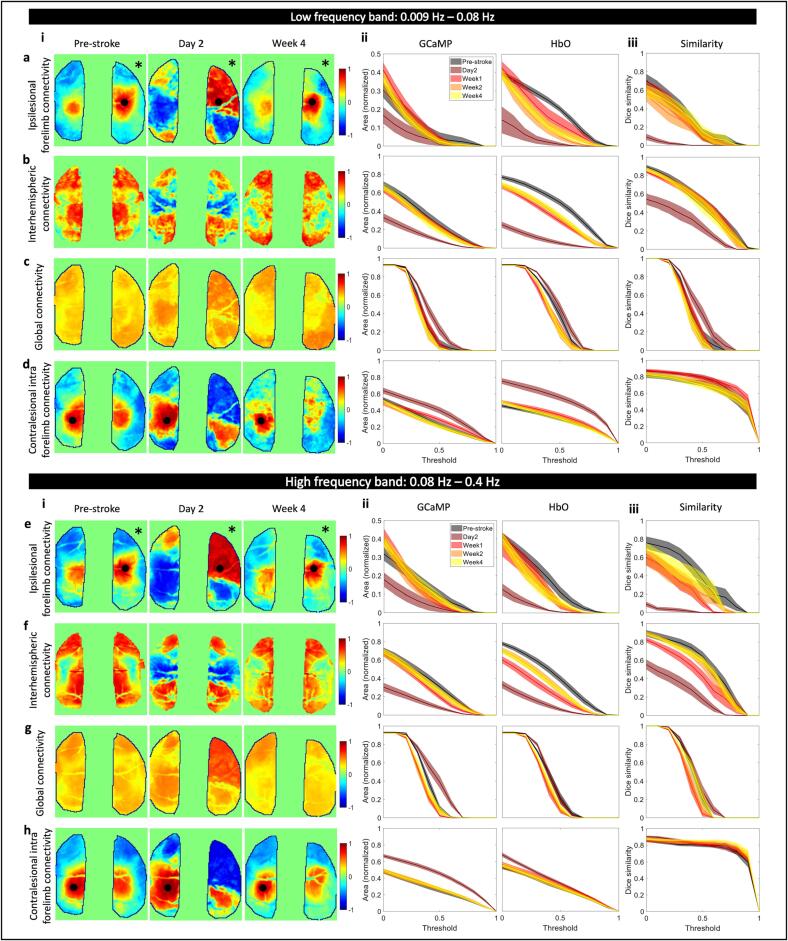
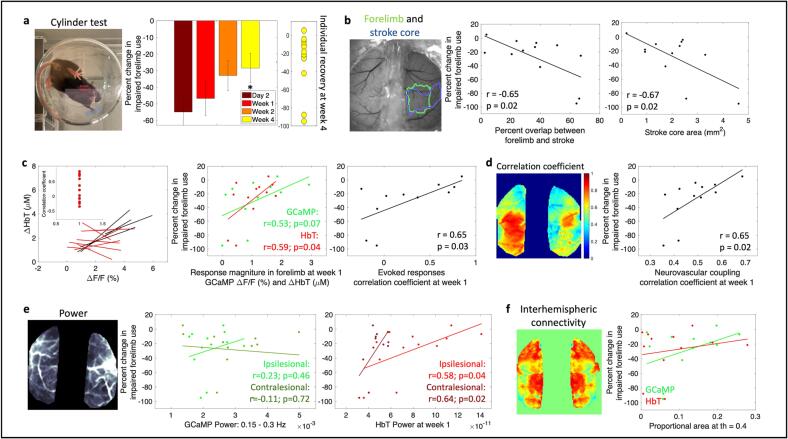
Functional neuroimaging, which measures hemodynamic responses to brain activity, has great potential for monitoring recovery in stroke patients and guiding rehabilitation during recovery. However, hemodynamic responses after stroke are almost always altered relative to responses in healthy subjects and it is still unclear if these alterations reflect the underlying brain physiology or if the alterations are purely due to vascular injury. In other words, we do not know the effect of stroke on neurovascular coupling and are therefore limited in our ability to use functional neuroimaging to accurately interpret stroke pathophysiology. To address this challenge, we simultaneously captured neural activity, through fluorescence calcium imaging, and hemodynamics, through intrinsic optical signal imaging, during longitudinal stroke recovery. Our data suggest that neurovascular coupling was preserved in the chronic phase of recovery (2 weeks and 4 weeks post-stoke) and resembled pre-stroke neurovascular coupling. This indicates that functional neuroimaging faithfully represents the underlying neural activity in chronic stroke. Further, neurovascular coupling in the sub-acute phase of stroke recovery was predictive of long-term behavioral outcomes. Stroke also resulted in increases in global brain oscillations, which showed distinct patterns between neural activity and hemodynamics. Increased neural excitability in the contralesional hemisphere was associated with increased contralesional intrahemispheric connectivity. Additionally, sub-acute increases in hemodynamic oscillations were associated with improved sensorimotor outcomes. Collectively, these results support the use of hemodynamic measures of brain activity post-stroke for predicting functional and behavioral outcomes.

Keywords: Intrinsic optical signal imaging; Neurovascular coupling; Photothrombosis; Stroke recovery.


Conflict of interest statement

Declaration of Competing Interest The authors declare that they have no known competing financial interests or personal relationships that could have appeared to influence the work reported in this paper.

Figures

Fig. 1
Fig. 1
Multimodal imaging of neurovascular coupling for monitoring longitudinal stroke recovery. (a) Simplified imaging schematic and experimental timeline. Note: Imaging schematic only shows green light reflected for convenience, however, all reflected light between 500mn and 640 nm is captured by the camera. (b) SFDI. Top: Tissue scattering coefficients at each time point. Bottom: Stroke core and peri-infarct regions for the above images. (c) Sensory stimulation with IOSI. Top: Block design of each trial in a stimulation session, middle: trial averaged spatial maps of HbO, HbR, HbT, and corrected GCaMP, during 5 sec of air-puff stimulation to the left forelimb, bottom: trial averaged time course of each measurement, note that raw uncorrected GCaMP drops immediately following the rise of the hemodynamic response and corrected GCaMP shows elevated responses through the full stimulation period. (For interpretation of the references to colour in this figure legend, the reader is referred to the web version of this article.)
Fig. 2
Fig. 2
Simultaneous calcium and hemodynamic imaging post-stroke. (a) Trial-averaged spatial maps of calcium and hemodynamics showing magnitude of the response during 5-sec stimulation of the contralateral (affected) forelimb at each time point before and after stroke in one example mouse. (b) Response magnitudes during affected forelimb stimulation for all mice (n = 12) in the affected (top) and unaffected (bottom) hemispheres, histograms are mean ± std. (c) Same as in (a) during stimulation of the ipsilateral (unaffected) forelimb. (d) Same as in (b) during stimulation of the ipsilateral (unaffected) forelimb. A two-sample t-test was run for all statistical tests. Bars in (b) and (d) indicate significance of p < 0.05. Yellow asterisk indicates stroke hemisphere. (For interpretation of the references to colour in this figure legend, the reader is referred to the web version of this article.)
Fig. 3
Fig. 3
Correlation between evoked calcium and hemodynamic responses. (a) Trial-averaged time-course showing mean (±std) of GCaMP (top) and HbO and HbR (bottom) for all pixels within the affected hemisphere at the pre-stroke baseline, 1 week, and 4 weeks post-stroke. Note the drop in response to stimulation (black bar) at week 1. (b) Threshold algorithm applied to GCaMP and Hb responses. (c) Overlap between the response area of GCaMP and HbO, left: single trial fused image for reference, GCaMP is green, HbO is red, and overlap region is yellow, right: Dice similarity coefficients across all mice (n = 12) and time points. Thick bars: p < 0.01, thin bars: p < 0.05. (d) Correlation of response magnitudes between GCaMP and HbO and HbR for one mouse at pre-stroke, week 1, and week 4. Inset numbers represent correlation value and significance of fit. (e) Correlation of calcium and hemodynamics across all mice (n = 12) over all time points; each line represents one mouse. A two-sample t-test was run for all statistical tests. Black lines represent significant correlation and red lines represent no significance. (For interpretation of the references to colour in this figure legend, the reader is referred to the web version of this article.)
Fig. 4
Fig. 4
Neurovascular coupling with linear least-squares deconvolution. (a) Hemodynamic response function (HRF) before (top) and 2 days after stroke (bottom) in the forelimb and stroke regions outlined in green and red respectively. (b) Time course of 4 stimulation trials showing measured GCaMP signal overlaid with measured HbT and predicted HbT, obtained by convolving the GCaMP signal with the HRF kernel, at pre-stroke and day 2 for the regions outlined in (a). (c) Pearson’s correlation coefficient for measured HbT and predicted HbT for pre-stroke (top) and 2 days after stroke (bottom). (d) Regions used to extract HRF in (e) and (f). (e) HRF obtained by deconvolution model for HbT, HbO, and HbR, for one example mouse at each time point before and after stroke. Note the deviation in HRF compared to pre-stroke in the acute phase within the stroke and peri-infarct, and a return to pre-stroke HRF at week 4. (f) Same as in (e) for all mice (n = 12). Each line represents the HRF for one mouse. (g) Pixel-by-pixel Pearson’s correlation coefficient between measured and predicted HbT (top), HbO (middle), and HbR (bottom). Predicted HbX is obtained by convolving the GCaMP signal at each time point with a mean HRF obtained from pre-stroke data. (h) Pearson’s correlation coefficient quantified across all mice within the stroke core, peri-infarct, and contralesional forelimb region. A two-sample t-test was run for all statistical tests. Thick bars: p < 0.01, thin bars: p < 0.05. Note the sustained reduction of correlation coefficient within the stroke core but recovery within the peri-infarct for HbT and HbO. Yellow asterisk indicates stroke hemisphere. (For interpretation of the references to colour in this figure legend, the reader is referred to the web version of this article.)
Fig. 5
Fig. 5
Global brain oscillations following stroke. (a) Raw time traces of filtered (0.009–0.4 Hz) calcium and hemodynamic signals before and 2 days after stroke within the ipsilesional (top) and contralesional (bottom) hemispheres in ROI marked with pink box. Note the increase in amplitude of HbO in both hemispheres at day 2 and increase in GCaMP amplitude only in the contralesional hemisphere. (b) Histogram of variance in the mean signal, after global signal regression, for GCaMP (left) and HbO (right) at pre-stroke, day 2, and week 4. (c) Frequency spectrum of the power of the GCaMP (left) and HbO (right) signal in the ipsilesional (top) and contralesional (bottom) hemispheres. (d) Area under the curve within 0.1–0.3 Hz frequency band. Thick bars: p < 0.01, thin bars: p < 0.05. (e) Spatial maps of average power across 0.009–0.4 Hz frequency band for GCaMP (top) and HbO (bottom) at each time point. Yellow asterisk indicates the stroke hemisphere. (f) Mean power assessed in each hemisphere within the forelimb and non-forelimb areas. A two-sample t-test was run for all statistical tests. Thick bars: p < 0.01, thin bars: p < 0.05. (For interpretation of the references to colour in this figure legend, the reader is referred to the web version of this article.)
Fig. 6
Fig. 6
Global brain network dynamics assessed with RSFC. Spatial maps of ipsilesional forelimb connectivity (a(i),e(i)), interhemispheric connectivity (b(i),f(i)), global connectivity (c(i),g(i)), and contralesional forelimb connectivity (d,h) in the low frequency band (a,b,c,d) and the high frequency band (e,f,g,h) at pre-stroke, day 2, and week 4. Proportional area of cortex over threshold for GCaMP and HbO at each time point for ipsilesional forelimb connectivity (a(ii),e(ii)), interhemispheric connectivity (b(ii),f(ii)), global connectivity (c(ii),g(ii)), and contralesional forelimb connectivity (d(ii),h(ii)) in the low frequency band (a,b,c,d) and in the high frequency band (e,f,g,h). Dice similarity coefficient for overlap between area covered by GCaMP and HbO for ipsilesional forelimb connectivity (a(iii),e(iii)), interhemispheric connectivity (b(iii),f(iii)), global connectivity (c(iii),g(iii)), and contralesional intrahemispheric forelimb connectivity (d(iii),h(iii)) at all time points in the low frequency band (a,b,c,d) and the high frequency band (a,b,c,d). Black asterisk indicates the stroke hemisphere.
Fig. 7
Fig. 7
Correlating cortical metrics to behavior outcomes. (a) Forelimb asymmetry, assessed with the cylinder test, calculated as a change in impaired forelimb use from pre-stroke, right: recovery of individual mice at week 4. (b) Left: reference image showing outlines of pre-stroke forelimb region and stroke core at 1 week, middle: correlation between overlap of forelimb and stroke with forelimb asymmetry at week 4, right: correlation between stroke area and forelimb asymmetry at week 4. (c) Left: correlation of evoked responses of GCaMP and HbT, middle: correlation between response magnitude at week 1 for GCaMP and HbT with forelimb asymmetry at week 4, right: correlation between the correlation coefficient of evoked responses at week 1 and forelimb asymmetry at week 4. (d) Left: correlation coefficient between measured HbT and HbT predicted by convolving GCaMP and IRF, right: correlation between neurovascular coupling correlation coefficient at week 1 and forelimb asymmetry at week 4. (e) Correlation between power of GCaMP and HbT in frequency band 0.15–0.3 Hz in the ipsilesional and contralesional hemispheres and forelimb asymmetry at week 4. (f) Correlation between resting state interhemispheric connectivity and forelimb asymmetry at week 4.

References

    1. Adaikkan, C. et al. Gamma Entrainment Binds Higher-Order Brain Regions and Offers Neuroprotection. Neuron 102, 929-943.e8 (2019). - PMC - PubMed
    1. Angels Font M., Arboix A., Krupinski J.A. Neurogenesis and Neuroplasticity in Ischemic Stroke. Curr. Cardiol. Rev. 2010;6:238–244. - PMC - PubMed
    1. Attwell D., Buchan A.M., Charpak S., Lauritzen M., MacVicar B.A., Newman E.A. Glial and neuronal control of brain blood flow. Nature. 2010;468(7321):232–243. - PMC - PubMed
    1. Balbi M., et al. Gamma frequency activation of inhibitory neurons in the acute phase after stroke attenuates vascular and behavioral dysfunction. Cell Rep. 2021;34 - PubMed
    1. Bauer A.Q., Kraft A.W., Wright P.W., Snyder A.Z., Lee J.-M., Culver J.P. Optical imaging of disrupted functional connectivity following ischemic stroke in mice. Neuroimage. 2014;99:388–401. - PMC - PubMed

Publication types