. 2023 Mar 21;4(3):100981.
doi: 10.1016/j.xcrm.2023.100981.

Sexual behavior shapes male genitourinary microbiome composition

Affiliations

Sexual behavior shapes male genitourinary microbiome composition

Evelyn Toh et al. Cell Rep Med. .

Abstract

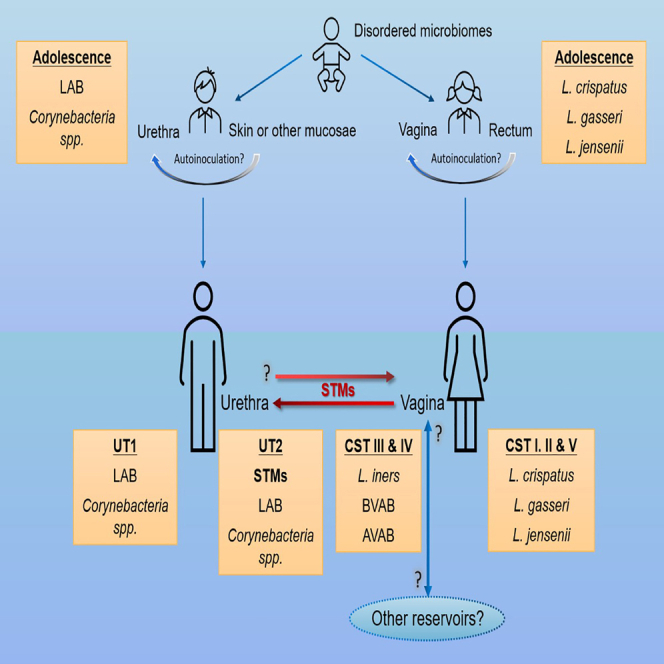
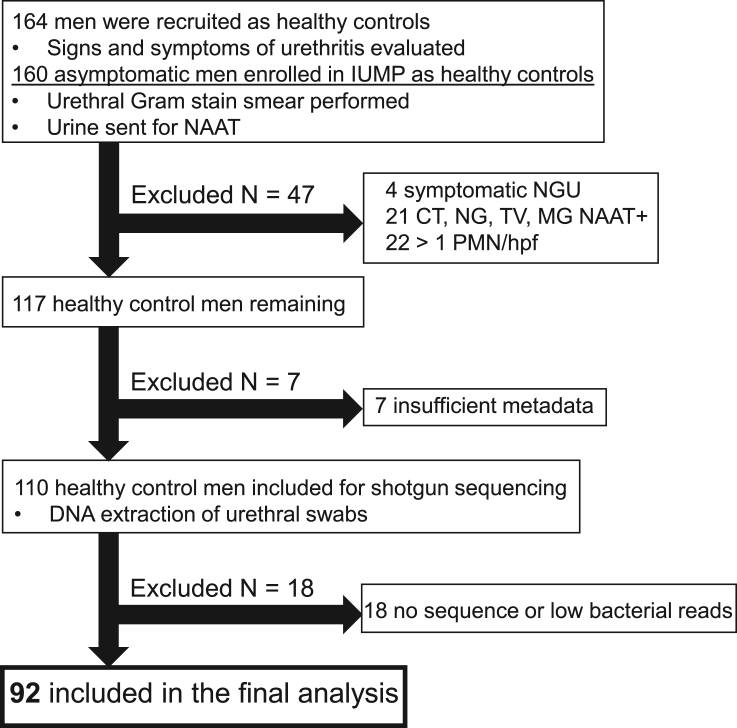
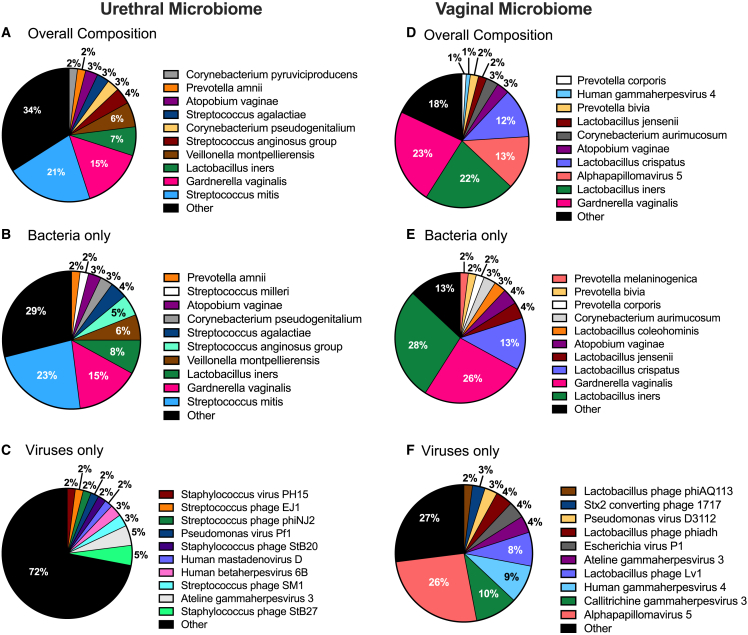
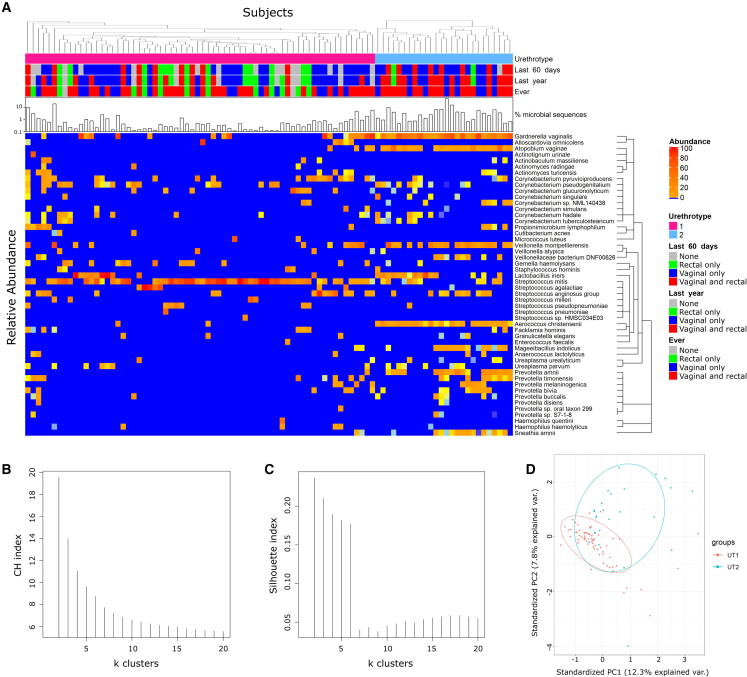
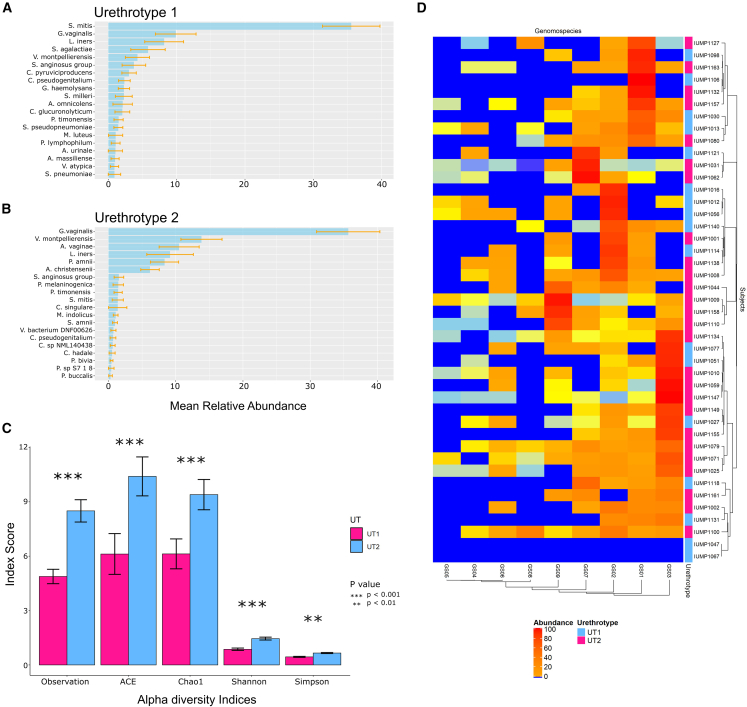
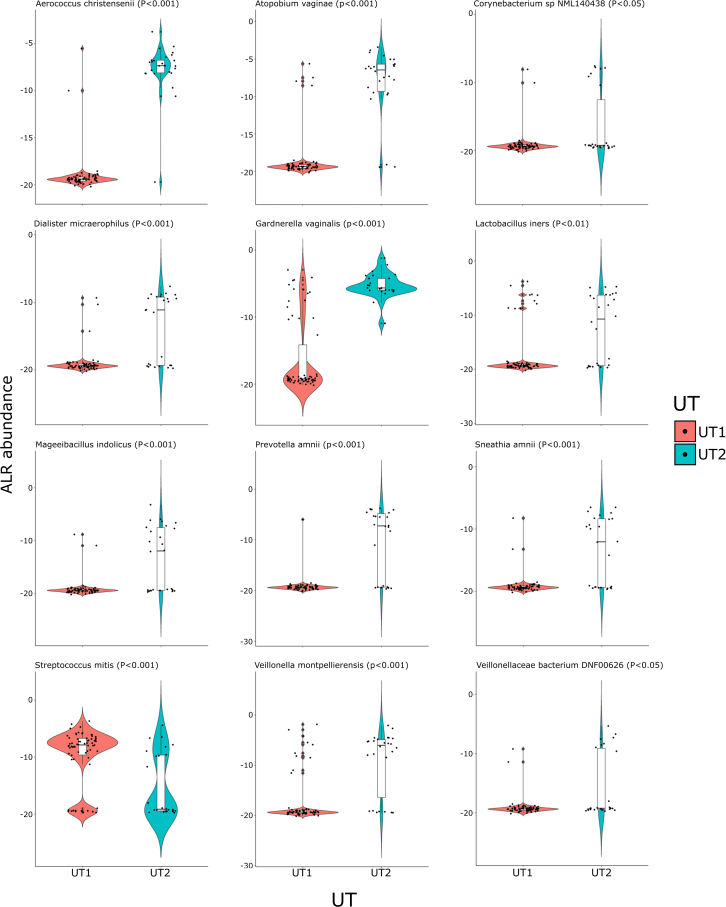
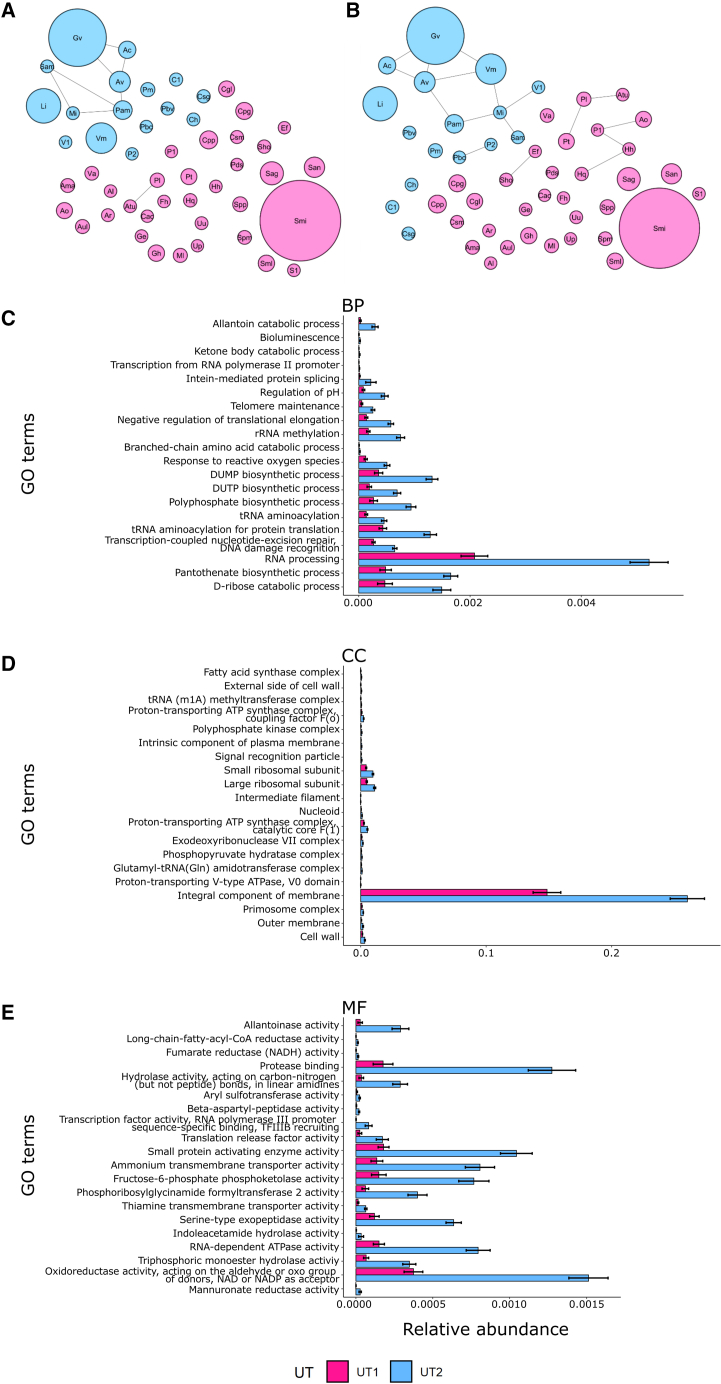
The origin, composition, and significance of the distal male urethral microbiome are unclear, but vaginal microbiome dysbiosis is linked to new sex partners and several urogynecological syndromes. We characterized 110 urethral specimens from men without urethral symptoms, infections, or inflammation using shotgun metagenomics. Most urethral specimens contain characteristic lactic acid bacteria and Corynebacterium spp. In contrast, several bacteria associated with vaginal dysbiosis were present only in specimens from men who reported vaginal intercourse. Sexual behavior, but not other evaluated behavioral, demographic, or clinical variables, strongly associated with inter-specimen variance in urethral microbiome composition. Thus, the male urethra supports a simple core microbiome that is established independent of sexual exposures but can be re-shaped by vaginal sex. Overall, the results suggest that urogenital microbiology and sexual behavior are inexorably intertwined, and show that the male urethra harbors female urogenital pathobionts.

Keywords: development; idiopathic; microbiome; microbiota; sexually transmitted infection; urethra; urethritis; urobiome.


Conflict of interest statement

Declaration of interests Y.X., X.G., T.A.B., B.V.D.P., N.G., L.J.F., J.D.F., and Q.D. have no conflicts of interest. S.J.J. has received honoraria and consulting fees from Hologic, Inc. E.T., J.A.W., and. D.E.N. retain the patent for the US_NmUC diagnostic assay used in this manuscript. C.A.M. is a consultant for Lupin Pharmaceuticals, BioFire Diagnostics, Cepheid, and PhagoMed. She has also received research funding support from Lupin Pharmaceuticals, Abbott Molecular, and Gilead as well as speaker honoraria from Abbott Molecular, Cepheid, Roche Diagnostics, and Becton Dickinson.

Figures

None
Graphical abstract
Figure 1
Figure 1
Study participant inclusion and exclusion flowchart Participants were excluded from this analysis if they had urethral discharge, tested positive for C. trachomatis, M. genitalium, N. gonorrhoeae, T. vaginalis, or urethrotropic Neisseria meningitidis strain US_NmUC, exhibited >1 polymorphonuclear leukocytes per high-power field (PMN/HPF) on their urethral Gram stain smear, reported antibiotic use in the past month, had genitourinary tract symptoms, or genital skin conditions.
Figure 2
Figure 2
Pie charts depicting percent composition of the top 10 most abundant PU microorganisms based on relative abundance “Other” includes all remaining taxa detected excluding the top 10 most abundant. Healthy controls: (A) overall microbial composition, (B) viruses only, (C) bacteria only; Vaginal specimens: (D) overall microbial composition, (E) viruses only, (F) bacteria only.
Figure 3
Figure 3
Clustering results based on Euclidian distance using ALR-transformed data reveals two urethrotype clusters (A–D) (A) Heatmap of ALR-transformed proportions of the top 50 most abundant microbial taxa found in the penile urethral specimens of 92 men reveals two urethrotype clusters, UT1 and UT2. Metadata at the top of the heatmap include type of sexual activity (none, rectal only, vaginal only, vaginal and rectal sex) conducted at specific time intervals (last 60 days, last 1 year, lifetime) and urethrotypes (UT1 = pink, UT2 = blue). The bar graph depicts the absolute abundance of microbial sequences on a log scale. The colored bar indicates the relative abundance of a given species. As the color bar becomes redder, the relative abundance of the microorganism increases, (B) CH index analysis and (C) Silhouette analysis was used to determine the optimal number of UT clusters. (D) Relationships among communities visualized by principal-component analysis based on bacterial ALR abundance.
Figure 4
Figure 4
Species diversity (richness) of UT1 and UT2 (A) Alpha diversity between UT1 and UT2 measured by various indices. Significant p values are indicated (∗∗p < 0.01, ∗∗∗p < 0.001). (B and C) (B) Top 20 most abundant bacterial species in UT1, (C) Top 20 most abundant bacterial species in UT2. Error bars indicate standard error. (D) Heatmap with hierarchal clustering by Euclidean distance depicting the percentage of unique Gardnerella genomospecies-specific reads in participants in whom Gardnerella sequences were detected by MetaPhlAn3
Figure 5
Figure 5
Violin plots showing the difference in ALR abundance of the 12 significant taxa between UT1 and UT2 The white bar represents the interquartile range, and the black bar represents the median value. Taxa with p value <0.05 were considered significantly different. The Wilcoxon Rank-Sum Test was used to generate the reported unadjusted p values. The violin plot outlines represent kernel probability density (the width of the shaded area represents the proportion of the data located there).
Figure 6
Figure 6
SPIEC-EASI network visualizations were generated by using two inference methods to construct a microbiome association network from all the bacterial operational taxonomic units (OTUs) (117) Each node diameter is proportional to the mean of that OTU’s relative abundance. Nodes are colored based on the urethrotype (UT1 = pink; UT2 = blue) in which the taxon is most abundant. Topology network using (A) graphical least absolute shrinkage and selection operator (Glasso), and (B) Meinshausen-Buhlmann’s neighborhood selection (MB). Edges indicate the two nodes are connected. Taxa definitions: Ac = Aerococcus christensenii; Al = Anaerococcus lactolyticus; Ama = Actinobaculum massiliense; Ao = Alloscardovia omnicolens; Ar = Actinomyces radingae; Atu = Actinomyces turicensis; Aul = Actinotignum urinale; Av = Atopobium vaginae; Cac = Cutibacterium acnes; Cgl = Corynebacterium glucuronolyticum; Ch = Corynebacterium hadale; Cpg = Corynebacterium pseudogenitalium; Cpp = Corynebacterium pyruviciproducens; Csm = Corynebacterium simulans; Csg = Corynebacterium singulare; C1 = Corynebacterium sp. NML140438; Ef = Enterococcus faecalis; Fh = Facklamia hominis; Ge = Gemella haemolysans; Gv = Gardnerella vaginalis; Hh = Haemophilus haemolyticus; Hq = Haemophilus quentini; Li = Lactobacillus iners; Mi = Mageeibacillus indolicus; Ml = Micrococcus luteus; Pam = Prevotella amnii; Pbv = Prevotella bivia; Pbc = Prevotella buccalis; Pds = Prevotella disiens; Pl = Propionimicrobium lymphophilum; Pm = Prevotella melaninogenica; P1 = Prevotella sp. oral taxon 299; P2 = Prevotella sp. S7 18; Pt = Prevotella timonensis; Sag = Streptococcus agalactiae; Sam = Sneathia amnii; San = Streptococcus anginosis group; Sho = Staphylococcus hominis; Sml = Streptococcus milleri; Smi = Streptococcus mitis; Spm = Streptococcus pneumoniae; Spp = Streptococcus pseudopneumoniae; S1 = Streptococcus sp. HMSC034E03; Up = Ureaplasma parvum; Uu = Ureaplasma urealyticum; Va = Veillonella atypica; V1 = Veillonellaceae bacterium DNF00626; Vm = Veillonella montpellierensis. (C–E) Relative abundance of top 20 significant gene ontology (GO) terms in UT1 and UT2 generated with HUMAnN 3.0 (all p values <0.001). GO terms were mapped from the gene families in the output, and the same GO terms of different taxa were combined. Wilcoxon signed rank test was used to identify the differentially abundant GO terms between UT1 and UT2, and the GO terms were ordered by p value. GO definitions: BP = Biological process; CC = Cellular component; MF = Molecular function.

Comment in

References

    1. Pudney J., Anderson D. Innate and acquired immunity in the human penile urethra. J. Reprod. Immunol. 2011;88:219–227. doi: 10.1016/j.jri.2011.01.006. - DOI - PMC - PubMed
    1. Moi H., Blee K., Horner P.J. Management of non-gonococcal urethritis. BMC Infect. Dis. 2015;15:294. doi: 10.1186/s12879-015-1043-4. - DOI - PMC - PubMed
    1. Pickard J.M., Zeng M.Y., Caruso R., Núñez G. Gut microbiota: role in pathogen colonization, immune responses, and inflammatory disease. Immunol. Rev. 2017;279:70–89. doi: 10.1111/imr.12567. - DOI - PMC - PubMed
    1. Ma B., Forney L.J., Ravel J. Vaginal microbiome: rethinking health and disease. Annu. Rev. Microbiol. 2012;66:371–389. doi: 10.1146/annurev-micro-092611-150157. - DOI - PMC - PubMed
    1. Dong Q., Nelson D.E., Toh E., Diao L., Gao X., Fortenberry J.D., Van der Pol B. The microbial communities in male first catch urine are highly similar to those in paired urethral swab specimens. PLoS One. 2011;6:e19709. doi: 10.1371/journal.pone.0019709. - DOI - PMC - PubMed

Publication types

LinkOut - more resources