. 2023 May 2;35(5):821-836.e7.
doi: 10.1016/j.cmet.2023.03.008. Epub 2023 Mar 21.

Epigenetic dosage identifies two major and functionally distinct β cell subtypes

Affiliations

Epigenetic dosage identifies two major and functionally distinct β cell subtypes

Erez Dror et al. Cell Metab. .

Abstract

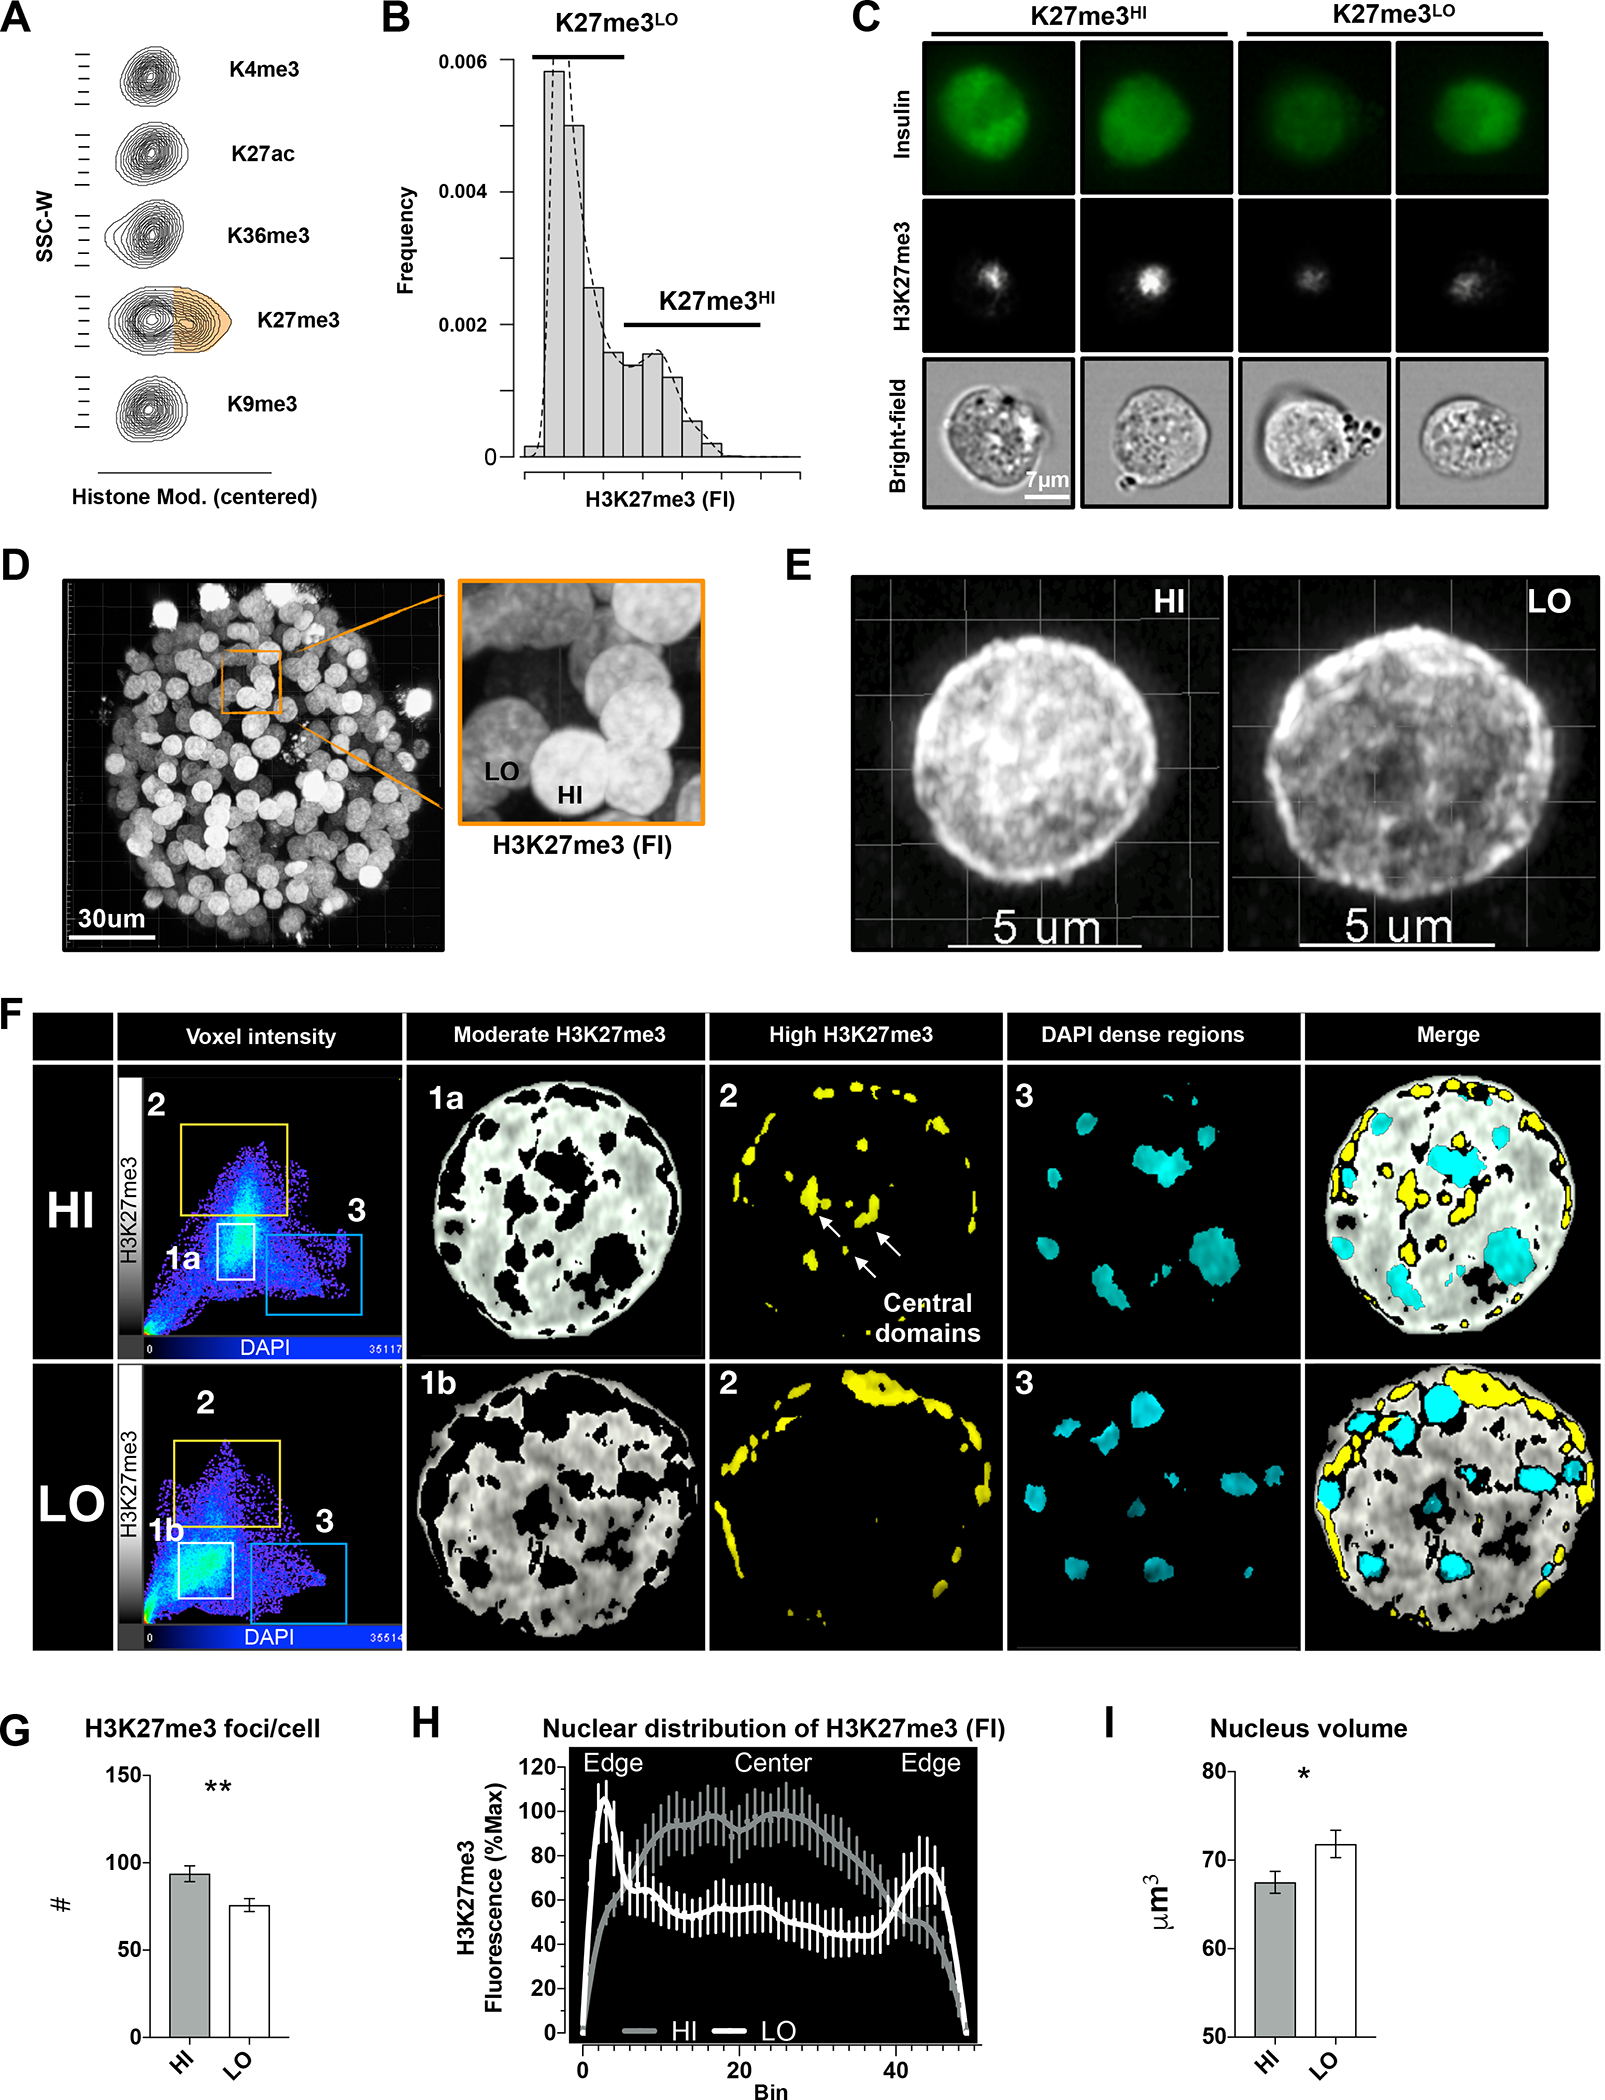
The mechanisms that specify and stabilize cell subtypes remain poorly understood. Here, we identify two major subtypes of pancreatic β cells based on histone mark heterogeneity (βHI and βLO). βHI cells exhibit ∼4-fold higher levels of H3K27me3, distinct chromatin organization and compaction, and a specific transcriptional pattern. βHI and βLO cells also differ in size, morphology, cytosolic and nuclear ultrastructure, epigenomes, cell surface marker expression, and function, and can be FACS separated into CD24+ and CD24- fractions. Functionally, βHI cells have increased mitochondrial mass, activity, and insulin secretion in vivo and ex vivo. Partial loss of function indicates that H3K27me3 dosage regulates βHILO ratio in vivo, suggesting that control of β cell subtype identity and ratio is at least partially uncoupled. Both subtypes are conserved in humans, with βHI cells enriched in humans with type 2 diabetes. Thus, epigenetic dosage is a novel regulator of cell subtype specification and identifies two functionally distinct β cell subtypes.

Keywords: H3K27me3; beta cells; bivalent genes; cell heterogeneity; chromatin organization; epigenetics; insulin; pancreatic islet; single cell.


Conflict of interest statement

Declaration of interests The authors declare no competing interests.

Figures

Figure 1.
Figure 1.. Two epigenetically distinct pancreatic β-cell subtypes
A. Representative contour plots of the centered intensities of the stated histone modifications in β-cells isolated from individual mice (image representative of n=6 mice from 3 experiments). B. Representative distribution plots of H3K27me3 staining fluorescent intensities (FI) in insulin positive β-cells (representative of 5 experiments, n=4 mice each). C. Representative ImageStream analysis of dispersed, fixed single- β-cells of islets isolated from individual mice. The different panels show the immunostaining against insulin (up) H3K27me3 (middle), and bright field image (bottom) of the same β-cells (representative of 2 experiments). D. Representative 3D reconstruction of one pancreatic islet isolated from male mice, immunostained against H3K27me3, and a zoomed in image of adjacent insulin positive H3K27me3 HI and LO nuclei (representative of 3 experiments). E. 3D reconstruction of high-resolution confocal imaging from H3K27me3-HI (left) or -LO (right) sorted β-cells; one representative image out of 60 nuclei from n=4 mice. F. Representative voxel intensities and co-localizations of H3K27me3 and DAPI in one z-plane of each of the nuclei imaged in E. Groupings of voxels was done according to their DAPI and H3K27me3 intensities (left panel). Group 1 represent low\moderate intensity voxels, are localized in the nuclear interior and are shifted when comparing -HI and -LO cells (1a and 1b). H3K27me3 high intensity voxels are in group 2 (yellow) and are localized in the nuclear periphery of both nuclei with addition of central domains in the H3K27me3-HI nucleus. DAPI high voxels are in group 3 that is unchanged. G. Bar plot representation of the mean of numbers of H3K27me3 foci per nucleus of HI/LO β-cells isolated from 4 individual mice. Assessed by automated quantification of high-resolution images of 67 (HI) and 63 (LO) single nuclei. **= unpaired t-test, p-value<0.01. Error bars are mean ± SEM. H. Line plot of the averaged H3K27me3 intensities across the center optical plane (binned) of HI/LO sorted β-cell nuclei. Signal is normalized per cell. I. Bar plot representation of the Mean of the nucleus volumes of HI/LO sorted β-cells as assessed after reconstructing DAPI positive z-stacks and measuring the DAPI positive volume (analysis of high-resolution imaging of the 67 or 63 nuclei of single cells isolated from 4 individual mice). *= unpaired t-test, p-value <0.05. Error bars are mean ± SEM.
Figure 2.
Figure 2.. H3K27me3-HI cells are transcriptionally distinct and express cell surface CD24
A. Schematic of the experimental plan. Eight biological replicates of H3K27me3 HI/LO β-cells were isolated from four 4-week-old or four 10-week-old wildtype mice. One thousand H3K27me3 HI/LO cells were sorted from each mouse and low input RNA extraction and mRNA-seq was performed. B. PCA RNA-seq signals across the β-cells from young and adult mice used in the screening study. Each data point, shown as a triangle or a circle, represents the transcriptome of HI (dark gray) or LO (light gray) β-cells isolated from individual 4 (triangles) or 10 (circles) weeks old mice. total of n=8 mice. C. Heatmap of the differentially expressed genes between H3K27me3-HI/LO murine β-cells, and their chromatin-states as previously annotated. Log(normalized counts), z-scored per row. D. Representative example of CD24 expression versus H3K27me3 intensities in β-cells isolated from 10-week-old wildtype mice. representative of n=5 experiments. E. H3K27me3 mean fluorescence intensities (MFI) in CD24−/+ β-cells; each dot represents a population from an individual mouse. Paired t-test, * represent p-value<0.05. n=5 experiments. Error bars are mean± SEM. F. Representation of the heterogeneity in CD24 expression in live single β-cells or whole islets isolated from β-cell reporter mouse line (YFP is expressed upon Ins1-promoter driven CRE expression). G. UMAP visualization of sorted mouse β-cells that underwent SCAN-seq protocol. Colors represent the two major clusters of β-cells. n=2,156 cells H. UMAP map overlaid with the FACS-recorded levels of CD24 protein of each cell. I. Heatmap representation of SCAN-seq-scaled and averaged values (FACS-recorded intensities of the depicted parameters or RNA expression levels; Z-scored per row) from single β-cells negative or positive for CD24 from n=4 individual mice (columns). J. Representation of the proportion of H3K27me3-HI\CD24+ β cells through the life-span of mice. 8–12 mice per age group from n=4 experiments. Error bars are mean± SEM K. Representation of the proliferating cell fraction of H3K27me3-HI\CD24+ and H3K27me3-LO\CD24 β cells. Paired t-test, * represent p-value<0.05. Each dot represents one mouse, 12 mice from a total n=4 experiments. Error bars are mean± SEM L. Representation of the proliferation in the H3K27me3-HI\CD24+ or the H3K27me3-LO\CD24 β cell compartment during 3 days of normal chow diet (control) or high fat diet (HFD) feeding. Mice were injected with Edu once per day. Paired t-test, * represent p-value<0.05. Each dot represents one mouse, 4–5 independent mice. Error bars are mean± SEM M. Representation of the proportion of H3K27me3-HI\CD24+ β-cells upon 4 weeks of high fat diet feeding. Unpaired t-test, * represent p-value<0.05. 10–11 mice per treatment group from n=3 experiments. Error bars are mean± SEM.
Figure 3.
Figure 3.. βHI vs βLO cells are functionally distinct and specialized
A. Schematic of the experimental plan. Two dimensions, CD24 and H3K27me3 allows clean separation of βHILO for RNA sequencing analysis. B. PCA of H3K27me3 RNA-seq signals, showing reproducible separation of βHI and βLO β-cells, each dot represents one biological replicate from 3 independent experiments. C. Clustered heatmap representation of the log(normalized) expression of all differentially expressed genes (n=~2500) across all replicates, Z-score was calculated per gene (row). D. A Cytoscape plot of GSEA pathways represents the βHI (dark gray) or βLO (light gary) enriched gene sets. Dot size is proportional to the false discovery rate q-value. E. MA plot showing the fold change in expression generated by comparing βHI over βLO β-cells. Black dots represent significantly deregulated genes, that are also boxed when labeled and highlighted (histone modifiers-blue; genes associated with β-cells and their maturation-red/beige; Ins1/2 genes-black). Black or Boxed genes are statistically significant (P-value adjusted for multiple testing < 0.05, with fold change cutoff of 1.33). F. Top 10 significant transcription factor motifs enriched within +/− 2kb from TSS of upregulated genes in βHI cells. Rfx6 transcription factor and its binding motif are highlighted. G. Fold increase in insulin protein levels of βHI cells. Connected dots represent cells from each of the types isolated from an individual mouse. **** = paired t-test, p-value <0.0001.
Figure 4.
Figure 4.. βHI and βLO cells exhibit distinct epigenomes
A. Heatmap showing Spearman correlations of ChIP-seq signals of the indicated histone marks from whole islets, compared to H3K27me3 signals from triplicate experiments of βHI and βLO β-cells. B. Genomic snapshots showing H3K27me3 ChIP-seq tracks from whole islets and purified βHI and βLO cells, as indicated. The HoxD cluster of genes is represented. Horizontal black bars represent H3K27me3 covered broad regions. Colored horizontal bars represent chromatin states, as previously described and reproduced in panel (E). C. PCA of H3K27me3 ChIP-seq signals over all identified H3K27me3 peaks, showing reproducible separation of βHI and βLO β-cells. D. Genomic regions’ enrichment among H3K27me3 differential peaks between βHI and βLO β-cells. The dot-plot shows a specific enrichment on transcription start sites (TSS) for H3K27me differential peaks. The distribution of annotated genomic regions over H3K27me3 differential peaks was compared to the same distribution of all identified peaks and plotted as a ratio of percentages (i.e. values >1 mean relative enrichment of H3K27me3 differential peaks over the overall peaks’ distribution, while values <1 mean relative depletion). E. Chromatin states distribution on βHI (left) and βLO (right) H3K27me3-enriched TSS; relative gain of H3K27me3 on active genes (red hues) and relative loss on bivalent genes (purple hues), characterize βLO β-cells. Color-code for chromatin states as previously described is reported here F. Genomic snapshots showing H3K27me3 ChIP-seq tracks from whole islets and purified βHI and βLO cells, as indicated. The Cd24a gene is represented. Horizontal black bars represent H3K27me3 covered broad regions. Colored horizontal bars represent chromatin states, as previously described and reproduced in panel (E). G. Box plot representation of the Cd24a gene coverage in βHI and βLO cells H. Boxplot showing the ratio of the normalized K27me3 ChIP-seq signal between βHI and βLO cells, on βHI (left, dark-grey) and βLO (right, light-grey) K27me3-enriched TSS. **** = p-value < 0.0001, as assessed by t-test. I. Boxplot showing the ratio of the normalized RNA-seq signal between βHI and βLO β-cells, on βHI (left, dark-grey) and βLO (right, light-grey) K27me3-enriched TSS. The transcriptional regulation is in line with the reciprocal K27me3 enrichment in panel G. **** = p-value < 0.0001, as assessed by t-test. J. Scatter plot showing the correlation between βHILO gene expression and H3K27me3 ChIP-signal. Only βHI vs βLO -specific TSS are colored by their chromatin states. K. βHI (left) and βLO (right) β-cells H3K27me3 ChIP-seq signal over the gene bodies of related βHI and βLO-specific TSS’s. The signals are from merged triplicate experiments, and visualized as gene bodies +/− 4 Kb. The coverage profiles show a reciprocal enrichment/depauperation of the K27me3 signal on TSS vs the gene bodies, in βLO and βHI cells, respectively. L. PCA of DNA methylation array signals, showing reproducible separation of βHI and βLO β-cells. M. Enrichment analysis of Differentially Methylated Loci (DMLs) between βHI and βLO within the indicated dataset.
Figure 5.
Figure 5.. βHI and βLO cells are stably and functionally distinct
A. MA plot showing the fold change in expression generated by comparing βHI over βLO β-cells. Green dots represent mt-encoded mitochondrial genes, orange dots represent nuclear encoded mitochondrial genes listed in S3F. Differentially expressed genes are surrounded by black borders; (p-value adjusted for multiple testing < 0.05, with fold change cutoff of 1.33). B. Fold increase in mitochondrial DNA content (copy number normalized to genomic DNA, as measured by qPCR). Each dot represents an independent experiment, n=3. *= unpaired t-test, p-value<0.05 C. Dot plot representation of the MFI of TOM20 in the β-cell types, A Representative flow cytometer histogram of TOM20 labeling in the β-cell types. The connected dots represent cells from n=4 individual mice. **= paired t-test, p-value<0.01. D. Representative images of TOM20 antibody labeling of one βHI and one βLO cells. fixed β-Cells were first sorted according to their insulin, H3K27me3, and CD24 levels and then labelled with antibody against TOM20 (white) and analyzed at high resolution confocal microscopy. DAPI (blue) was used as counter staining. E. Box plot representations of mitochondrial size, sphericity, and number of fragments per cell. 16 cells were analyzed from n=3 independent mice. *= paired t-test, p-value<0.05, ****= paired t-test, p-value<0.0001. F. Mean fluorescent intensities (MFI) of TMRM in the β-cell types, connected dots represent cells from n=4 individual mice. **= paired t-test, p<0.01. G. Dot plot representation of gene expression levels (z-scored) from scRNAseq of dissociated monotypic βLO or βHI pseudo-islets after 7 days in culture. H. Dot plot representation of FACS measurements of CD24 protein levels in single cells from monotypic βHI or βLO pseudo-islets after 7 days in culture. I. Single spheroid metabolic profiling via Seahorse extracellular flux analysis in basal glucose (2.8mM) and glucose stimulated (16.7mM) conditions. Oxygen consumption rate (OCR) extracellular acidification rate (ECAR) Area under the curves (AUC) are shown in Figure S5I. J. Glucose stimulated insulin secretion (GSIS) and 48 hours, chronic, insulin secretion in single pseudo-islets generated by aggregating 2000 of βHI or of βLO cells. Insulin levels were measured for one hour before stimulation (2.8mM glucose), followed by another hour after stimulation (16.7mM glucose). 25–40 single spheroids were analyzed from n=5 independent experiments. *= two-way ANOVA with multiple comparison correction, p-value<0.05.
Figure 6.
Figure 6.. H3K27me3 dosage controls βHILO β-cell ratios and overall heterogeneity
A. UMAP visualization of sorted mouse β-cells that underwent SCAN-seq protocol. Colors and shape represent mouse genotypes Eed KO (n= 131 cells) or wild-type (Control; n=83 cells). B. Cluster topology for the data set in (A). Trajectory was inferred by slingshot. Initial clustering was done on all cells, splitting KOs from Controls. KO cluster was further divided into 2 clusters. C. Bar plot showing the intra-cluster sum of squared errors (SSE) per the indicated cluster of cells. As in (B), the magenta line connects the 3 KO groups. D. Box plot representation of the percentage of βHI cells per genotype. Data are medians of Control or Eed-HET mice, n=18 mice each group from 10 or 12 experiments (correspondingly). *= unpaired t-test, p-value<0.05. box plots show the median and whiskers indicate min and max values. E. Box plot representation of the percentage of βHI cells per genotype. Data are medians of Control or Jmjd3-HET mice, n=9 mice each group from 6 experiments. *= unpaired t-test, p-value<0.05. box plots show the median and whiskers indicate min and max values.
Figure 7.
Figure 7.. βHI and βLO cells are conserved in humans and their ratio altered in diabetes.
A. FACS plot of the fluorescence intensities of CD24 and H3K27me3 in human β-cells isolated from one donor. B. FACS fluorescence intensities of H3K27me3 levels in CD24+ compared to CD24 human β-cells, each connected pair of dots represents the mean fluorescent intensity (MFI) from one donor, n=12 donors. *= paired t-test, p-value<0.05. C. Representation of the β-cell surface labeling of CD24 (white) in sub-optimally dispersed, adjacent human islet cells from 2 independent donors. Counter staining of insulin is shown in magenta. D. UMAP representation of the cluster topology of human beta cells. βHILO clusters were determined after assessment of expression of the signature, genes reported in Figure 3C. Trajectory was inferred by slingshot. (n=638 β-cells from 11 donors without T2D and 7 donors with T2D) E. Custom gene set enrichment analysis (GSEA) representation of βHILO signature genes (see Figure 3C). The mean expression (z-score) for the two gene sets was calculated, then the magnitude and direction of differential signatures was determined by calculating the difference in expression between the two gene sets. The cells were then ranked by difference z-score. Plots of cells from all clusters are shown. Cluster 3 had no enrichment. Significant enrichments had p-value<0.05. F. Stacked bar plot representation of the percentage of β-cells in each of the clusters shown in (D). Bars split the cluster distributions of the cells that were isolated from humans without diabetes (ND) or with T2D.

References

    1. Stolovich-Rain M, Enk J, Vikesa J, Nielsen FC, Saada A, Glaser B, and Dor Y (2015). Weaning triggers a maturation step of pancreatic beta cells. Dev Cell 32, 535–545. 10.1016/j.devcel.2015.01.002. - DOI - PubMed
    1. Salinno C, Cota P, Bastidas-Ponce A, Tarquis-Medina M, Lickert H, and Bakhti M (2019). beta-Cell Maturation and Identity in Health and Disease. Int J Mol Sci 20. 10.3390/ijms20215417. - DOI - PMC - PubMed
    1. Arrojo EDR, Lev-Ram V, Tyagi S, Ramachandra R, Deerinck T, Bushong E, Phan S, Orphan V, Lechene C, Ellisman MH, and Hetzer MW (2019). Age Mosaicism across Multiple Scales in Adult Tissues. Cell Metab 30, 343–351 e343. 10.1016/j.cmet.2019.05.010. - DOI - PMC - PubMed
    1. Cnop M, Igoillo-Esteve M, Hughes SJ, Walker JN, Cnop I, and Clark A (2011). Longevity of human islet alpha- and beta-cells. Diabetes Obes Metab 13 Suppl 1, 39–46. 10.1111/j.1463-1326.2011.01443.x. - DOI - PubMed
    1. Lu TT, Heyne S, Dror E, Casas E, Leonhardt L, Boenke T, Yang CH, Sagar, Arrigoni L, Dalgaard K, et al. (2018). The Polycomb-Dependent Epigenome Controls beta Cell Dysfunction, Dedifferentiation, and Diabetes. Cell Metab 27, 1294–1308 e1297. 10.1016/j.cmet.2018.04.013. - DOI - PMC - PubMed

Publication types

MeSH terms