. 2023 May 9;56(5):1064-1081.e10.
doi: 10.1016/j.immuni.2023.02.016. Epub 2023 Mar 21.

T helper 2 cells control monocyte to tissue-resident macrophage differentiation during nematode infection of the pleural cavity

Affiliations

T helper 2 cells control monocyte to tissue-resident macrophage differentiation during nematode infection of the pleural cavity

Conor M Finlay et al. Immunity. .

Abstract

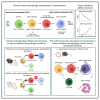
The recent revolution in tissue-resident macrophage biology has resulted largely from murine studies performed in C57BL/6 mice. Here, using both C57BL/6 and BALB/c mice, we analyze immune cells in the pleural cavity. Unlike C57BL/6 mice, naive tissue-resident large-cavity macrophages (LCMs) of BALB/c mice failed to fully implement the tissue-residency program. Following infection with a pleural-dwelling nematode, these pre-existing differences were accentuated with LCM expansion occurring in C57BL/6, but not in BALB/c mice. While infection drove monocyte recruitment in both strains, only in C57BL/6 mice were monocytes able to efficiently integrate into the resident pool. Monocyte-to-macrophage conversion required both T cells and interleukin-4 receptor alpha (IL-4Rα) signaling. The transition to tissue residency altered macrophage function, and GATA6+ tissue-resident macrophages were required for host resistance to nematode infection. Therefore, during tissue nematode infection, T helper 2 (Th2) cells control the differentiation pathway of resident macrophages, which determines infection outcome.

Keywords: GATA6; Litomosoides sigmodontis; alternatively activated macrophages; converting cavity macrophage; filariasis; helminth; interleukin 13; interleukin 4; serous cavities; strain-dependent immunity.


Conflict of interest statement

Declaration of interests The authors declare no competing interests.

Figures
Graphical abstract
Graphical abstract
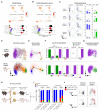
Figure 1
Figure 1. Host genotype dictates cellular immune response to L. sigmodontis infection in the pleural fluid
(A and B) Analysis of the pleural fluid of naive and day 35 L. sigmodontis-infected C57BL/6 and BALB/c mice. (A) T2-weighted TurboRARE images of the thoracic cavity. (B) UMAP of mass cytometric data of CD45+ pleural cavity cells, colored by cell type with mean cell count displayed inside plot. (C and D) Summary analysis of pleural cavity flow cytometric data of naive and days 23–60 infected mice. (C) Percentage of cell types as a proportion of total pleural cavity cells (D) Data in (C) as total cell numbers. ns, not significant, **p < 0.01, ***p < 0.001, ****p < 0.0001, t test. (E) Cell numbers in infected mice by time (days) separated by strain with naive mice at time point 0. See also Figure S1.
Figure 2
Figure 2. L. sigmodontis infection results in LCM expansion in C57BL/6 mice but loss of LCMs and increase of monocyte-derived macrophages in BALB/c mice
(A) Flow cytometric expression of F4/80 and MHCII by pleural cavity lineageCD11b+ MNPs from naive and day 35 infected C57BL/6 and BALB/c mice, colored by MNP subpopulation (right). (B) Percentage of indicated lineageCD11b+ MNP subpopulations from naive and infected C57BL/6 and BALB/c mice as a proportion of total CD11b+ MNPs and cell number, with infected data filtered to days 23–60. **p < 0.01,****p < 0.0001, t test. (C) MNP subpopulations by proportion or cell number, by time (days) separated by strain with naive mice at time point 0. (D) Kinetics of the ratio of LCMs to the sum of the other lineageCD11b+ MNP subpopulations. (E) Linear regression of percentage worm recovery versus the log10 of ratio in (D); data filtered to infection days 30–65. See also Figure S2.
Figure 3
Figure 3. Single-cell RNA sequencing of pleural cavity macrophages reveals additional macrophage populations and that LCMs differ by genetic background
(A) scRNA-seq data of pleural cavity lineageCD11b+ MNPs from naive C57BL/6 and BALB/c mice. UMAP generated from SCENIC TF regulons. (B) Ratio of pleural LCMs to SCMs in naive mice. ****p < 0.0001, t test. (C) SCENIC TF regulon activity scores displayed on UMAP. (D) Top differential SCENIC TF regulons between LCMs and SCMs (both strains). (E) Top differentially expressed genes between LCMs and SCMs (both strains). (F–H) Hierarchical clustering of SCENIC TF regulons. (F) UMAP colored by cluster. (G) Cluster dendrogram. (H) Cluster proportion. (I) Top differential SCENIC TF regulons (left) and genes (right) between DC-like cells and monocyte-like cells. (J and K) RNA velocity analysis of CD11b+ MNPs from naive C57BL/6 mice. (J) Vector field stream displayed on UMAP. (K) CellRank predicted terminal states. Cells colored by predicted progression to either terminal state. (L) Selected SCENIC TF regulon activity scores (left). Top differential regulons between C57BL/6 LCMs and BALB/c LCMs (right). (M) Top differential regulons between C57BL/6 LCMs and BALB/c LCMs. Example SCENIC TF regulon activity scores (left). (N) GATA6-dependent gene score projected on UMAP (top) and as violin plots separated by cluster (bottom). ****p < 0.0001, t test. See also Figures S3 and S4.
Figure 4
Figure 4. The LCM residency program is stabilized in infected C57BL/6 mice but not in BALB/c mice in which there is an accumulation of immature macrophages
(A) scRNA-seq of lineageCD11b+ MNPs from naive and day 35 L. sigmodontis-infected C57BL/6 and BALB/c mice. UMAP generated from SCENIC TF regulon activity scores. Cells colored by cluster overlaid with RNA velocity vector field stream. Insert, hierarchical cluster dendrogram. (B) Expression of canonical lineage marker genes. (C) Heatmap of top marker genes in each cluster. Selected genes highlighted at left. (D) Data in (A) separated by sample. (E) Cluster proportion pie charts by sample. (F) Scatterplots of mean gene expression by LCMs from naive and infected mice. (G) Score for IL-4c response, displayed on UMAP (top) and as violin plots separated by cluster or sample (bottom). (H) PDL2 expression by C57BL/6 LCMs and BALB/c converting CMs. Data are a pool of days 49, 55, and 63 infection data. ****p < 0.001, Mann-Whitney test. (I) Metabolic Seahorse analysis of FACS-purified LCMs from infected C57BL/6 mice and converting CMs (CCMs) from infected BALB/c mice on day 40 of infection. Left to right: OCR trace, spare respiratory capacity, and basal and maximal oxidative ATP production rates. *p < 0.05, t test. (J) Ex vivo uptake of pHrhodo+ E. coli bioparticles (BPs) by pleural MNP subsets isolated from day 40 infected C57BL/6 and BALB/c mice; cells not incubated with E. coli BP (control) are included for comparison. These summary data are pooled from both strains. Right, histograms of pHrhodo expression by major pleural cell types. (K) Expression of TNF-α by pleural MNP subsets isolated from day 40 infected C57BL/6 and BALB/c mice and stimulated ex vivo with LPS. Cells stimulated with PBS are included for comparison. These summary data are pooled from both strains. (L) Expression of Ym1 and Arg1 by MNP subsets in day 49 infected C57BL/6 and BALB/c mice, with cells from naive mice for comparison. These summary data are pooled from both strains and is a pool of 8 experiments between days 34 and 86 of infection. Error bars in (J)–(L) represent ± SD. Statistical tests in (J)–(L) are multiple comparison of one-way ANOVA with Bonferroni’s correction based on E. coli BP (J), LPS (K), and infected data (L) and are pooled from both strains. Data in (J)–(L) are shown divided by strain in Figures S5F–S5H. See also Figures S4 and S5.
Figure 5
Figure 5. Monocyte differentiation is less efficient in L. sigmodontis-infected BALB/c mice, and they do not acquire residency
(A) GATA6 SCENIC TF regulon activity scores projected on UMAP and summarized with violin plots. (B) Scores for GATA6-dependent gene score, projected on UMAP and summarized with violin plots. (C) Pleural lavage cells were analyzed by flow cytometry ex vivo and following 5 days of in vitro culture. Left, expression of CD73 and CD11c gated on CD102+ macrophages. Right, gMFI of CD73 and CD11c on CD102+ macrophages. (D–G) RNA velocity and CellRank analysis of macrophages from infected mice, split by strain. (D) RNA velocity vector field stream on variable gene PCA. (E) RNA velocity PAGA graphs with clusters as nodes and arrows depicting high directed edge connectivity. (F) CellRank fate probabilities for progression to terminal states. (G) Probabilities displayed on PCA. (H–J) Intrapleural transfer of strain-matched monocytes into naive and day 14 infected mice with recovery of pleural fluid 21 days later. (H) Experimental design. (I) Myeloid subpopulation proportions for CD45.1+ donor and CD45.2+ host macrophages. (J) Expression of F4/80, PD-L2, and Lyve1 by donor (black/red) and host (gray) macrophages from infected; concatenated from 3 individual mice. See also Figure S6.
Figure 6
Figure 6. LCM expansion is dictated by the genotype of hematopoietic cells and requires Th2 cells
(A–D) Bone marrow transplantation of naive and day 34 infected B10.D2 and BALB/c mice. (A) Experimental design. (B) LCM numbers. (C) Flow cytometric plots of PD-1 and ST2 expression by pleural CD4+ T cells. (D) Expression of ST2 and IL-13 by pleural CD4+ T cells. (E–G) Pleural immune cells from naive and day 35 infected C57BL/6 and Tcra/ mice. (E) LCM numbers. (F) Percentage RELMα expression by LCM. (G) Stacked bar charts of total pleural immune cells, colored in cell type. (H–K) Pleural cavity immune-cell analysis from C57BL/6 mice given anti-CD4 or isotype control weekly from day 7. (H) LCM numbers over time (days). (I) Percentage of RELMα expression by LCM over time. (J) Percentage Ki67hi of Tim4+ LCM taken from naive and infected mice on day 10. (K) Worm counts on day 56. (L–O) Analysis of pleural immune response by IL-33Gt−/− (WT) and IL-33Gt+/+ (KO) mice on infection day 42; naive heterozygous mice (Het) were used for visual comparison. (L) IL-5 and IL-13 expression by CD4+ T cells, data summary, right. (M) IFN-γ expression by CD4+ T cells. (N) LCM numbers. (O) MNP subset proportions. (P–S) Analysis of pleural immune response by infected Irf4fl/fl Itgax-cre (WT) and Irf4fl/f Itgax-cre+ (KO) mice on day 41. (P) Cytokine expression by CD4+ T cells, (Q) LCM numbers. (R) RELMα expression by total macrophage. (S) MNP subset proportion. Horizontal bars represent the median and error bars represent ±SD. Statistical tests are unpaired t tests, except for (A), which is a one-way ANOVA with Bonferroni’s correction, and (K), which is a Mann-Whitney U test. See also Figure S7.
Figure 7
Figure 7. IL-4 and IL-13 control monocyte to LCM differentiation during nematode infection
(A–C) Analysis of pleural cavity immune cells from naive and day 45 infected (LS) Il13eGFP−/− or Il13eGFP+/− (WT/Het) and Il13eGFP+/+ (KO). (A) LCM numbers. (B) MNP subpopulation proportions. (C) Trimap of flow cytometric data of MNP (concatenated from 3 to 9 mice per group). (D–G) Pleural cavity immune cells from naive and day 70 infected C57BL/6, BALB/c and Il4ra/ (IL-4Rα−/−) mice. (D) LCM and monocyte numbers. (E) Trimap of MNP in infected mice (concatenated from 3 to 8 mice per group). (F) MNP cell proportions. (G) Worm numbers. Data from 3 experiments. (H) Uninfected and Lito-infected BALB/c mice were injected i.p. with IL-4-FC prior to analysis on day 41. Left, experimental plan; right, stacked bar charts of CD11b+ MNP cell number, colored by MNP population. (I and J) Analysis of CD11b+ MNPs from infected wild type (WT), Il13eGFP+/+ (IL-13 KO), and Il4ra/ (IL-4Rα KO) on both C57BL/6 and BALB/c backgrounds. (I) Trimaps of MNPs (concatenated from 5 to 16 mice per group). (J) Data summary of MNP populations as stacked bar charts and scatter plots. ****p < 0.0001, one-way ANOVA with Bonferroni’s correction for multiple comparisons test. (K–P) Pleural cavity immune cells from day 43 infected Gata6fl/fl Csf1r-cre and Gata6fl/fl Csf1r-cre+. (K) UMAP of flow cytometric data of all immune cells (concatenated from 13 mice). (L) LCM numbers. (M) MNP cell proportions, right, and UMAP of MNPs, left. (N) Monocyte and neutrophil numbers. (O) IFN-γ expression by CD4+ T cells. (P) Worm numbers. Data from 2 experiments. Horizontal bars represent the median and p values are from unpaired t tests, except for worm numbers (Mann-Whitney U test). See also Figure S7.

Comment in

References

    1. Miserocchi G. Physiology and pathophysiology of pleural fluid turnover. Eur Respir J. 1997;10:219–225. doi: 10.1183/09031936.97.10010219. - DOI - PubMed
    1. Feller-Kopman D, Light R. Pleural disease. N Engl J Med. 2018;378:740–751. doi: 10.1056/NEJMra1403503. - DOI - PubMed
    1. Ghosn EEB, Cassado AA, Govoni GR, Fukuhara T, Yang Y, Monack DM, Bortoluci KR, Almeida SR, Herzenberg LA, Herzenberg LA. Two physically, functionally, and developmentally distinct peritoneal macrophage subsets. Proc Natl Acad Sci USA. 2010;107:2568–2573. doi: 10.1073/pnas.0915000107. - DOI - PMC - PubMed
    1. Kim K-W, Williams JW, Wang Y-T, Ivanov S, Gilfillan S, Colonna M, Virgin HW, Gautier EL, Randolph GJ. MHC II+ resident peritoneal and pleural macrophages rely on IRF4 for development from circulating monocytes. J Exp Med. 2016;213:1951–1959. doi: 10.1084/jem.20160486. - DOI - PMC - PubMed
    1. Bain CC, Louwe PA, Steers NJ, Bravo-Blas A, Hegarty LM, Pridans C, Milling SWF, MacDonald AS, Rückerl D, Jenkins SJ. CD11c identifies microbiota and EGR2-dependent MHCII + serous cavity macrophages with sexually dimorphic fate in mice. Eur J Immunol. 2022;52:1243–1257. doi: 10.1002/eji.202149756. - DOI - PMC - PubMed

Publication types