. 2023 Mar 22;14(1):1566.
doi: 10.1038/s41467-023-36878-2.

Checkpoint kinase 1/2 inhibition potentiates anti-tumoral immune response and sensitizes gliomas to immune checkpoint blockade

Affiliations

Checkpoint kinase 1/2 inhibition potentiates anti-tumoral immune response and sensitizes gliomas to immune checkpoint blockade

Crismita Dmello et al. Nat Commun. .

Abstract

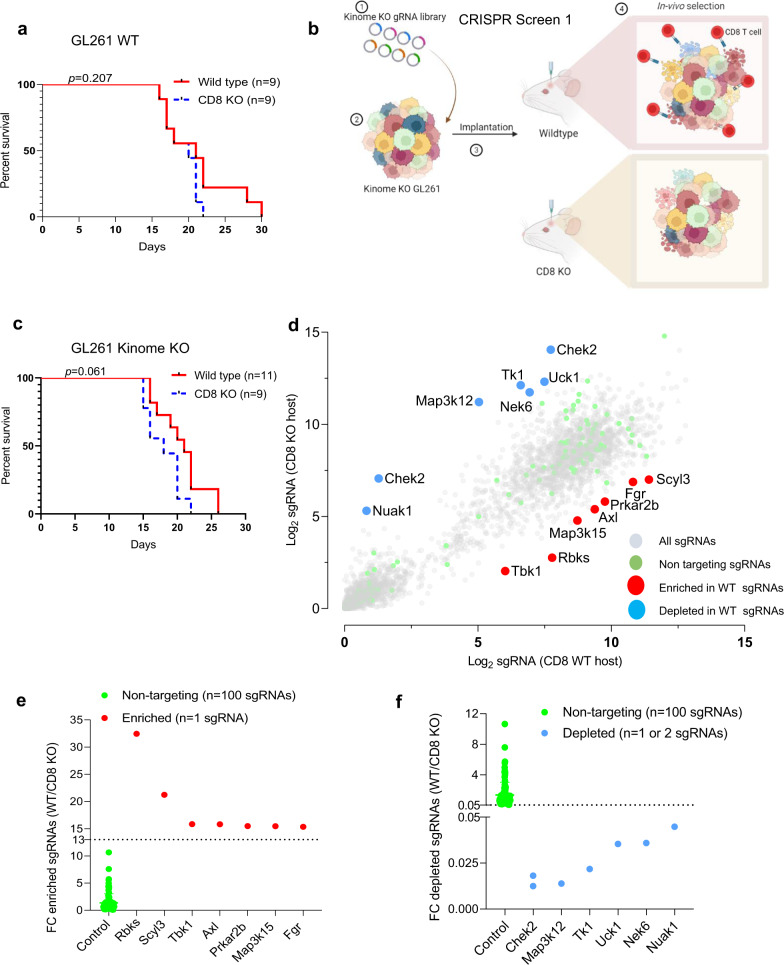
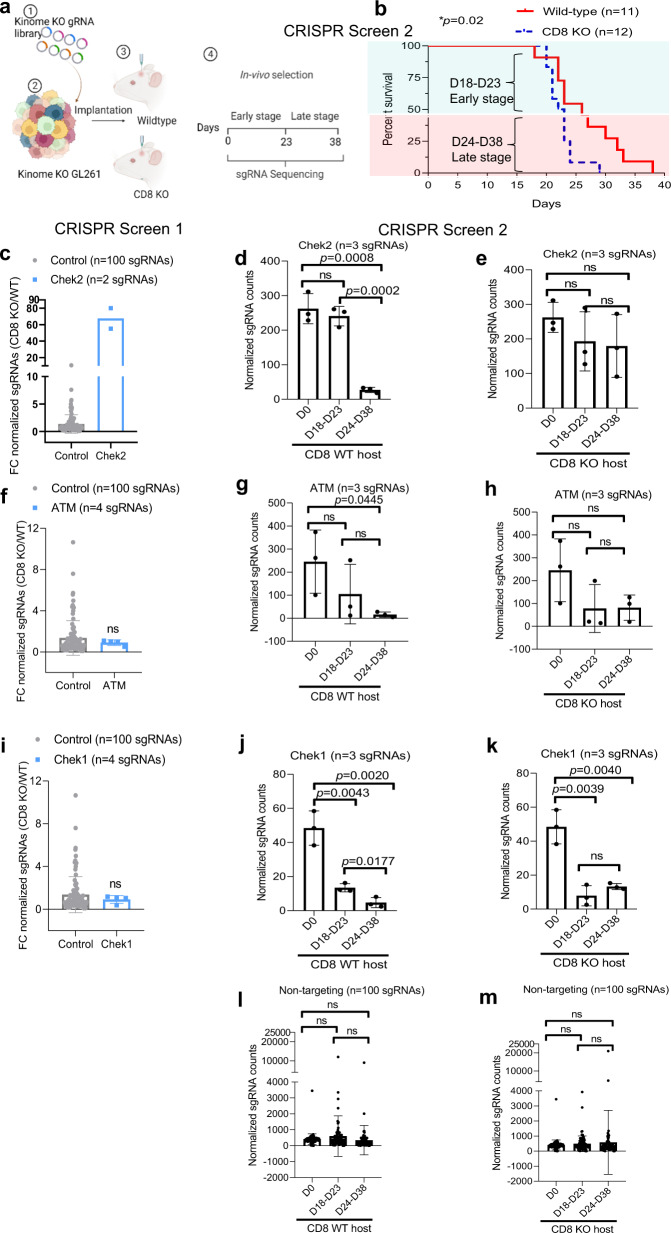
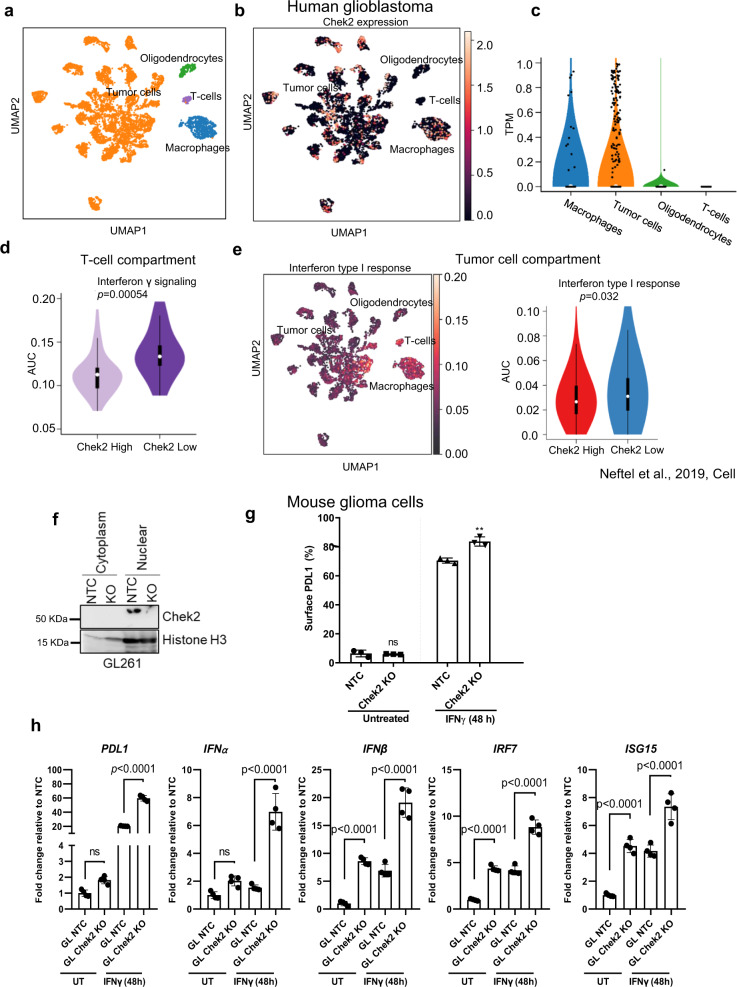
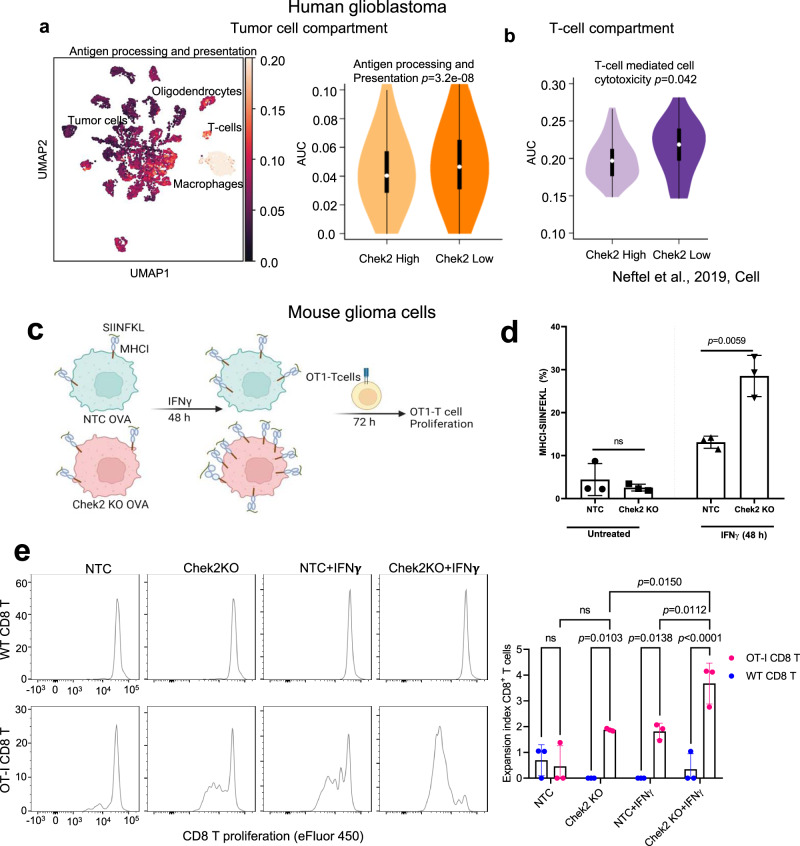
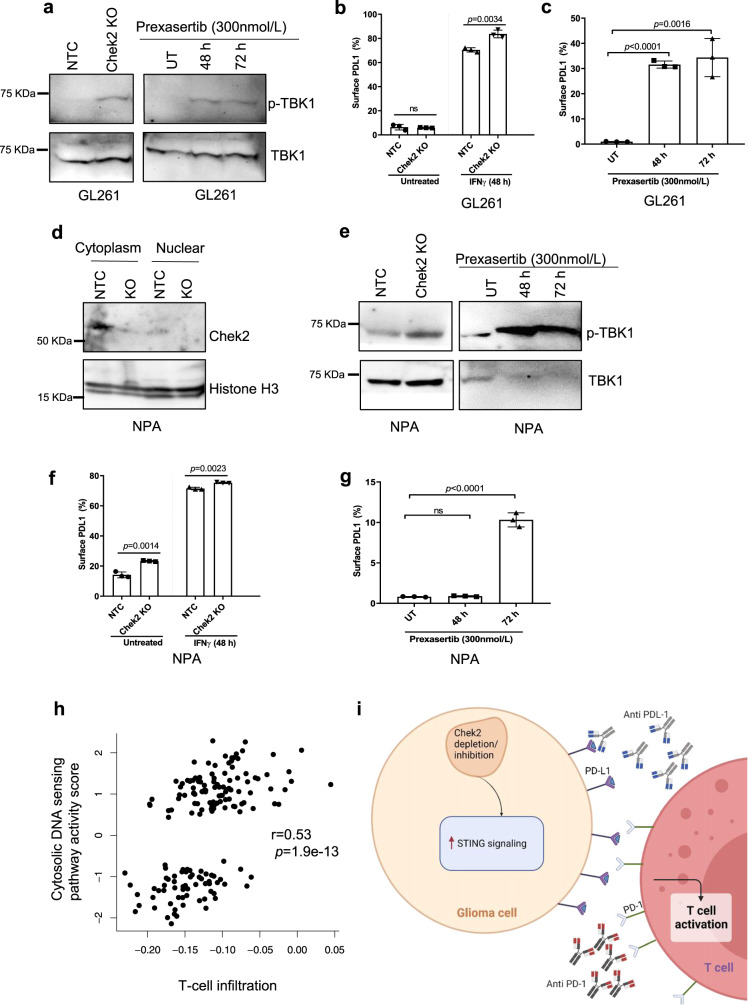
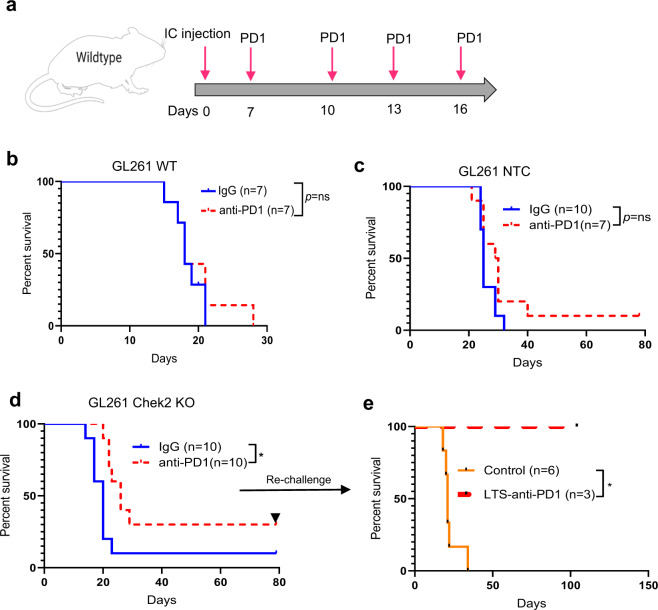
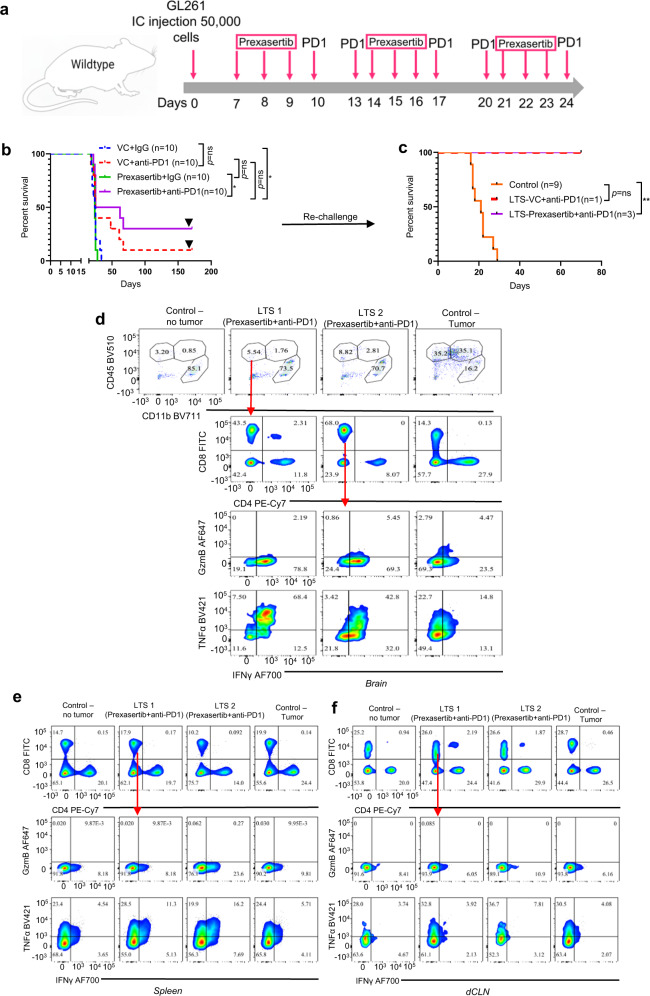
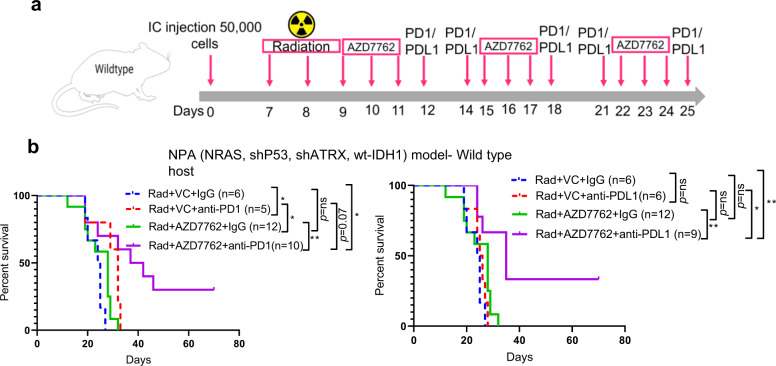
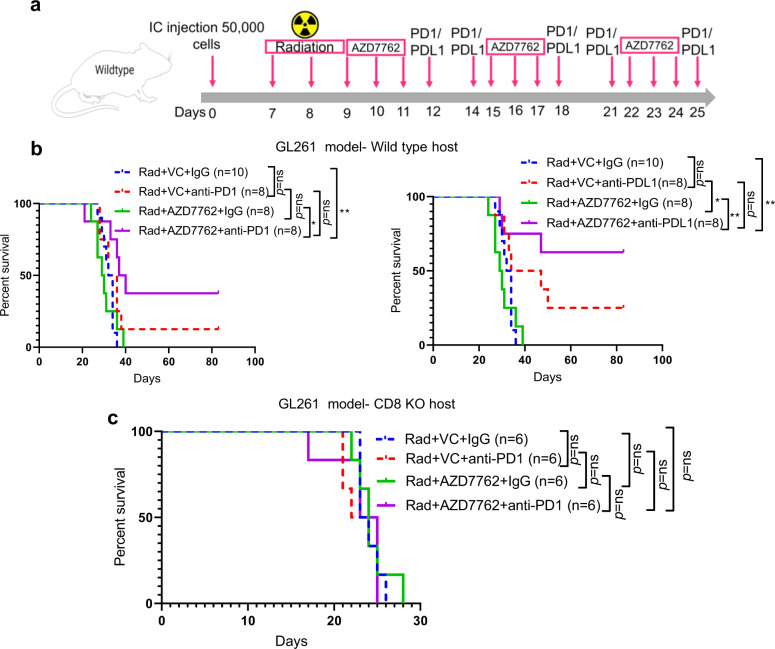
Whereas the contribution of tumor microenvironment to the profound immune suppression of glioblastoma (GBM) is clear, tumor-cell intrinsic mechanisms that regulate resistance to CD8 T cell mediated killing are less understood. Kinases are potentially druggable targets that drive tumor progression and might influence immune response. Here, we perform an in vivo CRISPR screen to identify glioma intrinsic kinases that contribute to evasion of tumor cells from CD8 T cell recognition. The screen reveals checkpoint kinase 2 (Chek2) to be the most important kinase contributing to escape from CD8 T-cell recognition. Genetic depletion or pharmacological inhibition of Chek2 with blood-brain-barrier permeable drugs that are currently being evaluated in clinical trials, in combination with PD-1 or PD-L1 blockade, lead to survival benefit in multiple preclinical glioma models. Mechanistically, loss of Chek2 enhances antigen presentation, STING pathway activation and PD-L1 expression in mouse gliomas. Analysis of human GBMs demonstrates that Chek2 expression is inversely associated with antigen presentation and T-cell activation. Collectively, these results support Chek2 as a promising target for enhancement of response to immune checkpoint blockade therapy in GBM.


Conflict of interest statement

C.D., A.M.S., C.L-C, and L.C. are co-authors for the following patent filed by Northwestern University: Method of using checkpoint kinase 1/2 inhibitor therapy to modulate anti-tumoral response against cancer and sensitize gliomas to immunotherapy (US Patent App. 16/951,638). A.M.S. has received in-kind and or funding support for research from Agenus, BMS, and Carthera. R.R. is a member of the SAB of AimedBio, consultant for Arquimea Research and a founder of Genotwin. The remaining authors declare no other competing interests.

Figures

Fig. 1
Fig. 1. In vivo kinome knockout CRISPR screen in CD8 KO and WT mice.
a KM survival curves of the C57BL/6 WT and CD8 KO mice (n = 9/group) bearing GL261 glioma. The median survival durations in the groups were: WT, 21 days; CD8 KO, 20 days; Statistics: WT versus CD8 KO, log-rank test p = 0.2. b Schematic representation of the in vivo CRISPR screen. Mouse glioma cells GL261 were transduced with kinome knockout library and the transformed cells were implanted in WT and CD8 KO mice. The library representation of >500X was maintained in the WT and CD8 KO group by injecting 2 × 105 cells/mouse. As the animals approached the endpoint, they were sacrificed, and the genomic DNA was extracted from the tumor region, guides were amplified, and sequenced. c KM analysis of the animals in the CRISPR screen 1. The KM plot shows percent survival of WT (n = 11) and CD8 KO (n = 9) animals bearing kinome KO GL261 glioma cells. The median survival durations in the groups were as follows: WT, 21 days; CD8 KO, 18 days; Statistics: WT versus CD8 KO, log-rank test p = 0.06. d Scatter plot showing the top kinases with the most enriched or depleted sgRNAs in the WT as compared to the CD8 KO animals. The sky blue dots correspond to the top depleted sgRNAs, while the red dots represent the most enriched sgRNAs in the WT as compared to the CD8 KO animals. The gray dots are all other sgRNAs. e The Y-axis shows fold change (fc) WT over CD8 KO of the normalized sgRNA counts. The red dots correspond to the top enriched sgRNAs and the fluorescent dots are all non-targeting sgRNAs. f The Y-axis shows fc WT over CD8 KO of the normalized sgRNA counts. The blue dots correspond to the top depleted sgRNAs and the fluorescent dots are all non-targeting sgRNAs. For e, f the error bars on non-targeting sgRNAs represent mean ± SD. Source data for a, cf  are provided as a Source Data file.
Fig. 2
Fig. 2. In vivo kinome knockout CRISPR screen with early and late time points shows selection of Chek2 KO glioma cells over time in intact immunity mice as compared to CD8 KO mice.
a Schematic representation of the second in vivo CRISPR screen. The library representation of 733X was maintained in the WT (n = 11) and 800X in the CD8 KO (n = 12) group by injecting 200,000 cells/mouse. Different barcodes were assigned to the animals that were sacrificed at the early stage (D18-D23) and animals sacrificed at the late stage (D24–D38) from both WT and CD8 KO hosts, guides were amplified and sequenced. b KM analysis of the animals in the second CRISPR screen. The KM plot shows percent survival of wild-type and CD8 KO animals bearing kinome KO glioma cells. p = 0.02 using the log-rank test. c The histogram shows 74-fold enrichment of Chek2 sgRNAs in CD8 KO mice as compared to the WT mice in the CRISPR screen 1. In the CRISPR screen 2, d, e Change in Chek2 KO glioma cells over time in WT and in CD8 KO mice respectively. f The histogram shows change in Atm sgRNAs in CD8 KO mice as compared to the WT mice in the CRISPR screen 1. In the CRISPR screen 2, g, h Change in Atm KO glioma cells over time in WT and in CD8 KO mice respectively. i The histogram shows fold change in Chek1 sgRNAs in CD8 KO mice as compared to the WT mice in the CRISPR screen 1. In the CRISPR screen 2, j, k Depletion of Chek1 KO glioma cells over time in WT and in CD8 KO mice respectively. The distribution of non-targeting sgRNAs over time in WT mice (l) and CD8 KO mice (m) of the CRISPR screen 2. For cm the error bars represents mean ± SD. For dm statistics was done using unpaired two-tailed t-test (without adjustments for multiple comparisons). Source data for Fig. bm are provided as a Source Data file.
Fig. 3
Fig. 3. CHEK2 expression in tumor cells is inversely associated with type 1 interferon signaling in human and mouse gliomas.
a UMAP graph of all single cells, showing cell annotation for macrophages (blue), tumor cells (orange), oligodendrocytes (green) and T cells (purple). Each dot represents an individual cell, n =  7930 cells, from 28 human glioblastoma tumor samples. b UMAP plot showing the expression of CHEK2 in macrophages, tumor cells, oligodendrocytes, and T cells. c Violin plot comparing the expression of CHEK2 in macrophages, tumor cells, oligodendrocytes and T cells. d Violin plot (right) of the gene signature scores of Interferon γ signaling in n = 94 T cells from high CHEK2 vs low CHEK2 expressing cases. e UMAP (left) and violin plot (right) of the gene signature scores of Interferon type I response in n = 6,863 tumor cells with high and low expression of CHEK2. Median of the frequency of CHEK2 expression (CPM > 0) inside the tumor cell compartment was used to dichotomize the 28 samples. The scRNA-seq data was used from the study published by Neftel et al.. For (d and e), the p value represents two-tailed Mann–Whitney test; whiskers represent minimum and maximum values, the white dot inside the box represents the median and the box extends from the 25th to 75th percentiles. f Representative western blot showing knockout of Chek2 in GL261 cells. Histone H3 is used as a loading control. N = 3 independent replicates. g Flow cytometry analysis showing surface expression of PD-L1 on GL261 Chek2 KO and non-targeting control (NTC) clones, at the basal level and upon stimulation with IFNγ for 48 h. The histogram shows mean ± SE of one representative experiment of 3 independent experiments. p = 0.0034 by two-sided t test. h Quantitative real-time PCR analysis showing mean mRNA expression of PD-L1, IFN-α, IFN-β, IRF7 and ISG15 at the basal level and upon stimulation with IFN-γ for 48 h. GAPDH mRNA expression was used to normalize the expression of the target gene. Histograms represent mean ± SD, p value corresponds to p adjusted. N = 2 independent experiments with 4 technical replicates/independent experiment. Differences among cell types were evaluated using one-way ANOVA with post hoc Tukey’s multiple comparisons test. GL NTC in the figure corresponds to GL261 NTC and GL Chek2 KO corresponds to GL261 Chek2 KO. Source data for fh are provided as a Source Data file.
Fig. 4
Fig. 4. CHEK2 expression in tumor cells is inversely associated with enhanced antigen presentation on tumor cells, in human and mouse gliomas.
a UMAP (left) and violin plot (right) of the gene signature scores of antigen processing and presentation pathway in n = 6,863 tumor cells high and low CHEK2 expression from 28 human glioblastoma tumor samples. b Violin plot of the gene signature scores of T-cell-mediated cytotoxicity pathway in n = 94 T cells from high CHEK2 vs low CHEK2 expressing samples. The scRNA-seq data was used from the study published by Neftel et al.. For (a and b), the p value represents two-tailed Mann–Whitney test; whiskers represent minimum and maximum values, the white dot inside the box represents the median and the box extends from the 25th to 75th percentiles. c Schematic showing the assay design to test the ability of Chek2 KO cells to promote OT-I CD8+ T-cell activation, assessed by cell proliferation (expansion index). d Flow cytometry analysis showing surface expression of MHCI-SIINFEKL on GL261 Chek2 KO and non-targeting control (NTC) clones, at the basal level and upon stimulation with IFNγ for 48 h. The histogram shows mean ± SD of one representative experiment of 3 independent experiments. p = 0.0059 by two-sided t test. e Four samples-NTC, Chek2 KO, NTC + IFNγ and Chek2 KO + IFNγ were cultured in individual well of the 6-well plates in triplicates. Each of the replicates of these treatment groups were cocultured with CD8+ T cells and OT-I CD8+ T cells independently (N = 3/experimental condition). WT and OT-1 CD8+ T-cell proliferation in all 24 samples was assessed by eFluor 450 fluorescence dilution individually. For NTC + IFNγ and Chek2 KO + IFNγ groups, the respective clones were stimulated with IFNγ for 48 h prior to culturing with WT CD8+ T cells or OT-I CD8+ T cells. Histograms represent mean ± SD of N = 3 replicates/condition. p values by two-way ANOVA. Source data for d, e are provided as a Source Data file.
Fig. 5
Fig. 5. Chek2 depletion/inhibition leads to STING pathway activation in mouse glioma cells.
a Western blot showing the phosphorylation of TBK1 in GL261 Chek2 KO and non-targeting control (NTC) clones and in GL261 glioma cells treated with Chek1/Chek2 inhibitor Prexasertib (300 nmol/L) at the indicated time points. Total TBK1/β-Actin is used as a loading control. N = 3 independent replicates. Flow cytometry analysis showing surface expression of b, PD-L1 on GL261 Chek2 KO and NTC clones, at the basal level and upon stimulation with IFNγ for 48 h and c, PD-L1 on GL261 glioma cells treated with Prexasertib (300 nmol/L) at the indicated time points. d Western blot showing knockout of Chek2 in NPA cells. Histone H3 is used as a loading control. Western blot showing the phosphorylation of TBK1 in e, NPA Chek2 KO and NTC clones and in NPA glioma cells treated with Chek1/Chek2 inhibitor Prexasertib (300 nmol/L) at the indicated time points. Total TBK1 is used as a loading control. For de, N = 3 independent replicates. Flow cytometry analysis showing surface expression of f, PD-L1 on NPA Chek2 KO and NTC clones, at the basal level and upon stimulation with IFNγ for 48 h and g, PD-L1 on NPA glioma cells treated with Prexasertib (300 nmol/L) at the indicated time points. h Scatter plot showing correlation between T-cell infiltration and cytosolic DNA sensing-STING pathway in TCGA GBM dataset (n = 167 samples, two-tailed, Pearson correlation coefficient r = 0.53, p = 1.9e−13). i Proposed model: Chek2 depletion or pharmacological inhibition results in STING pathway activation and PD-L1 upregulation, which may sensitize gliomas to checkpoint blockade therapy. For b, c, f and g 10,000 cells/condition were analyzed over 3 independent experiments (mean ± SD, unpaired two-tailed t-test). Source data for Fig. ag are provided as a Source Data file.
Fig. 6
Fig. 6. Chek2 depleted gliomas show improved response to PD-1 blockade.
a Dosing scheme for the PD-1 blockade treatment in mice with intracranially implanted GL261 glioma cells. b Kaplan–Meier (KM) survival curves of the C57BL/6 mice bearing GL261 wild-type cells. One group of mice (n = 7/group) were treated with the anti-PD-1 antibody and the other group of mice was treated with the isotype control antibody. 200,000 GL261 cells were injected/mouse. The median survival: IgG, 18 days; anti-PD-1, 18 days; Statistics: anti-PD-1 versus IgG, p = 0.59. c KM survival curves of the C57BL/6 mice bearing GL261 NTC (non-targeting control) cells. One group of mice (n = 7/group) was treated with the anti-PD-1 antibody, and the other group of mice (n = 10/group) was treated with the isotype control antibody. 50,000 GL261 NTC cells were injected/mouse. The median survival: IgG, 25 days; anti-PD-1, 29.5 days; Statistics: anti-PD-1 versus IgG, p = 0.07. d KM survival curves of the C57BL/6 mice bearing GL261 Chek2 KO cells. One group of mice (n = 10/group) was treated with the anti-PD-1 antibody, and the other group of mice was treated with isotype control antibody. 50,000 GL261 Chek2 KO cells were injected/mouse. The median survival: IgG, 20 days; anti-PD-1, 26 days; Statistics: anti-PD-1 versus IgG, p = 0.01. e The LTS in the Chek2 KO implanted group were rechallenged 80 days after the first implantation of Chek2 KO cells in the contralateral hemisphere with same type of cells and monitored. KM survival curves of the LTS mice from isotype and anti-PD-1 groups along with the control mice group which were implanted for the first time. The median survival: naive controls (6 mice), 21 days; isotype (1 mouse), undefined; anti-PD-1 (3 mice), undefined. Statistics: naive control versus isotype, p = 0.11; naive control versus anti-PD-1, p = 0.01. On the figure LTS is long-term survivors and anti-PD-1 is PD-1 blockade. Survival analysis for be was performed using the log-rank test. Statistical significance on the figure is depicted as ns: not statistically significant, *p < 0.05. Source data for be  are provided as a Source Data file.
Fig. 7
Fig. 7. Combination of Prexasertib and PD-1 blockade improves survival in glioma-bearing mice.
a The schematic representation of the dosing scheme for the survival experiment. b KM survival curves for C57BL/6 mice bearing GL261 glioma. Seven days after intracranial tumor implantation, the animals were randomized into 4 groups (10 animals/group): vehicle and isotype control (IgG), anti-PD-1, Prexasertib (Chek1/2 inhibitor), and Prexasertib and the anti-PD-1 combination group. The median survival duration in the treatment groups were as follows: VC + IgG, 24.5 days; VC + anti-PD-1, 25 days; Prexasertib + IgG, 24 days; Prexasertib + anti-PD-1, 43.5 days. Statistics: VC + IgG vs VC + anti-PD-1, p = 0.09; VC + IgG vs Prexasertib + IgG, p = 0.5; and VC + IgG vs Prexasertib + anti-PD-1, p = 0.01. c, KM survival curves for long-term survivors and naive controls that were rechallenged in the contralateral hemisphere. The median survival in the treatment groups were as follows: naive controls (9 mice), 21 days; VC + anti-PD-1 (1 mouse), undefined; Prexasertib + anti-PD-1 (3 mice), undefined. Statistics: naive control vs VC + anti-PD-1, p = 0.09; naive control vs Prexasertib+ anti-PD-1, p = 0.0062. Survival analysis for b, c was performed using the log-rank test. d Analysis of CD8 T-cell phenotype in the long-term survivors (LTS). Freshly dissected brains from Prexasertib + anti-PD-1 group, naive control (no tumor), and glioma-bearing control mice were analyzed for CD8 T-cell phenotype using flow cytometry. e Analysis of CD8 T-cell phenotype in the long-term survivors. Freshly dissected spleens from Prexasertib + anti-PD-1 group, naive control (no tumor), and glioma-bearing control mice were analyzed for CD8 T-cell phenotype using flow cytometry. f Analysis of CD8 T-cell phenotype in the long-term survivors. Freshly dissected deep cervical lymph nodes (dCLN) from Prexasertib + anti-PD-1 group, naive control (no tumor), and glioma-bearing control mice were analyzed for CD8 T-cell phenotype using flow cytometry. Statistical significance on the figure is depicted as ns: not statistically significant, *p < 0.05. Source data for b, c are provided as a Source Data file.
Fig. 8
Fig. 8. The combination of radiotherapy, AZD7762 and PD-1/PD-L1 blockade improves the survival of glioma-bearing mice in NPA glioma model.
a The schematic representation of the dosing scheme followed for the survival experiment. b (Left) KM survival curves for NPA glioma-bearing C57BL/6 mice. Seven days after intracranial implantation, all the animals were irradiated with 3 Gy whole-brain radiation for 3 consecutive days. 9 days after tumor implantation, the animals were randomized into 4 groups: vehicle control (n = 6), anti-PD-1 (n = 5), AZD7762 (Chek1/2 inhibitor) (n = 12) and AZD7762 + anti-PD-1 (n = 10) combination group. Survival analysis was performed using the log-rank test. The median survival duration in the treatment groups were as follows: Rad + VC + IgG, 24.5 days; Rad + VC + anti-PD-1, 32 days; Rad + AZD7762 + IgG, 28 days; Rad + AZD7762 + anti-PD-1, 39.5 days. Statistics: Rad + VC + IgG vs Rad + VC + anti-PD-1, p = 0.02; Rad + VC + IgG vs Rad + AZD7762 + IgG, p = 0.09; and Rad + VC + IgG versus Rad + AZD7762 + anti-PD-1, p = 0.018. (Right) KM survival curves for NPA glioma-bearing C57BL/6 mice. 7 days after intracranial implantation, all the animals were irradiated with 3 Gy whole-brain radiation for 3 consecutive days. 9 days after tumor implantation, the animals were randomized into 4 groups: vehicle control (n = 6), anti-PD-L1 (n = 6), AZD7762 (Chek1/2 inhibitor) (n = 12) and AZD7762 + anti-PD-L1 (n = 9) combination group. Survival analysis was performed using the log-rank test. The median survival duration in the treatment groups were as follows: Rad + VC + IgG, 24.5 days; Rad + VC + anti-PD-L1, 25.5 days; Rad + AZD7762 + IgG, 28 days; Rad + AZD7762 + anti-PD-L1, 35 days. Statistics: Rad + VC + IgG vs Rad + VC + anti-PD-L1, p = 0.32; Rad + VC + IgG vs Rad + AZD7762 + IgG, p = 0.09; and Rad + VC + IgG versus Rad + AZD7762 + anti-PD-L1, p = 0.0065. Statistical significance on the figure is depicted as ns: not statistically significant, *p < 0.05, **p < 0.01. Source data for b are provided as a Source Data file.
Fig. 9
Fig. 9. The combination of radiotherapy, AZD7762 and PD-1/PD-L1 blockade improves the survival of glioma-bearing mice in GL261 glioma model.
a The schematic representation of the dosing scheme followed for the survival experiment. b (Left) KM survival curves for GL261 glioma-bearing C57BL/6 mice. Survival analysis was performed using the log-rank test. The median survival duration in the treatment groups were as follows: Rad + VC + IgG, 33 days; Rad + VC + anti-PD-1, 34 days; Rad + AZD7762 + IgG, 29.5 days; Rad + AZD7762 + anti-PD-1, 38.5 days. Statistics: Rad + VC + IgG vs Rad + VC + anti-PD-1, p = 0.16; Rad + VC + IgG vs Rad + AZD7762 + IgG, p = 0.71; and Rad + VC + IgG vs Rad + AZD7762 + anti-PD-1, p = 0.008. (Right) KM survival curves for GL261 glioma-bearing C57BL/6 mice. Survival analysis was performed using the log-rank test. The median survival duration in the treatment groups were as follows: Rad + VC + IgG, 33 days; Rad + VC + anti-PD-L1, 40.5 days; Rad + AZD7762 + IgG, 29.5 days; Rad + AZD7762 + anti-PD-L1, undefined. Statistics: Rad + VC + IgG vs Rad + VC + anti-PD-L1, p = 0.059; Rad + VC + IgG vs Rad + AZD7762 + IgG, p = 0.71; and Rad + VC + IgG vs Rad + AZD7762 + anti-PD-L1, p = 0.0062. c KM survival curves for GL261 glioma-bearing CD8 KO mice. Survival analysis was performed using the log-rank test. The median survival duration in the treatment groups were as follows: Rad + VC + IgG, 23.5 days; Rad + VC + anti-PD-1, 23 days; Rad + AZD7762 + IgG, 24 days; Rad + AZD7762 + anti-PD-1, 24 days. Statistics: Rad + VC + IgG vs Rad + VC + anti-PD-1, p = 0.66; Rad + VC + IgG vs Rad + AZD7762 + IgG, p = 0.7; and Rad + VC + IgG vs Rad + AZD7762 + anti-PD-1, p = 0.78. Statistical significance on the figure is depicted as ns: not statistically significant, *p < 0.05, **p < 0.01. Source data for b, c are provided as a Source Data file.

References

    1. Stupp R, et al. Effect of tumor-treating fields plus maintenance temozolomide vs maintenance temozolomide alone on survival in patients with glioblastoma: a randomized clinical trial. JAMA. 2017;318:2306–2316. doi: 10.1001/jama.2017.18718. - DOI - PMC - PubMed
    1. Chongsathidkiet P, et al. Sequestration of T cells in bone marrow in the setting of glioblastoma and other intracranial tumors. Nat. Med. 2018;24:1459–1468. doi: 10.1038/s41591-018-0135-2. - DOI - PMC - PubMed
    1. Wainwright DA, et al. IDO expression in brain tumors increases the recruitment of regulatory T cells and negatively impacts survival. Clin. Cancer Res. 2012;18:6110–6121. doi: 10.1158/1078-0432.CCR-12-2130. - DOI - PMC - PubMed
    1. Wainwright DA, Sengupta S, Han Y, Lesniak MS. Thymus-derived rather than tumor-induced regulatory T cells predominate in brain tumors. Neuro Oncol. 2011;13:1308–1323. doi: 10.1093/neuonc/nor134. - DOI - PMC - PubMed
    1. Fecci PE, et al. Systemic anti-CD25 monoclonal antibody administration safely enhances immunity in murine glioma without eliminating regulatory T cells. Clin. Cancer Res. 2006;12:4294–4305. doi: 10.1158/1078-0432.CCR-06-0053. - DOI - PubMed

Publication types