. 2023 Mar 22;14(1):1577.
doi: 10.1038/s41467-023-36984-1.

Correlates of protection and viral load trajectories in omicron breakthrough infections in triple vaccinated healthcare workers

Affiliations

Correlates of protection and viral load trajectories in omicron breakthrough infections in triple vaccinated healthcare workers

Ulrika Marking et al. Nat Commun. .

Abstract

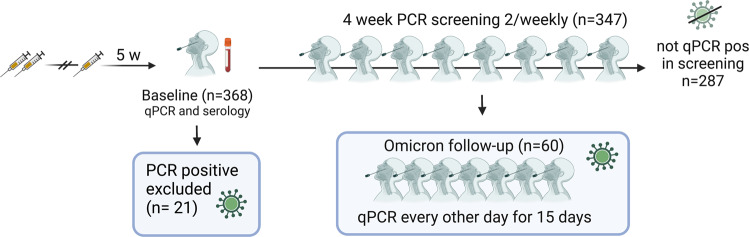
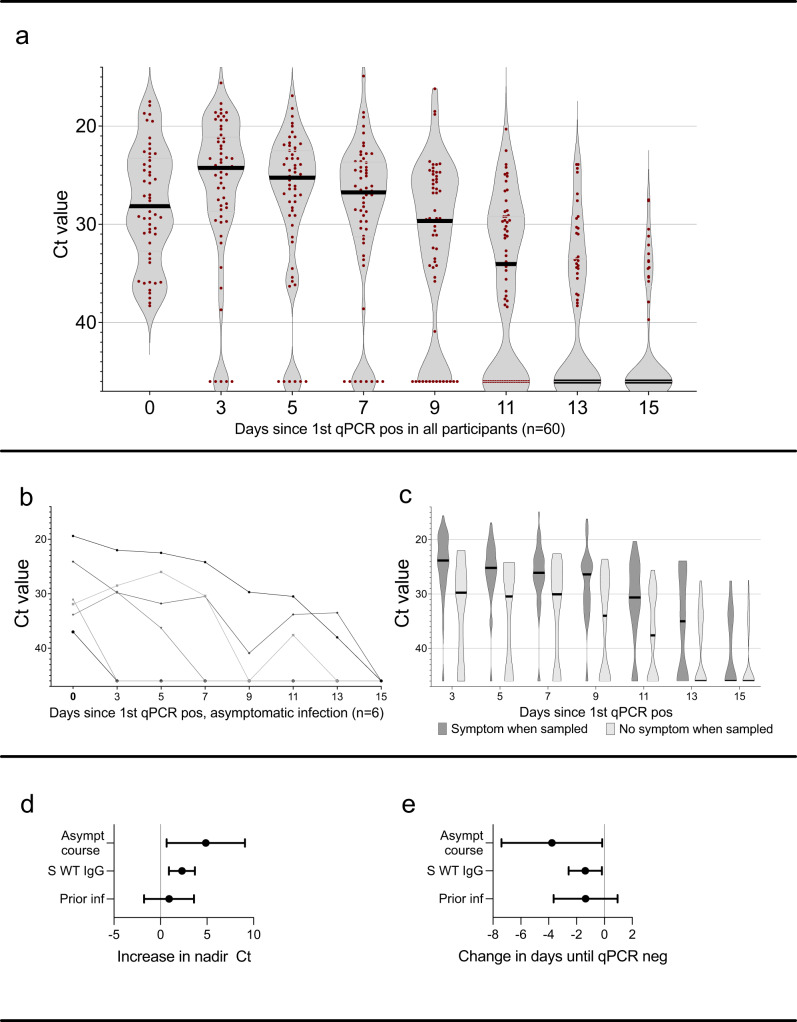
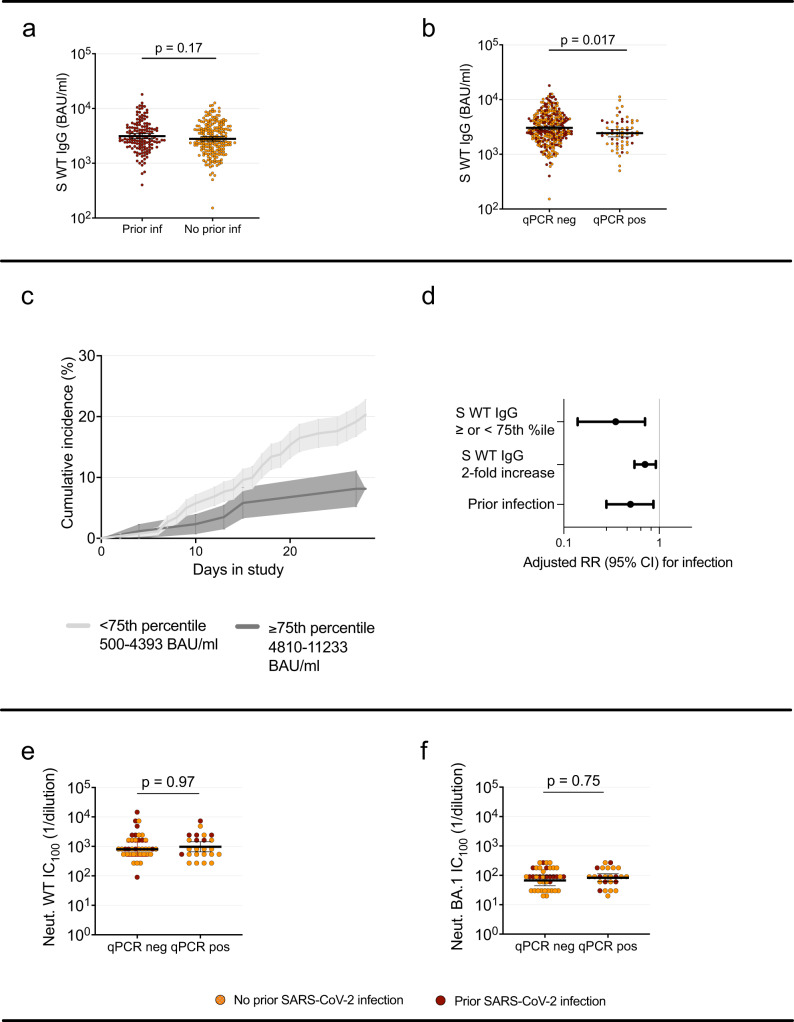
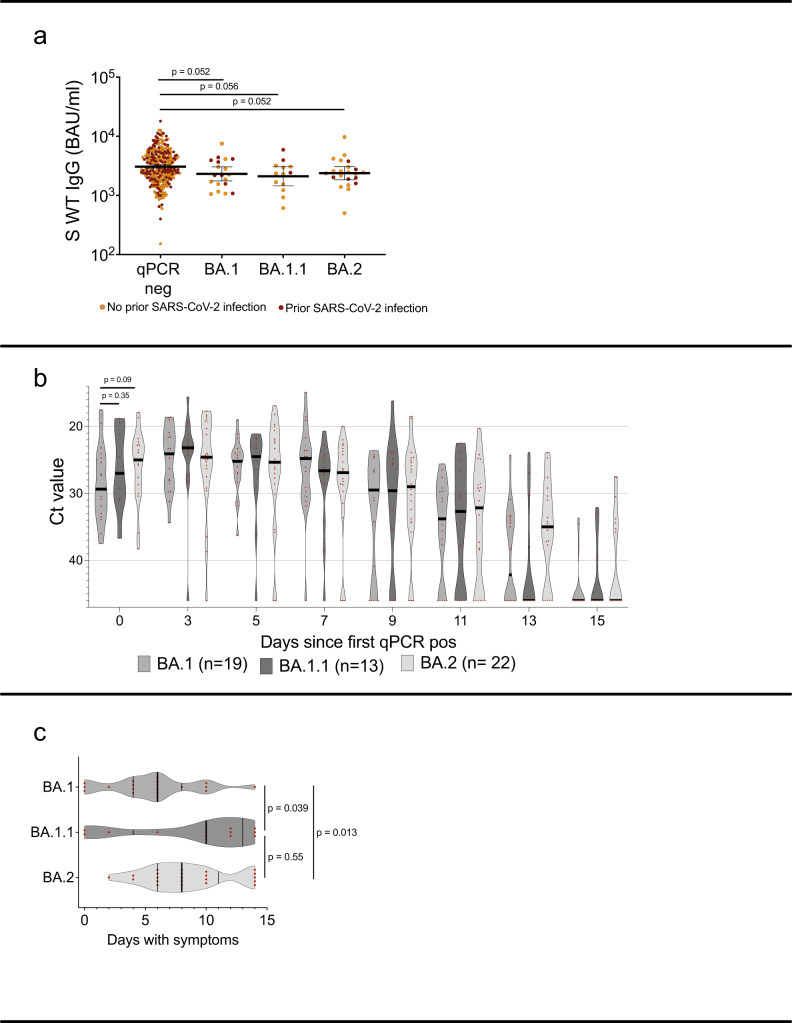
Vaccination offers protection against severe COVID-19 caused by SARS-CoV-2 omicron but is less effective against infection. Characteristics such as serum antibody titer correlation to protection, viral abundance and clearance of omicron infection in vaccinated individuals are scarce. We present a 4-week twice-weekly SARS-CoV-2 qPCR screening in 368 triple vaccinated healthcare workers. Spike-specific IgG levels, neutralization titers and mucosal spike-specific IgA-levels were determined at study start and qPCR-positive participants were sampled repeatedly for two weeks. 81 (cumulative incidence 22%) BA.1, BA.1.1 and BA.2 infections were detected. High serum antibody titers are shown to be protective against infection (p < 0.01), linked to reduced viral load (p < 0.01) and time to viral clearance (p < 0.05). Pre-omicron SARS-CoV-2 infection is independently associated to increased protection against omicron, largely mediated by mucosal spike specific IgA responses (nested models lr test p = 0.02 and 0.008). Only 10% of infected participants remain asymptomatic through the course of their infection. We demonstrate that high levels of vaccine-induced spike-specific WT antibodies are linked to increased protection against infection and to reduced viral load if infected, and suggest that the additional protection offered by pre-omicron SARS-CoV-2 infection largely is mediated by mucosal spike-specific IgA.


Conflict of interest statement

The authors declare no competing interests.

Figures

Fig. 1
Fig. 1. Overview of study cohort.
Nasal/oropharyngeal/saliva swabs for PCR, mucosal antibody analysis and serum were collected at enrolment (baseline). Participants who tested qPCR positive at enrolment (n = 21) were excluded from all analyses except for estimation of cumulative incidence. Self-administered nasal/oropharyngeal/saliva swabs for qPCR were collected twice weekly for 4 weeks or until positive qPCR test from participants who tested qPCR negative at enrolment (n = 347). Participants who subsequently tested qPCR positive during the screening program (n = 60) were enrolled in an extended program comprising self-administered nasal/oropharyngeal/saliva swabs for qPCR every other day for 15 days.
Fig. 2
Fig. 2. SARS-CoV-2 omicron viral load over the first 15 days of infection, symptom relation to Ct values and effects on nadir Ct and duration of qPCR positivity.
a Ct value during the first 15 days of breakthrough infection in all qPCR positive participants (n = 60), and (b) in participants with an asymptomatic course of infection (n = 6). c Ct values in participants who were symptomatic (dark grey) or asymptomatic (light grey) at time of sampling. d Increase in nadir Ct by asymptomatic course of infection, per two-fold increase in WT spike-specific IgG levels and prior SARS-CoV-2 infection and (e) change in days until viral clearance (qPCR neg test) by asymptomatic course of infection, per two-fold increase in WT spike-specific IgG levels and prior SARS-CoV-2 infection. Estimates in d and e are derived from linear regression models and error bars depict 95% confidence interval. Ct Cyclic threshold, qPCR qualitative polymerase chain reaction, pos positive, asympt asymptomatic, S WT serum spike-specific wild type, inf infection. Source data are provided as a Source Data file.
Fig. 3
Fig. 3. Effect of antibody levels and prior infection status on risk of infection, and pre-infection antibody titers in participants who subsequently tested qPCR positive or not.
a WT spike-specific serum-IgG at baseline in participants with (n = 144) and without (n = 203) prior SARS-CoV-2 infection. b WT spike-specific serum IgG at baseline in participants that remained qPCR negative (n = 287) and participants that tested qPCR positive (n = 60) during the screening period. c Cumulative incidence over the study period in participants with spike-specific serum IgG levels above/at (n = 87) or below (n = 260) 75th percentile. Shaded areas depict Standard Error. d Adjusted relative risk of infection among participants above (n = 87) vs below (n = 260) 75th percentile, per two-fold increase in WT spike-specific serum-IgG level and among those with and without prior infection. Estimates derived from a Poisson regression model and error bars depict 95% confidence interval. e Microneutralization titers against SARS-CoV-2 WT and (f) omicron BA.1 in participants that remained qPCR negative (n = 40) and participants that tested qPCR positive (n = 24) during the screening period. In (a), (b), (e) and (f), Mann-Whitney U test with a two-tailed p-value was performed without adjustment for multiple comparisons. Lines depict geometric mean titer and bars depict 95% confidence interval. S spike, WT Wild type, RR relative risk, CI confidence interval, Ct cyclic threshold, qPCR qualitative polymerase chain reaction, pos positive, neg negative, BAU binding antibody units, Neut microneutralizing titer, ns; p > 0.05. Source data are provided as a Source Data file.
Fig. 4
Fig. 4. Post booster WT spike-specific IgG levels with comparisons between subsequent omicron sublineage breakthrough infections.
a Post booster WT spike-specific IgG titers in participants that remained qPCR negative (n = 287) and in participants who tested positive with BA.1 (n = 19), BA1.1 (n = 13) or BA.2 (n = 22) infection during the screening period. b Ct values in qPCR positive participants the first 15 days of breakthrough infection with BA.1, BA.1.1 and BA.2. c Number of symptomatic days for participants who tested positive with BA.1, BA1.1 or BA.2 infection during the screening period. In (a), lines depict geometric mean titer and bars depict 95% confidence interval. In (b) and (c) lines depict median with IQR. Mann-Whitney U test with a two-tailed p-value was performed without adjustment for multiple comparisons. Pos Positive, Neg negative, S spike, WT wild-type, Ct cyclic threshold, BAU binding antibody units, ns; p > 0.05. Source data are provided as a Source Data file.

References

    1. Andrews N, et al. Covid-19 vaccine effectiveness against the Omicron (B.1.1.529) variant. N. Engl. J. Med. 2022;386:1532–1546. doi: 10.1056/NEJMoa2119451. - DOI - PMC - PubMed
    1. Abu-Raddad LJ, et al. Effect of mRNA vaccine boosters against SARS-CoV-2 Omicron infection in Qatar. N. Engl. J. Med. 2022;386:1804–1816. doi: 10.1056/NEJMoa2200797. - DOI - PMC - PubMed
    1. Lyngse, F.P. et al. SARS-CoV-2 Omicron VOC Transmission in Danish Households. medRxiv. 2021.2012.2027.21268278 (2021).
    1. Altarawneh HN, et al. Effects of previous infection and vaccination on symptomatic Omicron infections. N. Engl. J. Med. 2022;387:21–34. doi: 10.1056/NEJMoa2203965. - DOI - PMC - PubMed
    1. Khoury DS, et al. Neutralizing antibody levels are highly predictive of immune protection from symptomatic SARS-CoV-2 infection. Nat. Med. 2021;27:1205–1211. doi: 10.1038/s41591-021-01377-8. - DOI - PubMed

Publication types