. 2023 Mar 22;14(1):1591.
doi: 10.1038/s41467-023-37161-0.

YBX1 integration of oncogenic PI3K/mTOR signalling regulates the fitness of malignant epithelial cells

Affiliations

YBX1 integration of oncogenic PI3K/mTOR signalling regulates the fitness of malignant epithelial cells

Yuchen Bai et al. Nat Commun. .

Abstract

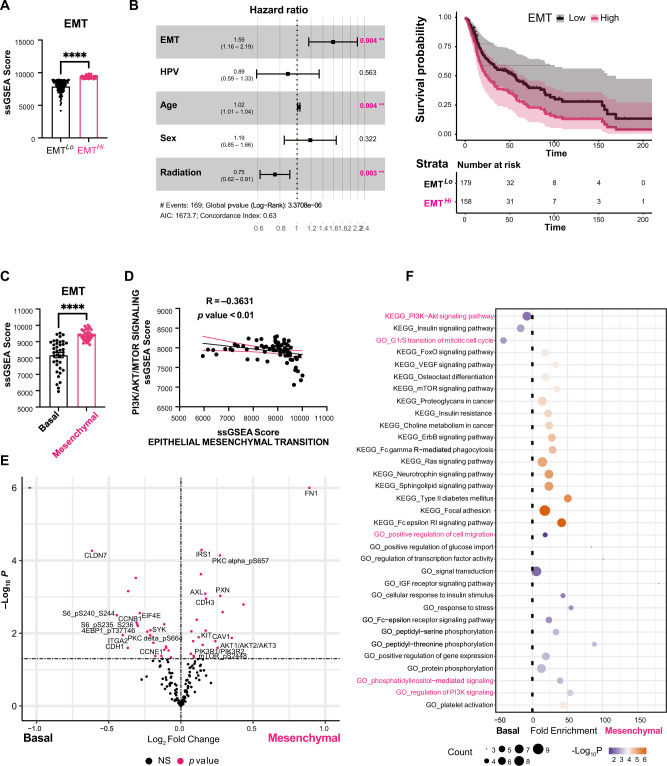
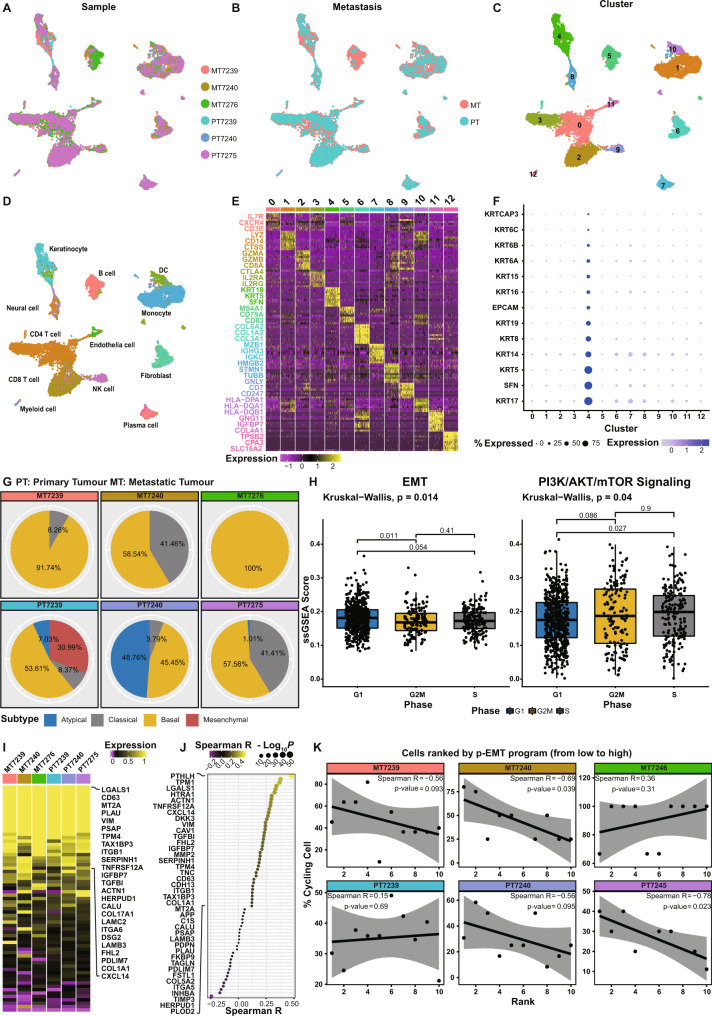
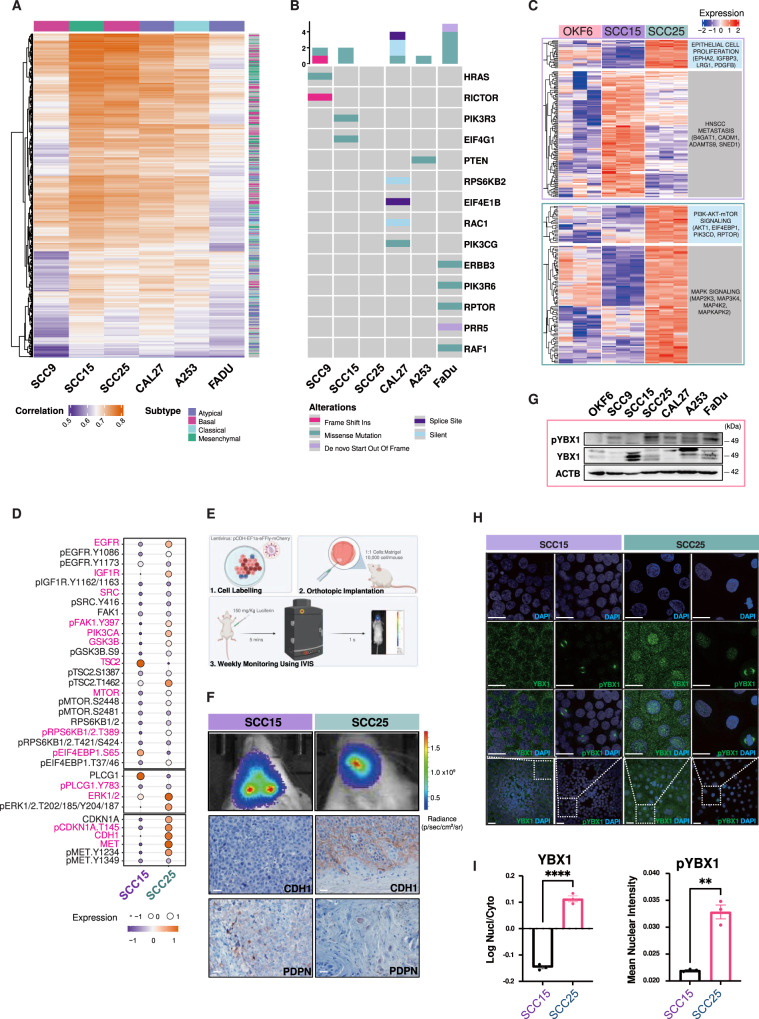
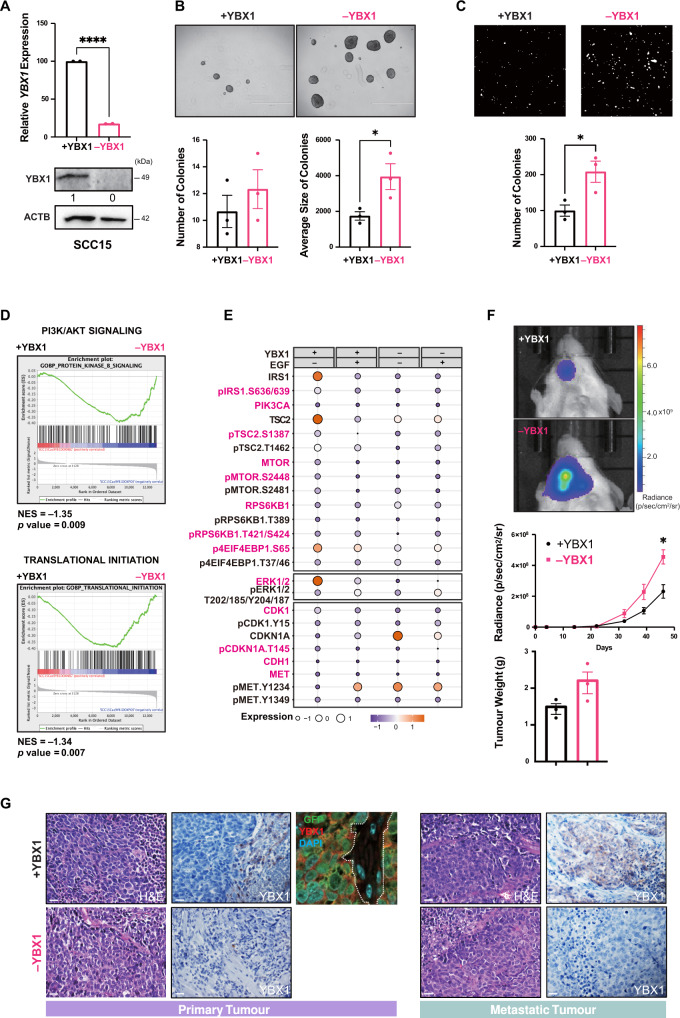
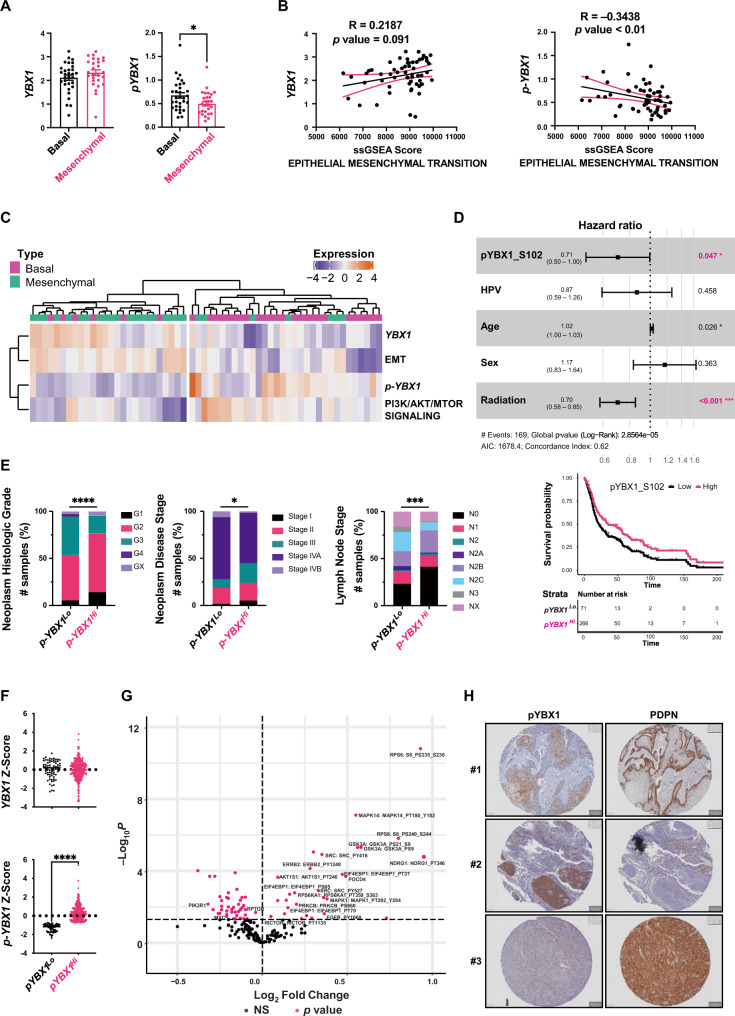
In heterogeneous head and neck cancer (HNC), subtype-specific treatment regimens are currently missing. An integrated analysis of patient HNC subtypes using single-cell sequencing and proteome profiles reveals an epithelial-mesenchymal transition (EMT) signature within the epithelial cancer-cell population. The EMT signature coincides with PI3K/mTOR inactivation in the mesenchymal subtype. Conversely, the signature is suppressed in epithelial cells of the basal subtype which exhibits hyperactive PI3K/mTOR signalling. We further identify YBX1 phosphorylation, downstream of the PI3K/mTOR pathway, restraining basal-like cancer cell proliferation. In contrast, YBX1 acts as a safeguard against the proliferation-to-invasion switch in mesenchymal-like epithelial cancer cells, and its loss accentuates partial-EMT and in vivo invasion. Interestingly, phospho-YBX1 that is mutually exclusive to partial-EMT, emerges as a prognostic marker for overall patient outcomes. These findings create a unique opportunity to sensitise mesenchymal cancer cells to PI3K/mTOR inhibitors by shifting them towards a basal-like subtype as a promising therapeutic approach against HNC.


Conflict of interest statement

The authors declare no competing interests.

Figures

Fig. 1
Fig. 1. The EMT signature inversely correlates with PI3K pathway activation in basal and mesenchymal HNC patient subtypes.
A Stratification of patient HNC based on the single-sample Gene Set Enrichment Analysis (ssGSEA) score of hallmark EMT genes using TCGA-HNC mRNA-seq data identified EMTLo (n = 127) and EMTHi (n = 84) patient groups. The comparison between the two groups was performed using an unpaired t test (**** two-tailed p-value < 0.0001). Data are shown as mean ± SEM. B Hazard ratio (HR) and adjusted Kaplan-Meier curve analyses of EMT for overall survival of n = 337 patients from the TCGA-HNC cohort. HRs were estimated using multivariate Cox proportional hazard models. Asterisks indicate statistical significance per clinically-relevant factor. HR estimates are shown as dots at the centre of error bars and error bars represent 95% confidence intervals of hazard ratios by two-sided Wald test. C The EMT ssGSEA score was significantly higher in mesenchymal (n = 34) compared to basal (n = 38) HNC subtype. The results are presented as mean ± SEM with **** two-tailed p-value < 0.0001. The comparison between the two groups was performed using an unpaired t test. D Significantly negative correlation between ssGSEA scores of the EMT and PI3K/AKT/mTOR gene sets from the basal and mesenchymal HNC (n = 72, Spearman’s correlation, R = –0.3631, two-sided p-value=0.0017). 95% confidence bands of the best-fit line are shown in pink. E Volcano plot of differentially expressed proteins between basal and mesenchymal HNC samples using the TCGA-HNC reverse-phase protein array (RPPA) data. Labelled proteins associated with EMT were upregulated in the mesenchymal subtype and those associated with PI3K/AKT/mTOR were upregulated in the basal subtype. Significant differentially expressed proteins with two-sided q-value < 0.05 are highlighted in pink, NS (not significant). The comparison between the two groups was performed using an unpaired t test. F Gene Ontology (GO) and Kyoto Encyclopaedia of Genes and Genomes (KEGG) terms enrichment for significant DEGs using DAVID functional annotation bioinformatics microarray analysis. Basal HNC showed enrichment for PI3K/mTOR signalling and mitotic activation while mesenchymal samples were enriched for migratory activation. Statistical values were considered significant at a false discovery rate (FDR) with two-sided p-value < 0.01. Source data are provided as a Source Data file.
Fig. 2
Fig. 2. Single cell analysis of patient HNC uncovered an epithelial-specific opposite signatures for partial EMT and PI3K signalling.
A–C UMAP plot of single cells from 6 primary and metastatic patient tumours assigned to 13 clusters using the “uwot” package. MT: metastatic tumours collected from lymph nodes; PT: primary tumours. D The clusters were assigned to the indicated cell types by differentially expressed genes and presented as (E) heatmaps. Yellow: high expression; purple: low expression. Selected genes are highlighted and labelled in cluster-matching colours. F Dot plot shows gene expression of epithelial cell markers across the clusters containing 12,341 single cells that were sorted by average expression of these genes. Blue: high expression; gray: low expression; the size of the dots indicates the percentage of cells expressing specific genes. G Pie chart shows the percentage of primary (PT) and metastatic (MT) tumour cells matching atypical, classical, basal and metastatic subtype signatures. H Box plots indicating ssGSEA EMT scores were significantly higher in G1 compared to G2M/S phase indicating EMT is high in non-proliferating cells. Conversely, PI3K/AKT/mTOR hallmark gene set scores were significantly higher in S phase indicating cell proliferation. Comparisons between groups (G1 = 587, G2M = 146, S = 191 cells) were performed using Kruskal-Wallis t test and unpaired two samples Wilcoxon test. Median values are shown in each boxplot. All box plots include the median line, the box denotes the interquartile range (IQR), whiskers denote the rest of the data distribution and outliers are denoted by points greater than ±1.5 × IQR. I Heatmap shows the expression of common p-EMT genes in metastatic and primary patient tumours. J Dot plot illustrates a positive Spearman correlation (two-sided p-value < 0.01) between the genes and p-EMT program in cancer cells. K Scatter graphs show a decreasing percentage of cycling malignant cells and increasing p-EMT ssGSEA scores. The malignant cells are divided into ten sliding windows for each tumour. The consistent negative correlation was calculated using Spearman’s correlation test with two-sided p-value. 95% confidence bands of the best-fit line are shown in gray. Source data are provided as a Source Data file.
Fig. 3
Fig. 3. A subtype-specific negative correlation between partial EMT and PI3K signalling in vitro and in vivo.
A Heatmap of Spearman’s correlations between HNC cell lines (x-axis) and TCGA-HNC primary tumours (y-axis). The HNC lines were classified as atypical (FADU and CAL27), classical (A253), basal (SCC9 and SCC25) and mesenchymal (SCC15) based on subtype-specific TCGA-HNC gene signatures. The subtype annotation bar is shown on top of the heatmap and on the right for TCGA-HNC primary tumours. B PI3K/AKT/mTOR signalling-related mutations were identified using CCLE and OncoPrint. C Heatmap showing mRNA expression of EMT markers and PI3K/AKT/mTOR signalling in normal-OKF6, basal-SCC25 and mesenchymal-SCC15 cells. D RPPA analyses of PI3K/AKT/mTOR signalling and EMT markers. Expression levels are shown as fluorescence intensity values for differentially expressed proteins (one-way ANOVA p-value < 0.05) and highlighted in pink. Circles and colours represent the level of expression for each protein. E Schematic illustration of orthotopic xenografts of HNC cells in NSG mouse tongues. Cells transduced with a lentivirus-containing luciferase gene were injected into the tongue and mice monitored weekly using PerkinElmer IVIS® Spectrum imaging system. F Representative images of bioluminescence at 38 days post-orthotropic implantation. IHC analysis of p-EMT markers in SCC15 and SCC25 xenografts. The epithelial marker CDH1 was expressed in SCC25 while the p-EMT marker PDPN was detected in SCC15. Magnification, X40; scale bars, 50 μm. G WB analysis of YBX1 and phospho-YBX1 in the HNC lines. β-actin was used as loading control. Data are representative of n = 2 biological replicates. H Immunofluorescence (IF) of YBX1 and p-YBX1 in SCC15 and SCC25. DAPI was used as counterstaining. Magnification, X40; scale bars, 50 μm. I Cytoplasmic and nuclear localisation of YBX1 and pYBX1 were quantitated using ImageJ from three independent experiments. YBX1 was localised in the cytoplasm of both lines with low nuclear detection of pYBX1 in mesenchymal SCC15 and high pYBX1 in the nucleus of basal SCC25 cells. Data are shown as mean ± SEM. The comparison between the two groups was performed using an unpaired t test (**p-value = 0.0011, ****p-value < 0.0001). Source data are provided as a Source Data file. Schematic Fig. 3E was created using Biorender.com.
Fig. 4
Fig. 4. Loss of YBX1 inhibits cell proliferation in basal-like HNC cells with active PI3K signalling.
A CRISPR-Cas9 DOX-induced (1 μM, 72 hours) YBX1-knockdown in SCC25 resulted in ~80% downregulation (** two-sided p-value=0.0052) of YBX1 by Q-PCR (upper panel) and WB (lower panel). WB images were quantified using ImageJ (n = 2 independent experiments). B Compared to SCC25 ( + YBX1), SCC25 (–YBX1) grew fewer (* p-value=0.01) and smaller colonies (** p-value=0.0016) on ultra-low attachment plates for seven days. Images of spheroids were captured using an EVOS cell-imaging microscope. The number and average size of colonies were quantified using ImageJ (n = 3 experiments). C Transwell invasion of SCC25 (–YBX1) cells (n = 3 experiments). The number of invading cells was quantified using ImageJ. Magnification, X40; scale bars, 500 μm, * p-value = 0.0144. D GO and KEGG term enrichments for significant DEGs showed enrichment for genes involved in G2/M checkpoint suppression and ribosomal biogenesis, activation of apoptosis and anti-tumour inflammatory responses. E Significant loss of E2F, YY1 and MYC/MAX target genes in SCC25 (–YBX1) using GSEA regulatory target gene sets. The adjusted significance was empirically determined by 1000 gene-set permutations. F RPPA analyses of PI3K/AKT/mTOR signalling and EMT markers in SCC25 (–/+YBX1) treated with EGF (100 ng/mL) for 30 mins. Expression levels are shown as fluorescence intensity values for differentially expressed proteins (one-way ANOVA p-value < 0.05) and highlighted in pink. G Bioluminescence imaging of SCC25 –YBX1 (pink) and SCC25 + YBX1 (black) tumours (n = 3 experiments, 3 mice/group/experiments) at 38 days post-implantation. The radiance of bioluminescence was measured weekly, and data shown as mean ± SEM at each timepoint (* p-value = 0.0179, ** p-value = 0.0018). Tumours were weighed at sacrifice, and data shown as mean ± SEM (** p-value = 0.0085). H Optical images showing significant growth inhibition of SCC25 (–YBX1) xenografts and H&E staining of undifferentiated SCC25 ( + YBX1) compared to SCC25 (–YBX1). IHC confirmed loss of YBX1 in SCC25 (–YBX1) tumours. Magnification, X40; scale bars, 50 μm. (AC) and (G) data are shown as mean ± SEM. The comparison between the two groups was performed using an unpaired two-sided t test (*p-value < 0.05, **p-value < 0.01, ****p-value < 0.0001). Source data are provided as a Source Data file.
Fig. 5
Fig. 5. Cytoplasmic YBX1 induces p-EMT in the absence of PI3K signalling.
A CRISPR-Cas9 DOX-induced (1 μM, 72 hours) YBX1-knockdown in SCC15 cells resulted in ~80% downregulation (****p-value < 0.0001) of YBX1 by Q-PCR (upper panel) and WB (lower panel). WB images were quantified using ImageJ (n = 2 independent experiments) B Compared to SCC15 ( + YBX1), SCC15 (–YBX1) cells grew more and bigger colonies (* p-value = 0.0448) on ultra-low attachment plates for seven days. Images of spheroids were captured using an EVOS cell imaging microscope. The number and average size of colonies were quantitated using the ImageJ (n = 3 experiments). C Transwell invasion of SCC15 (–YBX1) cells (n = 3 experiments). The number of invading cells was quantitated using ImageJ. Magnification, X40; scale bars, 500 μm, * p-value = 0.0321. D Significant enrichments for the protein kinase B signalling and the translation initiation in SCC15 (–YBX1) cells using GO gene sets. The significance was empirically determined by 1000 gene-set permutations. E RPPA analyses of PI3K/AKT/mTOR signalling and EMT markers in SCC15 (–/ + YBX1) treated with EGF (100 ng/mL) for 30 mins. Expression levels are shown as relative fluorescence intensity values for differentially expressed proteins (one-way ANOVA p-value<    0.05) and highlighted in pink. F Bioluminescence imaging of live animals injected with either SCC15 (–YBX1) or SCC15 ( + YBX1) (n = 3 experiments, 3 mice/group/experiments) at 38 days post-transplantation. The radiance of bioluminescence was measured weekly, and data shown as mean ± SEM at each timepoint (*p-value = 0.0247). Tumours were weighed at sacrifice, and data shown as mean ± SEM. G Acceleration of orthotopic tumour growth for SCC15 (–YBX1) confirmed by H&E staining of tumours and IHC showing loss of YBX1 in primary and metastatic tumours compared to SCC15 ( + YBX1). Magnification, X40; scale bars, 50μm. (AC) and (F) data are shown as mean ± SEM. The comparison between the two groups was performed using an unpaired two-sided t test (*p-value < 0.05, **p-value < 0.01, ****p-value < 0.0001). Source data are provided as a Source Data file.
Fig. 6
Fig. 6. The PI3K-phospho-YBX1 axis in basal and mesenchymal HNC subtypes predicts patient prognosis.
A YBX1 expression in patients’ HNC did not vary between basal (n = 31) and mesenchymal subtypes (n = 27) however, phospho-YBX1 was significantly higher in the basal group. Data are shown as mean ± SEM. The comparison between the two groups was performed using an unpaired two-tailed t test (* p-value = 0.0246). B The correlation of ssGSEA scores between the hallmark EMT gene set and YBX1 (R = 0.2187, two-sided p-value = 0.091) or phospho-YBX1 (R = –0.3438, p-value < 0.01) from basal and mesenchymal HNC (n = 58, Spearman’s correlation). 95% confidence bands of the best-fit line are shown in pink. C Heatmap showing unsupervised clustering of HNC samples correlating levels of YBX1 and EMT ssGSEA with the basal subtype, and levels of phospho-YBX1 and PI3K/AKT/mTOR signalling ssGSEA with the mesenchymal subtype. D HR and adjusted Kaplan-Meier curve analyses of pYBX1 for overall survival of n = 337 patients from the TCGA-HNC cohort. HRs were estimated using multivariate Cox proportional hazard models. Asterisks indicate statistical significance per clinically-relevant factor. HR estimates are shown as dots at the centre of error bars and error bars represent 95% confidence intervals of hazard ratios by two-sided Wald test. E Neoplasm histologic grade, neoplasm disease stage, and lymph node stage from the TCGA-HNC were compared for p-YBX1Hi and p-YBX1Lo HNC. p-value was calculated using Pearson’s Chi-square test (*p-value = 0.0255, *** p-value = 0.0006, ****p-value < 0.0001). F YBX1 and phospho-YBX1 levels in the p-YBX1Lo (n = 71) and p-YBX1Hi (n = 274) patient groups. Data are shown as mean ± SEM. The comparison between the two groups was performed using an unpaired two-tailed t test (****p-value < 0.0001). G Volcano plot of differentially expressed proteins between p-YBX1Lo (n = 71) and p-YBX1Hi (n = 241) using the TCGA-HNC RPPA data. Labelled proteins associated with the PI3K/mTOR signalling were upregulated in p-YBX1Hi tumours. Significant differentially expressed proteins with two-sided q-value < 0.05 are highlighted in pink, NS (not significant). H IHC staining for phospho-YBX1 and PDPN in patient HNC tissue arrays. Expression of p-YBX1 and PDPN was mutually exclusive in proliferative cells at the core of primary tumours and the invasive front. Source data are provided as a Source Data file.
Fig. 7
Fig. 7. Schematic diagram depicting the PI3K-phospho-YBX1 proliferation axis in HNC.
Oncogenic activation of PI3K signalling induces phosphorylation of YBX1 and nuclear translocation to promote cellular proliferation. Inactive PI3K signalling correlates with the cytoplasmic accumulation of YBX1 and the induction of EMT protein translation. The schematic was created using Biorender.com.

References

    1. Johnson DE, et al. Head and neck squamous cell carcinoma. Nat. Rev. Dis. Primers. 2020;6:92. doi: 10.1038/s41572-020-00224-3. - DOI - PMC - PubMed
    1. Chow LQM. Head and neck cancer. N. Engl. J. Med. 2020;382:60–72. doi: 10.1056/NEJMra1715715. - DOI - PubMed
    1. Lambert AW, Pattabiraman DR, Weinberg RA. Emerging biological principles of metastasis. Cell. 2017;168:670–91. doi: 10.1016/j.cell.2016.11.037. - DOI - PMC - PubMed
    1. Duprez F, et al. Distant metastases in head and neck cancer. Head & Neck. 2017;39:1733–43. doi: 10.1002/hed.24687. - DOI - PubMed
    1. Nguyen B, et al. Genomic characterization of metastatic patterns from prospective clinical sequencing of 25,000 patients. Cell. 2022;185:563–75 e11. doi: 10.1016/j.cell.2022.01.003. - DOI - PMC - PubMed

Publication types

MeSH terms

Substances