. 2023 Mar 22;14(1):1582.
doi: 10.1038/s41467-023-37079-7.

Assessment of community efforts to advance network-based prediction of protein-protein interactions

Affiliations

Assessment of community efforts to advance network-based prediction of protein-protein interactions

Xu-Wen Wang et al. Nat Commun. .

Abstract

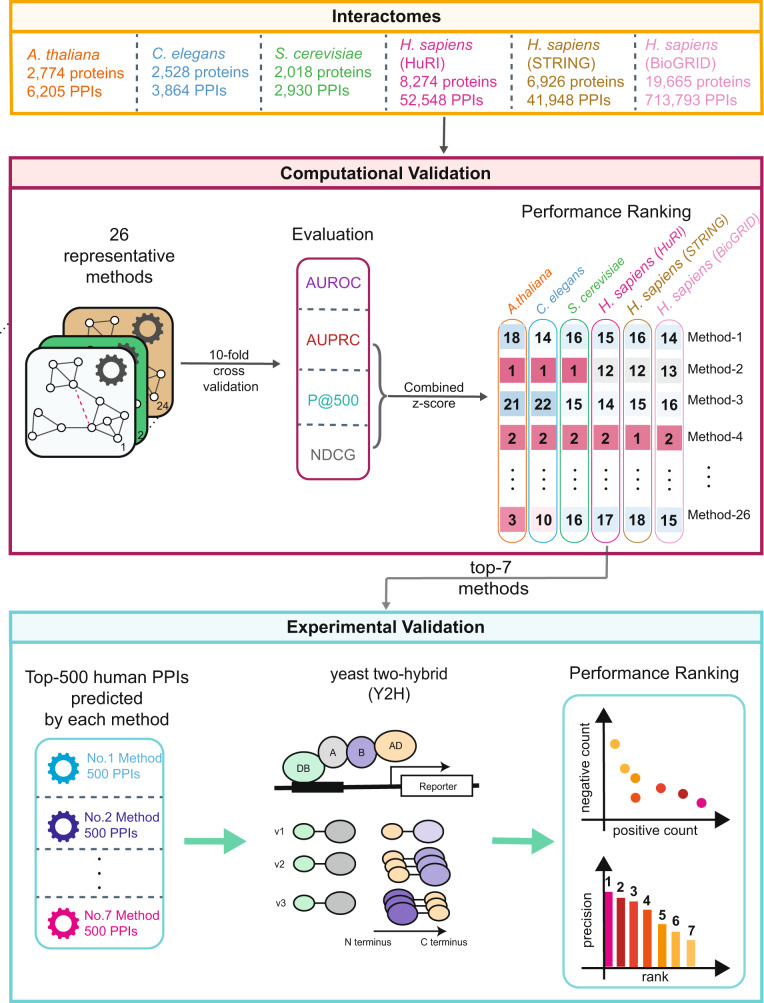
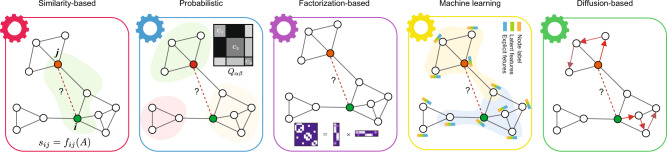
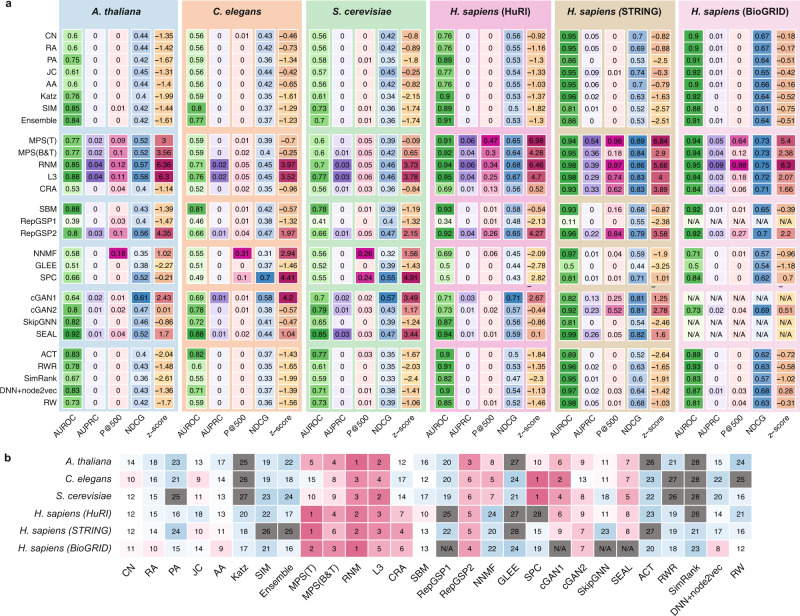
Comprehensive understanding of the human protein-protein interaction (PPI) network, aka the human interactome, can provide important insights into the molecular mechanisms of complex biological processes and diseases. Despite the remarkable experimental efforts undertaken to date to determine the structure of the human interactome, many PPIs remain unmapped. Computational approaches, especially network-based methods, can facilitate the identification of previously uncharacterized PPIs. Many such methods have been proposed. Yet, a systematic evaluation of existing network-based methods in predicting PPIs is still lacking. Here, we report community efforts initiated by the International Network Medicine Consortium to benchmark the ability of 26 representative network-based methods to predict PPIs across six different interactomes of four different organisms: A. thaliana, C. elegans, S. cerevisiae, and H. sapiens. Through extensive computational and experimental validations, we found that advanced similarity-based methods, which leverage the underlying network characteristics of PPIs, show superior performance over other general link prediction methods in the interactomes we considered.


Conflict of interest statement

PF is the founder and CEO of Pharmahungary Group, a group of R&D companies. EKS has received institutional grant support from Bayer and GlaxoSimthKline. A-LB is co-scientific founder of and is supported by Scipher Medicine, Inc., which applies network medicine strategies to biomarker development and personalized drug selection, and is the founder of Naring Inc., which applies data science to health and nutrition. The remaining authors declare no competing interests.

Figures

Fig. 1
Fig. 1. Workflow of the INMC PPI prediction project.
26 representative network-based methods were systematically evaluated to predict PPIs in the interactome of four different organisms: A. thaliana, C. elegans, S. cerevisiae, H. sapiens: HuRI, STRING and BioGRID (using rTRM package). During the computational validation, the PPIs of each interactome were divided into training set and validation set through 10-fold cross-validation. The performance of each method was evaluated using four standard metrics: AUROC, AUPRC, P@500, NDCG. For each method, an overall score was defined as the sum of z-scores of three metrics (AUPRC, P@500 and NDCG) for each interactome. Top-seven methods were selected based on their performance in predicting human PPIs during the computational validation. Using the entire human interactome, each of the top-seven methods predicted the top-500 human PPIs for experimental validation using the Y2H assay. PPI: protein–protein interaction. AUROC: Area Under the Receiver Operating Characteristic curve. AUPRC: Area Under the Precision-Recall Curve. P@500: Precision of the top-500 predicted PPIs. NDCG: Normalized Discounted Cumulative Gain. Y2H: yeast two-hybrid assay. v1-v3: assay 1-assay 3.
Fig. 2
Fig. 2. Diagram of the five major categories of link prediction methods.
(1) Similarity-based methods. These methods quantify the likelihood of links based on predefined similarity functions among nodes in the graph, i.e., the common neighbors (green area). (2) Probabilistic methods. These methods assume that real networks have some structure, e.g., community structure. The goal of these algorithms is to select model parameters that can maximize the likelihood of the observed structure. The connecting probability of nodes within a community is higher than that between different communities (gray matrix). (3) Factorization-based: The goal of these methods is to learn a lower dimensional representation for each node in the graph by preserving the global network patterns. Next, the compressed representation is leveraged to predict unobserved PPIs by either calculating a similarity function or training a classifier. (4) Machine learning: There are numerous methods among machine learning categories; here, we illustrate this category using the state-of-the-art graph neural networks (GNN). Those methods embed node information by aggregating the node features, link features and graph structure using a neural network and passing the information through links in the graph. Thereafter, the learned representations are used to train a supervised model to predict the missing links. (5) Diffusion-based: These methods use techniques based on the analysis of the information gleaned from the movement of a random walker diffusion over the network (paths indicated by red arrows).
Fig. 3
Fig. 3. Computational evaluation of the PPI prediction methods.
The details of each method are summarized in Table 1. a Heatmap plots show the performance of each method on each interactome with the following evaluation metrics: AUROC, AUPRC, P@500, and NDCG. The overall performance is calculated from z-scores of three metrics. For each metric, darker color represents better performance. b The ranking of the 26 methods on the six interactomes by z-scores. Note that, the performances of ReGSP1, cGAN1, SEAL and SkipGNN on the BioGRID database were not evaluated due to the prohibitive computational cost. We marked their rankings as N/A. Note that AUROC was excluded in calculating the combined z-score and ranking for each method.
Fig. 4
Fig. 4. Patterns of top-500 PPIs predicted by the top-seven human PPI prediction methods.
a For these top-seven methods, we examined the distribution of absolute value between the degrees of each protein pair. b Degree distribution of the H. sapiens (HuRI) interactome and the mean degree of proteins involved in the top-500 predicted PPIs of each method in log-log plot. k denotes the degree of a protein.
Fig. 5
Fig. 5. Experimental evaluation of the top-seven human PPI prediction methods.
A protein pair is considered to be positive if it is positive in at least one of the three Y2H assays, and negative if it is negative in all the three assays. MPS(B&T) is the most promising method, which simultaneously offers the highest number (376) of positive pairs and the lowest number (54) of negative pairs among its top-500 predicted PPIs, yielding a precision of 87.4%. Note that the number of unsuccessfully tested protein pairs (e.g., due to a pipetting failure) is not included in the precision calculation and this figure. See Supplementary Table 3 for the positive count, negative count, unsuccessful test count, and the precision of other methods.
Fig. 6
Fig. 6. Structural relationships among previously uncharacterized human PPIs.
This network consists of all the 1177 previously uncharacterized human PPIs predicted by the top-seven methods and validated by Y2H assays. Those PPIs that were predicted by a single method were colored based on the method that predicted them. Those PPIs that were predicted (i.e., among the top-500 predicted PPIs) by multiple methods were colored in black, with edge width proportional to the number of methods predicting this PPI. Nodes (proteins) are colored based on the connected component to which they belong. Node size is proportional to its degree. Note that there are in total 174 isolated nodes, representing self-interacting proteins (which were mostly detected by cGAN1).

References

    1. Vidal M, Cusick ME, Barabási A-L. Interactome networks and human disease. Cell. 2011;144:986–998. doi: 10.1016/j.cell.2011.02.016. - DOI - PMC - PubMed
    1. Rolland T, et al. A proteome-scale map of the human interactome network. Cell. 2014;159:1212–1226. doi: 10.1016/j.cell.2014.10.050. - DOI - PMC - PubMed
    1. Menche, J. et al. Uncovering disease-disease relationships through the incomplete interactome. Science347, 1257601 (2015). - PMC - PubMed
    1. Luck K, et al. A reference map of the human binary protein interactome. Nature. 2020;580:402–408. doi: 10.1038/s41586-020-2188-x. - DOI - PMC - PubMed
    1. Keskin O, Tuncbag N, Gursoy A. Predicting protein–protein interactions from the molecular to the proteome level. Chem. Rev. 2016;116:4884–4909. doi: 10.1021/acs.chemrev.5b00683. - DOI - PubMed

Publication types