. 2023 Mar 22;14(1):1573.
doi: 10.1038/s41467-023-37217-1.

Epigenetic state determines the in vivo efficacy of STING agonist therapy

Affiliations

Epigenetic state determines the in vivo efficacy of STING agonist therapy

Rana Falahat et al. Nat Commun. .

Abstract

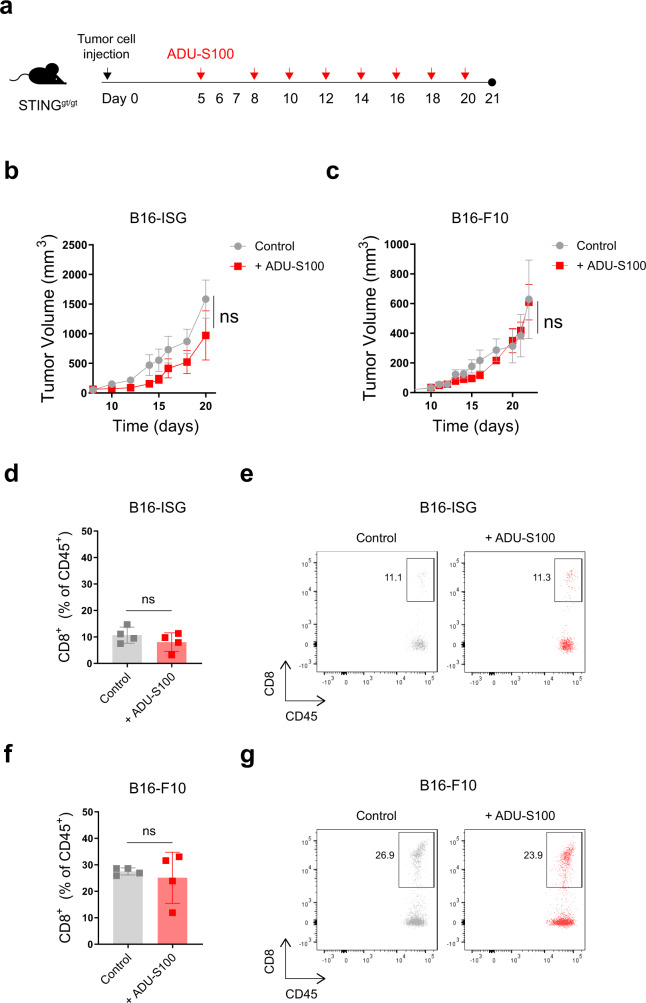
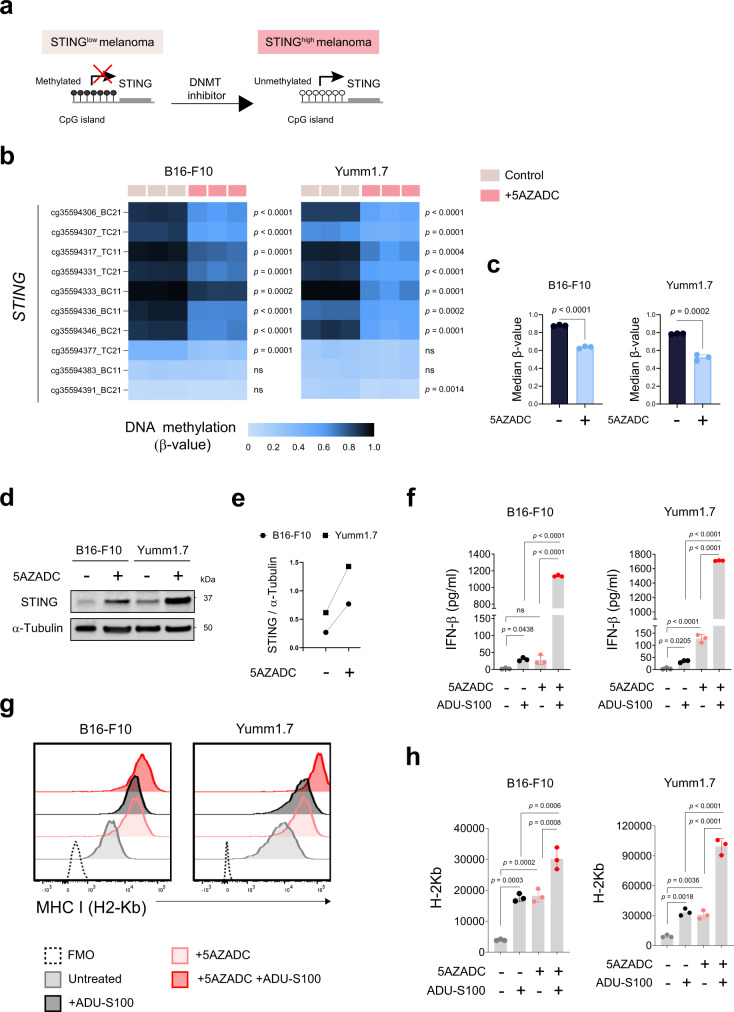
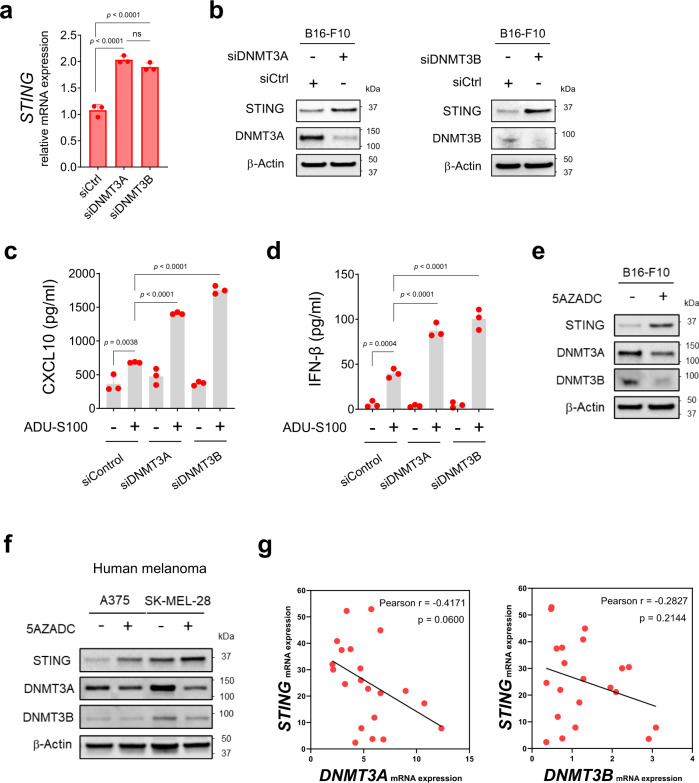
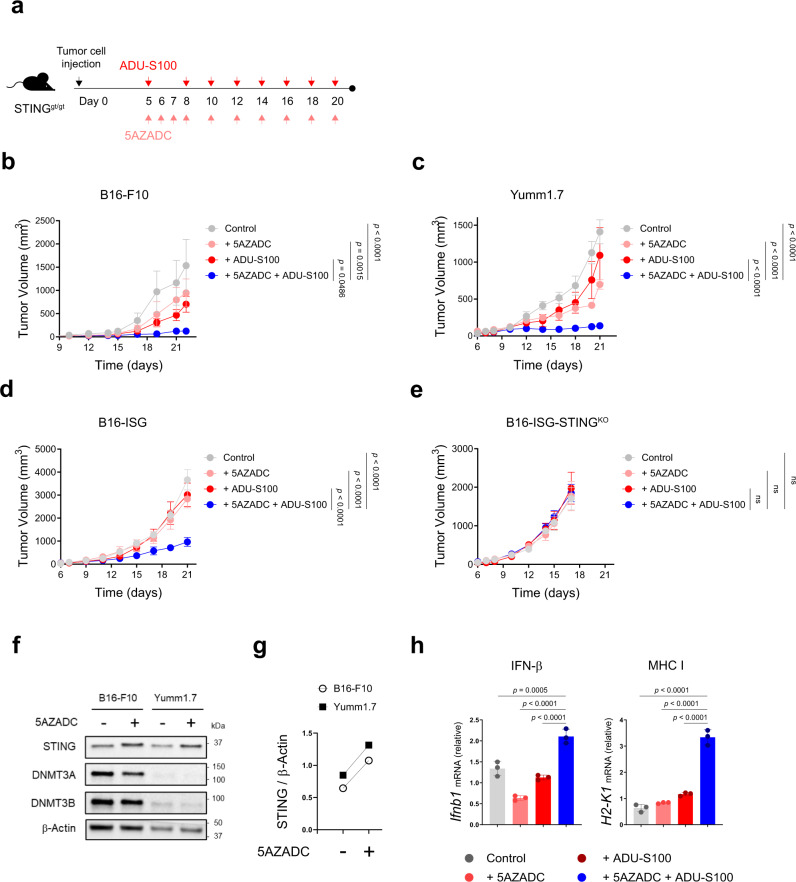
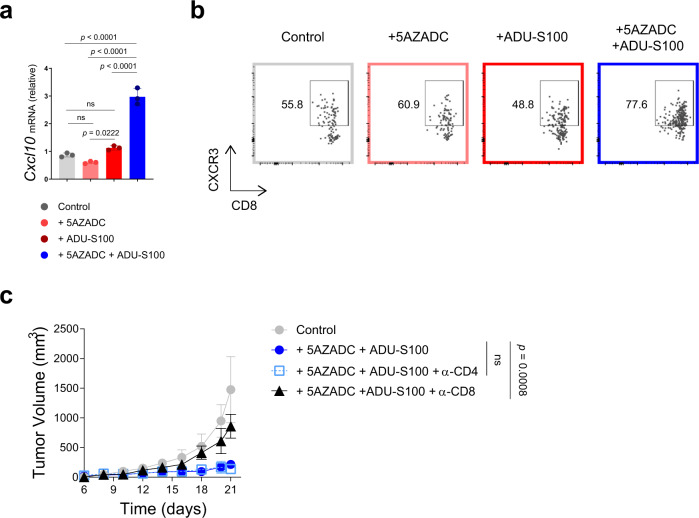
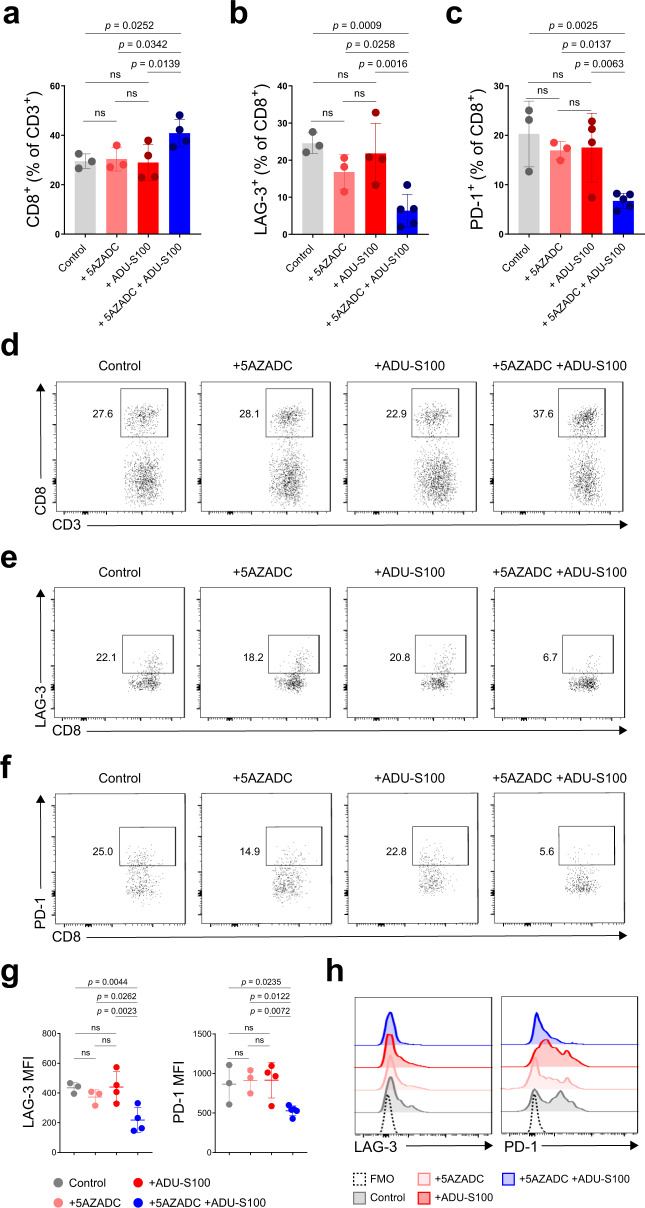
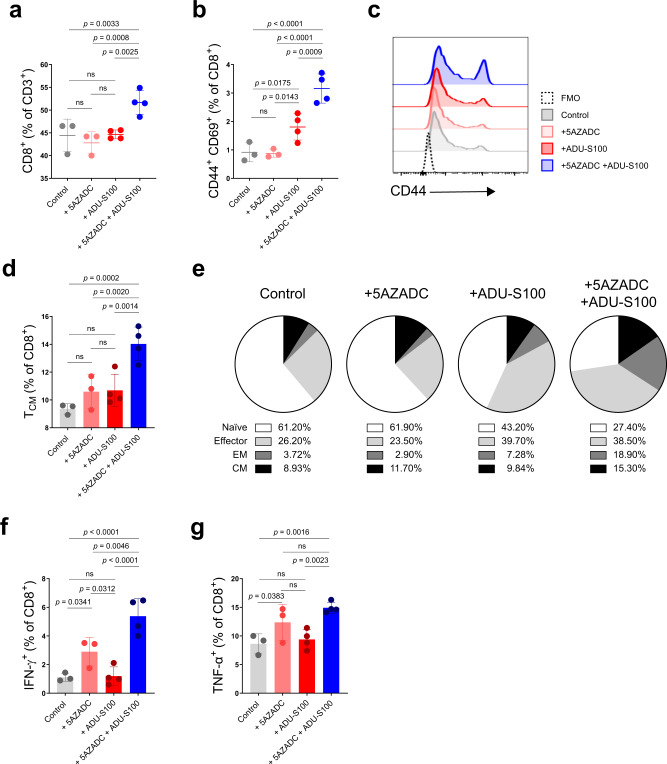
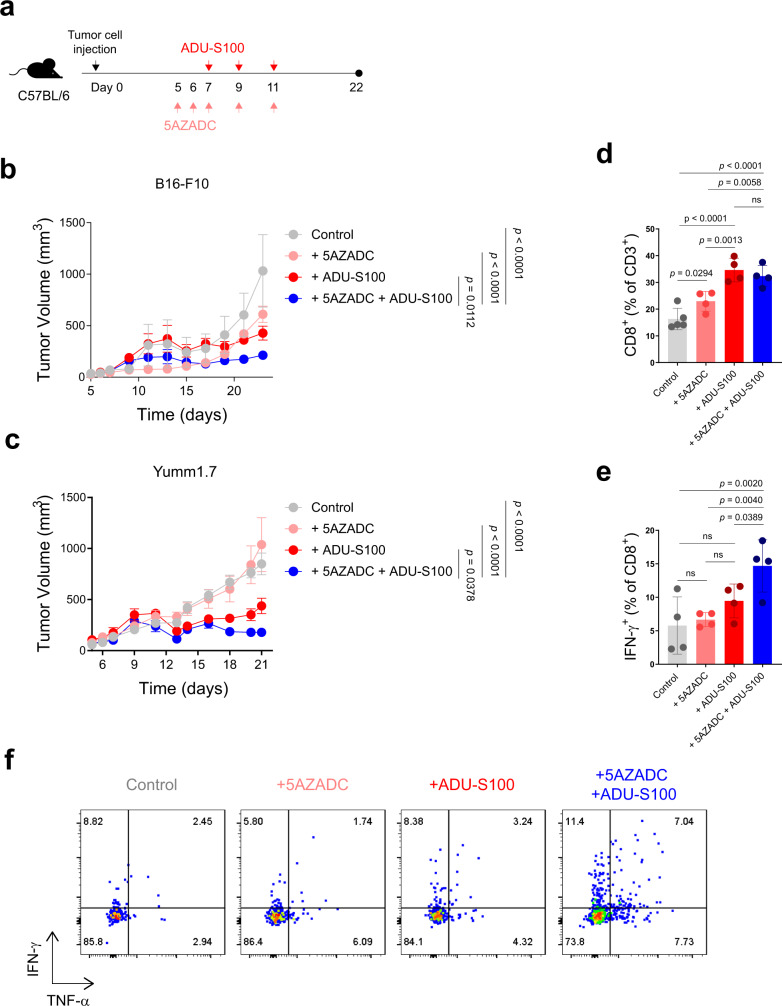
While STING-activating agents have shown limited efficacy in early-phase clinical trials, multiple lines of evidence suggest the importance of tumor cell-intrinsic STING function in mediating antitumor immune responses. Although STING signaling is impaired in human melanoma, its restoration through epigenetic reprogramming can augment its antigenicity and T cell recognition. In this study, we show that reversal of methylation silencing of STING in murine melanoma cell lines using a clinically available DNA methylation inhibitor can improve agonist-induced STING activation and type-I IFN induction, which, in tumor-bearing mice, can induce tumor regression through a CD8+ T cell-dependent immune response. These findings not only provide mechanistic insight into how STING signaling dysfunction in tumor cells can contribute to impaired responses to STING agonist therapy, but also suggest that pharmacological restoration of STING signaling through epigenetic reprogramming might improve the therapeutic efficacy of STING agonists.


Conflict of interest statement

J.J.M. is Associate Center Director at Moffitt Cancer Center, has ownership interest in Aleta Biotherapeutics, CG Oncology, Turnstone Biologics, Ankyra Therapeutics, and AffyImmune Therapeutics, and is a paid consultant/paid advisory board member for ONCoPEP, CG Oncology, Mersana Therapeutics, Turnstone Biologics, Vault Pharma, Ankyra Therapeutics, AffyImmune Therapeutics, UbiVac, Vycellix, and Aleta Biotherapeutics.

Figures

Fig. 1
Fig. 1. Melanoma cell-intrinsic STING activity alone is insufficient for durable tumor control.
Schematic of the STING agonist treatment schedule. Groups of STINGgt/gt mice were injected subcutaneously with 1.5 × 105 B16-ISG or B16-F10 on day 0. On days 5, 8, 10, 12, 14, 16, 18 and 20 following tumor injection, tumor-bearing mice were intratumorally treated with either PBS or 50 μg ADU-S100 (a). Tumor growth curves of B16-ISG (b) and B16-F10 (c) in STINGgt/gt mice treated with PBS control or ADU-S100 as indicated in (a). Data are shown as the mean ± SEM and are representative of two independent experiments. n = 4 and 5 mice in (b) and n = 5 and 6 mice in (c) for ADU-S100 and Control groups, respectively. The frequency of CD8+ cells within the CD45+ population in B16-ISG (d) and B16-F10 (f) tumors treated with PBS control or ADU-S100 (n = 4 mice per group). Data are shown as mean ± SD and are representative of two independent experiments. Statistical significance was determined by a two-sided t test (ns, not significant). Representative flow cytometry plots for d and f are shown in e and g, respectively.
Fig. 2
Fig. 2. Promoter hypermethylation suppresses STING expression in mouse melanoma cell lines.
Schematic of hypermethylation-mediated STING silencing and its reversal through epigenetic reprogramming in STINGlow melanoma cells (a). β-value heat map showing DNA methylation levels across ten STING CpG probes in B16-F10 and Yumm1.7 mouse melanoma cell lines with and without 5AZADC treatment (b). Median β-values of ten STING CpG probes in B16-F10 and Yumm1.7 cells ± 5AZADC. Data are shown as mean ± SD (n = 3 biological replicates) and are representative of two independent experiments (c). Immunoblot analysis of STING expression in B16-F10 and Yumm1.7 cells with or without 5AZADC treatment. α-tubulin was used as a loading control (d). Images are representative of three independent experiments. The ratio of total STING to α-tubulin for each cell line with or without 5AZADC treatment (e). Following 5AZADC treatment, B16-F10, and Yumm1.7 cells were stimulated with the STING agonist ADU-S100 for 24 h. Induction of IFN-β in cell culture supernatants was measured using ELISA and reported as mean ± SD (n = 3 biological replicates) (f). Representative histograms (g) and mean fluorescence intensity (MFI) of MHC I (H2-Kb) expression on indicated cell lines (n = 3 biological replicates). Data are shown as the mean ± SD (h). Data are representative of three independent experiments (fh). Statistical significance was determined by a two-sided t-test (b and c) and one-way ANOVA (fand h) (ns, not significant).
Fig. 3
Fig. 3. DNMT3A and DNMT3B are involved in STING silencing in melanoma.
Quantitative RT-PCR analysis of STING mRNA expression in transfected B16-F10 cells with siRNA specific for DNMT3A (siDNMT3A) or DNMT3B (siDNMT3B) or nontarget siRNA (siControl) (n = 3). Data are shown as mean ± SD and are representative of two independent experiments. Statistical significance was determined using one-way ANOVA (a) (ns, not significant). Immunoblot analysis of STING, DNMT3A, and DNMT3B expression in indicated cells. β-Actin was used as a loading control (b). Levels of CXCL10 (c) and IFN-β (d) in cell culture supernatants measured using ELISA and reported as mean ± SD (n = 3 biological replicates). Data are representative of two independent experiments (c, d). Statistical significance was determined by one-way ANOVA. Immunoblot analysis of STING, DNMT3A and DNMT3B expression in B16-F10 (e) and A375 and SK-MEL-28 human melanoma cell lines (f) with or without 5AZADC treatment. Images in (b) and (ef) are representative of three independent experiments. Correlative analysis of STING mRNA expression with DNMT3A and DNMT3B in metastatic melanoma samples (n = 21) from cBioPortal database using Pearson’s correlation coefficient. P-values shown are two-sided P-values derived from the Pearson correlation test (g).
Fig. 4
Fig. 4. Demethylation improves melanoma response to STING agonist therapy in STINGgt/gt mice.
Schematic of the STING agonist and 5AZADC treatment schedule. Groups of STINGgt/gt mice were injected subcutaneously with 1.5 × 105 B16-F10 or Yumm1.7 or 1 × 105 B16-ISG or B16-ISG-STINGKO cells on day 0 and were intratumorally treated with 50 μg of ADU-S100 and/or 0.1 mg/kg of 5AZADC or PBS (a). Tumor growth curves of B16-F10 (b), Yumm1.7 (c), B16-ISG (d) and B16-ISG-STINGKO (e) in STINGgt/gt mice treated with PBS, 5AZADC, ADU-S100, or 5AZADC + ADU-S100 according to the schedule presented in (a). Data are shown as the mean ± SEM and are representative of two independent experiments (n = 5 mice per group in (b), n = 4, 4, 4, and 5 mice in (c), n = 4, 6, 5, and 7 mice in (d), n = 6, 6, 5, and 6 mice in (e) for Control, 5AZADC, ADU-S100, and 5AZADC + ADU-S100 groups, respectively). Immunoblot analysis of STING, DNMT3A and DNMT3B expression in tumor lesions of STINGgt/gt mice bearing B16-F10 or Yumm1.7 tumors with or without 5AZADC treatment. β-Actin was used as a loading control (f). Images are representative of two independent experiments. Ratio of total STING relative to β-Actin was quantified using ImageJ version 1.53a software (g). Quantitative RT-PCR analysis of Ifnb1 and H2-k1 mRNA expression in B16-F10 tumors in STINGgt/gt mice treated with PBS, 5AZADC, ADU-S100, or 5AZADC + ADU-S100 (n = 3 biological replicates). Data are shown as mean ± SD and are representative of two independent experiments (h). Statistical significance was determined by two-way (be) or one-way ANOVA (h) (ns, not significant).
Fig. 5
Fig. 5. Melanoma response to combination 5AZADC and ADU-S100 therapy depends on CD8+ T cells.
Quantitative RT-PCR analysis of Cxcl10 mRNA expression in B16-F10 tumors in STINGgt/gt mice treated with PBS, 5AZADC, ADU-S100, or 5AZADC + ADU-S100 (n = 3 biological replicates). Data are shown as mean ± SD and are representative of two independent experiments (a). Representative flow cytometry plots showing frequency of CXCR3+ CD8+ T cells in B16-F10 tumors treated with PBS, 5AZADC, ADU-S100, or 5AZADC + ADU-S100. Data are representative of two independent experiments (b). STINGgt/gt mice with B16-F10 tumors were treated with PBS or 5AZADC + ADU-S100 in combination with CD8- or CD4-depleting antibodies (see Methods). Tumor growth is shown (c). Data are shown as mean ± SEM (n = 4 mice for PBS Control, 5AZADC + ADU-S100 + α-CD4 and 5AZADC + ADU-S100 + α-CD8 and n = 5 mice for 5AZADC + ADU-S100 groups). Data are representative of two independent experiments (ac). Statistical significance was determined by one-way (a) or two-way ANOVA (c). (ns, not significant).
Fig. 6
Fig. 6. CD8+ TILs in 5AZADC and ADU-S100 combination therapy-treated mice indicate less exhausted phenotype.
Frequency of CD8+ cells within the CD3+ population (a) and LAG-3+ (b) and PD-1+ (c) cells within the CD3+ CD8+ population in Yumm1.7 tumors in STINGgt/gt mice treated with PBS, 5AZADC, ADU-S100, or 5AZADC + ADU-S100. n = 3, 3, 4, and 4 mice in (a) and n = 3, 3, 4, and 5 mice in (b, c) for Control, 5AZADC, ADU-S100, and 5AZADC + ADU-S100 groups, respectively. Representative flow cytometry plots for a, b, and c are shown in d, e, and f, respectively. MFI (g) and representative histograms (h) of LAG-3+ and PD-1+ cells within the CD3+ CD8+ population in Yumm1.7 tumors in STINGgt/gt mice treated with PBS, 5AZADC, ADU-S100, or 5AZADC + ADU-S100. n = 3, 3, 4, and 4 mice for LAG-3 MFI and n = 3, 3, 4, and 5 mice for PD-1 MFI in (g) for Control, 5AZADC, ADU-S100, and 5AZADC + ADU-S100 groups, respectively. Data are representative of two independent experiments. Data are shown as the mean ± SD. Statistical significance was determined by one-way ANOVA (ns, not significant).
Fig. 7
Fig. 7. Combination therapy induces activation and effector function of splenic CD8+ T cells.
STINGgt/gt mice with Yumm1.7 tumors were treated intratumorally with PBS, 5AZADC, ADU-S100, or 5AZADC + ADU-S100 as indicated in Fig. 4a; spleens were harvested on 21 after tumor cell inoculation and analyzed by flow cytometry. Shown are frequency of splenic CD8+ cells within the CD3+ population (a), frequency of CD69+ CD44+ cells within the CD8+ population (b), representative histograms of CD44+ cells within the CD3+ CD8+ population (c), frequency of central memory (TCM, CD44+ CD62L+) CD8+ T cells (d), representative pie charts indicating relative proportions of defined T cell subsets [Naïve: CD44- CD62L+; Effector: CD44- CD62L-; Effector Memory (EM): CD44+ CD62L-; Central Memory (CM): CD44+ CD62L+] (e), intracellular expression of IFN-γ (f) and TNF-α (g) in CD8+ T cells. Data are representative of two independent experiments. n = 3 mice for PBS Control and 5AZADC, and n = 4 mice for ADU-S100 and 5AZADC + ADU-S100 groups in (ab), (d) and (fg). Data are shown as mean ± SD. Representative flow cytometric plots for a, b, d, and e, f, and g are shown in Supplementary Fig. 6(a), (b), (c), (d), and (e), respectively. Statistical significance was determined by one-way ANOVA (ns, not significant).
Fig. 8
Fig. 8. Demethylation can further improve STING agonist efficacy in C57BL/6 mice with an intact STING pathway.
Schematic of the STING agonist and 5AZADC treatment schedule. Groups of C57BL/6 mice were injected subcutaneously with 1.5 × 105 B16-F10 or Yumm1.7 cells on day 0 and were intratumorally treated with 50 μg of ADU-S100 and/or 0.1 mg/kg of 5AZADC or PBS (a). Tumor growth curves of B16-F10 (b) and Yumm1.7 (c) in C57BL/6 mice intratumorally treated with PBS, 5AZADC, ADU-S100, or 5AZADC + ADU-S100 according to the schedule presented in (a). Data are shown as the mean ± SEM (bc). Control, n = 3; 5AZADC, n = 4; ADU-S100, n = 6; and 5AZADC + ADU-S100, n = 7 mice in (b) and Control, n = 6; 5AZADC, n = 5; ADU-S100, n = 5; and 5AZADC + ADU-S100, n = 5 mice in (c). Frequency of CD8+ T cells (d) and IFN-γ expressing CD8+ T cells (e) in Yumm1.7 tumors in C57BL/6 mice treated with PBS, 5AZADC, ADU-S100, or 5AZADC + ADU-S100 on day 21. n = 5, 4, 4, 4 mice in (d) and n = 4, 4, 4, 4 mice in (e) for Control, 5AZADC, ADU-S100, and 5AZADC + ADU-S100 groups, respectively. Data are shown as mean ± SD. Representative flow cytometry plots of intracellular cytokine staining for IFN-γ and TNF-α in CD8+ T cells in Yumm1.7 tumors in C57BL/6 mice treated with PBS, 5AZADC, ADU-S100, or 5AZADC + ADU-S100 on day 21 (f). Data are representative of two independent experiments. Statistical significance was determined by two-way (bc) or one-way ANOVA (de) (ns, not significant).

References

    1. Pitt JM, et al. Resistance mechanisms to immune-checkpoint blockade in cancer: tumor-intrinsic and-extrinsic factors. Immunity. 2016;44:1255–1269. doi: 10.1016/j.immuni.2016.06.001. - DOI - PubMed
    1. Sharma P, Hu-Lieskovan S, Wargo JA, Ribas A. Primary, adaptive, and acquired resistance to cancer immunotherapy. Cell. 2017;168:707–723. doi: 10.1016/j.cell.2017.01.017. - DOI - PMC - PubMed
    1. Schreiber RD, Old LJ, Smyth MJ. Cancer immunoediting: integrating immunity’s roles in cancer suppression and promotion. Science. 2011;331:1565–1570. doi: 10.1126/science.1203486. - DOI - PubMed
    1. Hodi FS, et al. Improved survival with ipilimumab in patients with metastatic melanoma. N. Engl. J. Med. 2010;363:711–723. doi: 10.1056/NEJMoa1003466. - DOI - PMC - PubMed
    1. Rosenberg SA, et al. Durable complete responses in heavily pretreated patients with metastatic melanoma using T-cell transfer immunotherapycomplete regressions in melanoma. Clin. cancer Res. 2011;17:4550–4557. doi: 10.1158/1078-0432.CCR-11-0116. - DOI - PMC - PubMed

Publication types