. 2023 Mar 22;14(1):1589.
doi: 10.1038/s41467-023-37266-6.

Integrated analysis of genomic and transcriptomic data for the discovery of splice-associated variants in cancer

Affiliations

Integrated analysis of genomic and transcriptomic data for the discovery of splice-associated variants in cancer

Kelsy C Cotto et al. Nat Commun. .

Abstract

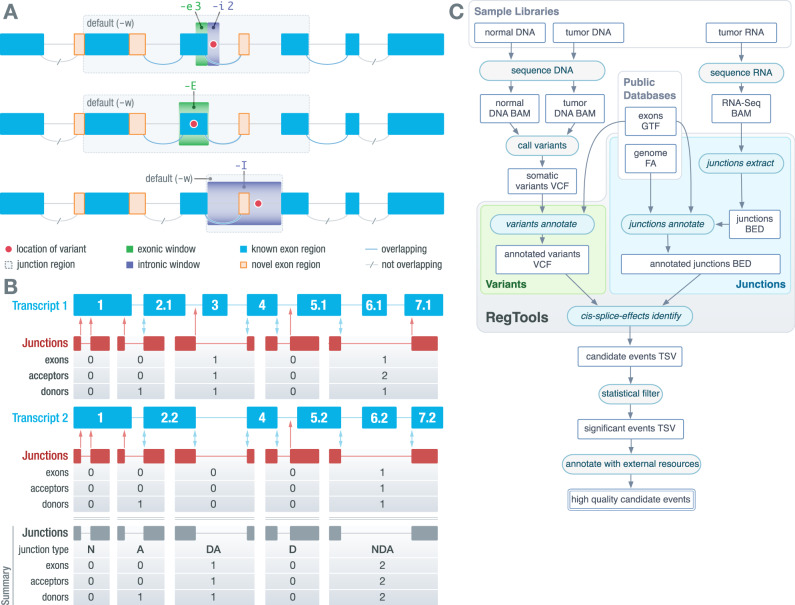
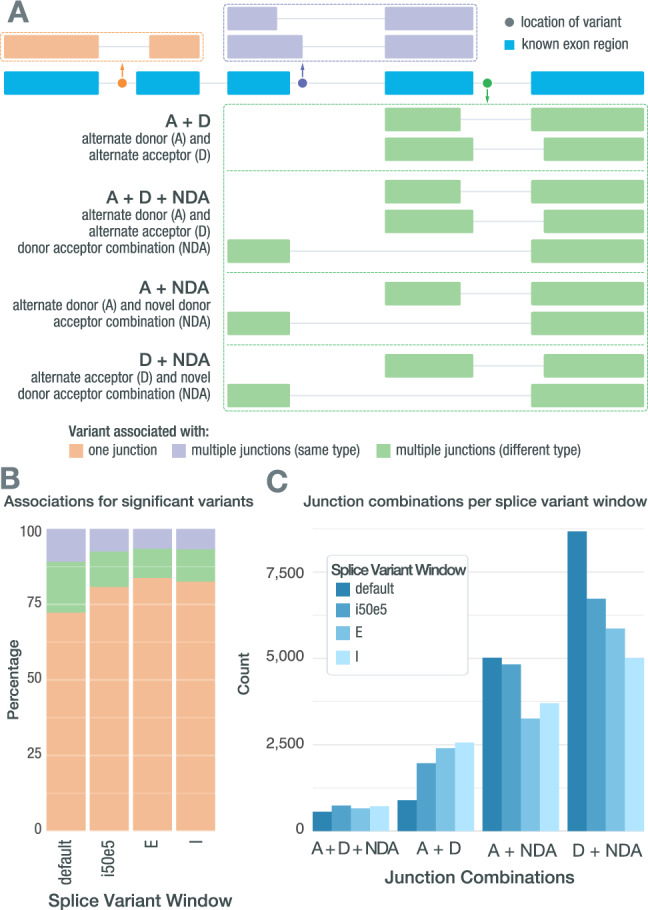
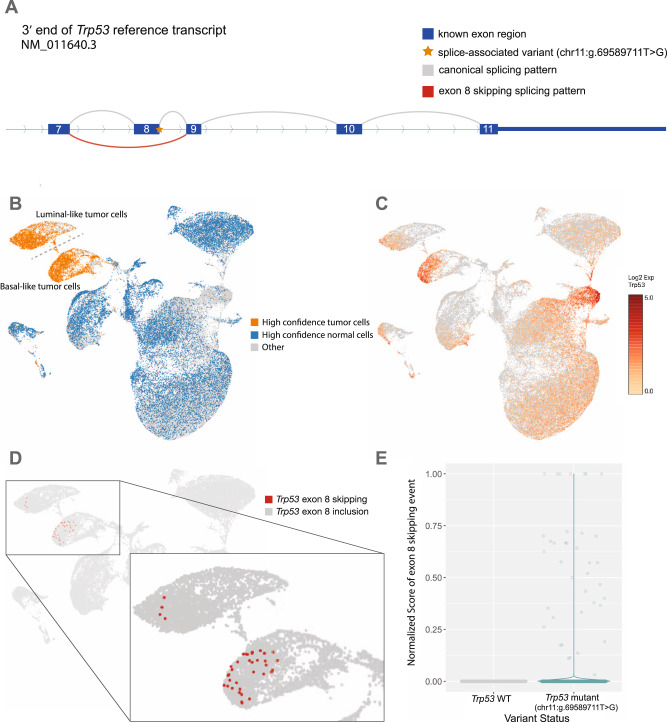
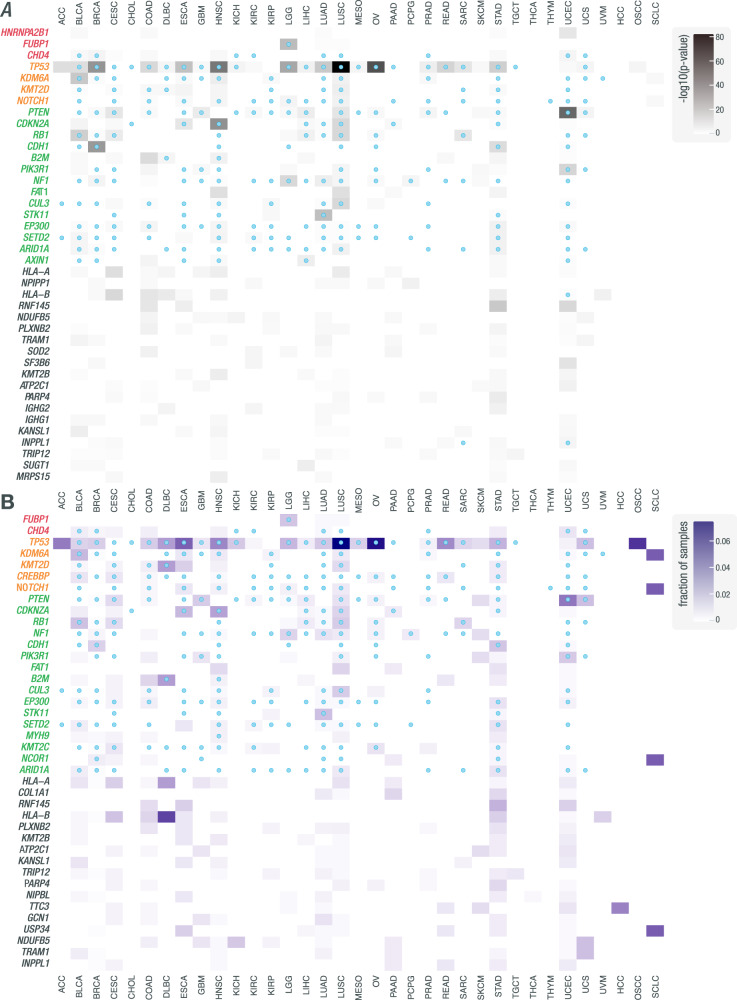
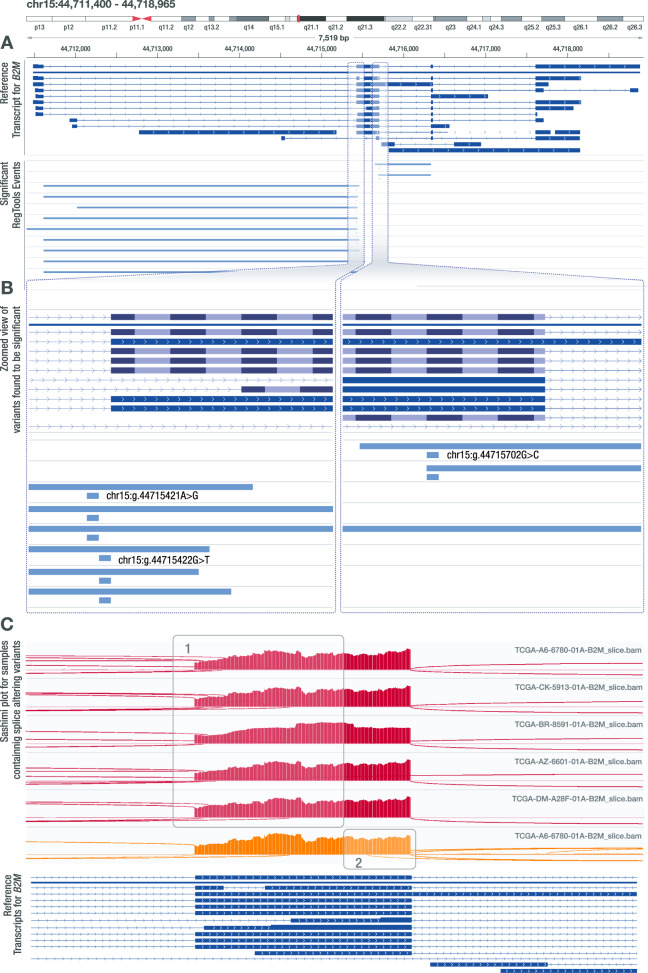
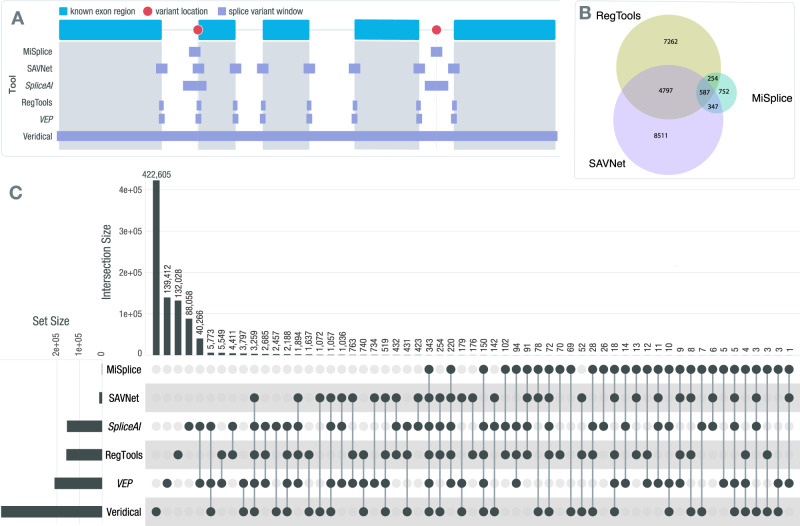
Somatic mutations within non-coding regions and even exons may have unidentified regulatory consequences that are often overlooked in analysis workflows. Here we present RegTools ( www.regtools.org ), a computationally efficient, free, and open-source software package designed to integrate somatic variants from genomic data with splice junctions from bulk or single cell transcriptomic data to identify variants that may cause aberrant splicing. We apply RegTools to over 9000 tumor samples with both tumor DNA and RNA sequence data. RegTools discovers 235,778 events where a splice-associated variant significantly increases the splicing of a particular junction, across 158,200 unique variants and 131,212 unique junctions. To characterize these somatic variants and their associated splice isoforms, we annotate them with the Variant Effect Predictor, SpliceAI, and Genotype-Tissue Expression junction counts and compare our results to other tools that integrate genomic and transcriptomic data. While many events are corroborated by the aforementioned tools, the flexibility of RegTools also allows us to identify splice-associated variants in known cancer drivers, such as TP53, CDKN2A, and B2M, and other genes.


Conflict of interest statement

W.C.C serves on the advisory board for Novartis Pharmaceutical and reports intellectual property with Pathfinder Therapeutics. R.U. reports grants and personal fees from Merck Inc. R.G. served as consultant for Horizon Pharmaceuticals and GenePlus. The remaining authors declare no competing interests.

Figures

Fig. 1
Fig. 1. RegTools features individual modules and an integrated pipeline for flexible, streamlined discovery of cis-acting splice-associated variants.
A A schematic depicting how variants (red dots) are associated to exon-exon junctions (curves). By default, variants annotate marks variants within 3 bp on the exonic side (green box) and 2 bp on the intronic side (purple box) of an exon edge as potentially splice-associated. Within cis-splice-effects identify, a “splice junction region” is determined by finding the largest span of sequence space between exons that flank the exon associated with the splicing-relevant variant. Junctions overlapping the splice junction region are associated with the variant. Using the “-E” or “-I” option considers either all exonic variants or all intronic variants, respectively, as potentially splice-associated. B A schematic depicting how RegTools annotates exon-exon junctions with respect to known transcripts. Cis-splice-effects identify and the underlying junctions annotate command annotate junctions based on whether the donor and acceptor site combination is found in the reference transcriptome GTF. In this example, there are two known transcripts (shown in blue) that overlap a set of junctions observed in RNAseq data (depicted as junction supporting reads in red). RegTools checks to see if the observed donor and acceptor splice sites are found in any of the reference exons and counts the number of exons, acceptors, and donors skipped by a particular junction. Double blue arrows represent matches between observed and reference donor/acceptor sites, while single red arrows show non-reference splice sites. Junctions with a known donor but unknown acceptor or vice-versa are annotated as “D” or “A”, respectively. If both sites are known but do not appear in combination in any transcripts, the junction is annotated as “NDA”, whereas if both sites are unknown, the junction is annotated as “N”. If the junction is known to the reference GTF, it is marked as “DA”. C A schematic depicting the overall RegTools analysis workflow. The cis-splice-effects identify command relies on the variants annotate, junctions extract, and junctions annotate submodules. This pipeline takes variant calls and RNA-seq alignments along with genome and transcriptome references and outputs information about events (pairs of variants and associated junctions). Source data are provided as a Source Data file. ‘BAM’ refers to a binary alignment map file. ‘GTF’ refers to the gene transfer format. ‘VCF’ refers to the variant call format. ‘FA’ refers to fasta format. ‘BED’ refers to browser extensible data. ‘TSV’ refers to tab separated value format.
Fig. 2
Fig. 2. Splice-associated variants may result in multiple non-reference junctions.
A A single splice-associated variant can result in a single non-reference junction, multiple non-reference junctions of the same junction type, or multiple non-reference junctions of different junction types. Depicted is a variant (colored dots) resulting in a single non-reference junction (orange), a variant resulting in two non-reference junctions that both use alternate donor sites (purple), and a variant resulting in multiple junctions of different types (green). B Stacked bars showing how often significant splice-associated variants are associated with only one junction (orange), multiple junctions of the same type (purple), or multiple junctions of different types (green). C Bar chart showing how often each junction combination occurs when a single splice-associated variant results in multiple junctions of different types in each of the RegTools splice variant windows used. Source data are provided as a Source Data file. ‘A’ refers to a junction that matches a known splice acceptor site but has an unknown donor site. ‘D’ refers to a junction that matches a known donor but an unknown acceptor. ‘NDA’ refers to an unknown connection of known donors and acceptor sites. ‘E’ refers to exonic. ‘I’ refers to intronic.
Fig. 3
Fig. 3. Intronic SNV in Trp53 associated with exon 8 skipping.
A Schematic of a single nucleotide splice donor variant (yellow star; mm10, chr11:g.69589711T>G; c.1067+2 position of intron 8 of transcript NM_011640.3) within intron 8 of Trp53 (depicted as a series of boxes representing exons 7–11 with curved lines representing RNA splicing events). The variant appears to cause skipping of an exon (red curve). This result was found using the default splice variant window parameter (i2e3). B UMAP projection of single cells from MCB6C organoid-derived tumors with high confidence tumor cells (orange) and high confidence normal cells (blue) highlighted. C UMAP projection of single cells from MCB6C organoid-derived tumors overlaid with log2 expression values for Trp53. D Zoomed view of the UMAP projection showing cells containing the Trp53 exon skipping event (red dots). E Violin plots comparing the normalized junction score of the non-reference exon skipping event in cells with and without the Trp53 variant. Source data are provided as a Source Data file.
Fig. 4
Fig. 4. Pan-cancer analysis of cohorts from TCGA and MGI reveals genes recurrently disrupted by variants that are associated with non-canonical splicing patterns.
Heatmaps showing how often genes are disrupted by variants associated with non-canonical splicing patterns across samples in a given cohort. A Rows correspond to the 40 most frequently recurring genes, as ranked by binomial p-value across cohorts (see Methods, “Identification of genes with recurrent splice-associated variants”). Genes are clustered by whether they were annotated by the CGC as an oncogene (red), an oncogene and tumor suppressor gene (yellow), or a tumor suppressor gene (green). Shading corresponds to −log10(p-value) and columns represent cohorts. Blue marks within cells indicate that the gene was annotated by CHASMplus as a driver within a given TCGA cohort. B Rows correspond to the 40 most frequently recurring genes, as ranked by the fraction of samples across cohorts. Shading corresponds to the fraction of samples and columns represent cohorts. Blue dots within cells indicate that the gene was annotated by CHASMplus as a driver within a given TCGA cohort. These results were obtained using the default splice variant window parameter (i2e3). Source data are provided as a Source Data file.
Fig. 5
Fig. 5. Several SNVs in B2M are associated with alternate acceptor and alternate donor usage.
A IGV snapshot of three intronic variant positions (GRCh38—chr15:g.44715421A>G, chr15:g.44715422G>T, chr15:g.44715702G>C) found to be associated with alternate acceptor and donor usage that leads to the formation of unknown transcript products. This result was found using the default splice variant window parameter (i2e3). B Zoomed in view of the variants identified by RegTools that are associated with alternate acceptor and donor usage. Two of these variant positions flank the acceptor site and one variant flanks the donor site of the area that is being affected. C Sashimi plot visualizations for samples containing the identified variants that show (1) alternate acceptor usage (red) or (2) alternate donor usage (orange).
Fig. 6
Fig. 6. Comparison of RegTools with other tools for identifying cis-acting splice-associated variants.
A Conceptual diagram of contrasting approaches employed by various tools for identifying cis-acting splice-associated variants (red dots). For this example, the splice variant window (purple boxes) for RegTools is its default splice variant window employed for our main analyses. An italicized tool name indicates that the tool only considers genomic data for making its calls, instead of a combination of genomic and transcriptomic data. B Venn diagram comparing the splice-associated variants identified by RegTools, using its default splice window parameter, MiSplice, and SAVNet. C UpSet plot comparing splice-associated variants identified by RegTools using both the -E and -I splice variant window parameters to those identified by other splice variant predictors and annotators using their default settings. Each tool’s total number of variant predictions is shown on the left sidebar graph. The number of variants specific to each tool or shared between different combinations of tools is indicated by the bar graph along the top, with the individual or connected dots indicating the tools. Source data are provided as a Source Data file. ‘VEP’ refers to the Variant Effect Predictor.

References

    1. Chabot B, Shkreta L. Defective control of pre-messenger RNA splicing in human disease. J. Cell Biol. 2016;212:13–27. doi: 10.1083/jcb.201510032. - DOI - PMC - PubMed
    1. Vogelstein B, et al. Cancer genome landscapes. Science. 2013;339:1546–1558. doi: 10.1126/science.1235122. - DOI - PMC - PubMed
    1. Soemedi R, et al. Pathogenic variants that alter protein code often disrupt splicing. Nat. Genet. 2017;49:848–855. doi: 10.1038/ng.3837. - DOI - PMC - PubMed
    1. Supek F, Miñana B, Valcárcel J, Gabaldón T, Lehner B. Synonymous mutations frequently act as driver mutations in human cancers. Cell. 2014;156:1324–1335. doi: 10.1016/j.cell.2014.01.051. - DOI - PubMed
    1. Jung H, et al. Intron retention is a widespread mechanism of tumor-suppressor inactivation. Nat. Genet. 2015;47:1242–1248. doi: 10.1038/ng.3414. - DOI - PubMed

Publication types