. 2023 Mar 22;14(1):1598.
doi: 10.1038/s41467-023-37347-6.

A DNA tumor virus globally reprograms host 3D genome architecture to achieve immortal growth

Affiliations

A DNA tumor virus globally reprograms host 3D genome architecture to achieve immortal growth

Chong Wang et al. Nat Commun. .

Abstract

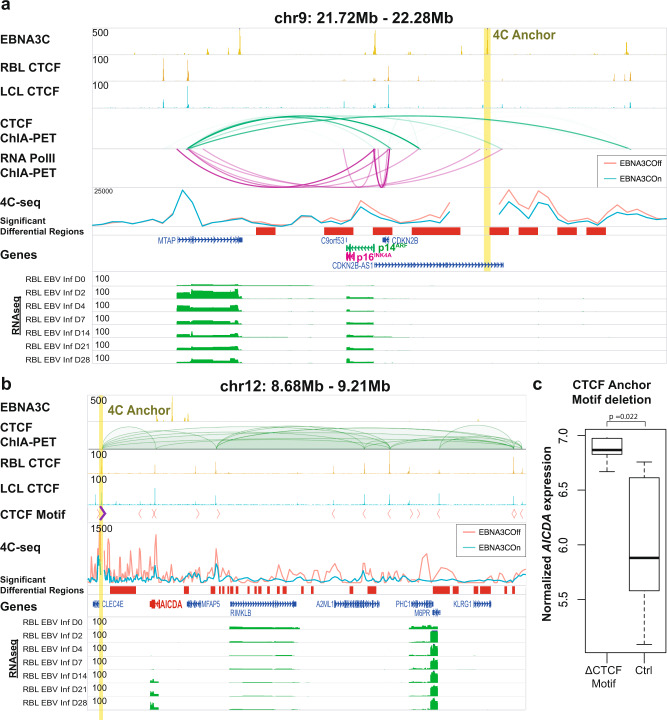
Epstein-Barr virus (EBV) immortalization of resting B lymphocytes (RBLs) to lymphoblastoid cell lines (LCLs) models human DNA tumor virus oncogenesis. RBL and LCL chromatin interaction maps are compared to identify the spatial and temporal genome architectural changes during EBV B cell transformation. EBV induces global genome reorganization where contact domains frequently merge or subdivide during transformation. Repressed B compartments in RBLs frequently switch to active A compartments in LCLs. LCLs gain 40% new contact domain boundaries. Newly gained LCL boundaries have strong CTCF binding at their borders while in RBLs, the same sites have much less CTCF binding. Some LCL CTCF sites also have EBV nuclear antigen (EBNA) leader protein EBNALP binding. LCLs have more local interactions than RBLs at LCL dependency factors and super-enhancer targets. RNA Pol II HiChIP and FISH of RBL and LCL further validate the Hi-C results. EBNA3A inactivation globally alters LCL genome interactions. EBNA3A inactivation reduces CTCF and RAD21 DNA binding. EBNA3C inactivation rewires the looping at the CDKN2A/B and AICDA loci. Disruption of a CTCF site at AICDA locus increases AICDA expression. These data suggest that EBV controls lymphocyte growth by globally reorganizing host genome architecture to facilitate the expression of key oncogenes.


Conflict of interest statement

The authors declare no competing interests.

Figures

Fig. 1
Fig. 1. RBL and LCL Hi-C interaction maps.
Hi-C correlation maps of resting B lymphocytes (RBL, orange triangle) compared to LCLs (LCL, teal triangle). Pearson correlation (red as high; blue as low) based on normalized interaction frequencies at 500 kb resolution are on the left. Eigenvector values for calling A (red) and B compartments (blue) are shown on top, while the ChIP-seq tracks of histone modifications, CTCF, and RNA-seq in RBLs and LCLs are shown at the bottom for the regions outlined in yellow. a Chromosome 3, 120 Mb to 144 Mb. b Chromosome 17, 33.5 Mb to 49 Mb. Benjamini-Hochberg adjusted p-values are 9.3e-57 and 1.5e-22 for the highlighted chr3 and chr17 regions, respectively, based on differential compartment analysis of 100 kb genomic regions using tool dcHiC. c. Frequency of eigenvector differences for 100 kb genomic bins that have difference signs of eigenvector values between RBL and LCL (left). Frequency of eigenvector differences for all genome-wide 100 kb bins (right). Here, positive difference/change indicates increased eigenvector by EBV infection while negative difference represents decreasing. Numbers in the figure legends indicate the total number of 100 kb bins in the displayed group. d 3D genome structure inference of RBL and LCL.
Fig. 2
Fig. 2. Global changes in contact domain boundaries in RBLs and LCLs.
a Venn diagram representing the contact domain boundaries from Hi-C in RBLs and LCLs. b ChIP-seq signals for CTCF in LCLs and RBLs, EBNALP and EBNA3A were plotted along the edges of LCL unique boundaries (centered on CTCF, +/− 2 kb). Left and right indicate the relative edge positions of the contact domain boundaries. c. ChIP-seq signals for CTCF in RBLs and LCLs plotted along the edges of RBL unique boundaries (centered on CTCF, +/−2kb). d Representative contact domain changes due to EBV transformation at chromosome 2, 153 Mb – 159 Mb. Top: ChIP-seq tracks and contact frequencies of interactions in LCLs. Bottom: ChIP-seq tracks and contact frequencies of interactions in RBLs. Highlighted in red squares are CTCF profiles that changed at contact domain boundaries between the two conditions. Heatmaps are colored based on normalized interaction frequencies at 25 kb resolution shown at the bottom. e Cumulative distal to local interaction (DLR) values at 25 kb resolution near TSSs of genes that are essential for LCL growth and survival (solid lines) and all annotated genes (dotted lines) in both RBLs (orange) and LCLs (teal).
Fig. 3
Fig. 3. Global changes in contact domain at ESEs and their target genes.
a Normalized Hi-C contact frequencies for RBLs (orange triangle) and LCLs (teal triangle) at 2 representative loci are shown on top. Left: Chromosome 1, 116 Mb to 118 Mb. Right: Chromosome 10, 124.5 Mb to 125.5 Mb. Visible changes in LCL domains are traced out in black, and RNA-seq tracks for RBL after EBV infection are shown at the bottom. Heatmaps are colored based on normalized interaction frequencies at 10 kb resolution. b Cumulative DLR values at 25 kb resolution near TSSs of genes regulated by EBV Super Enhancers (ESEs, solid lines) and all annotated genes (dotted lines) in both RBLs (orange) and LCLs (teal).
Fig. 4
Fig. 4. ESEs and their direct target interactions in RBL to LCL time course.
a RBLs (day 0) were transformed into LCLs (day 28) in a time course experiment in replicates. ESE linkages to their direct genes were evaluated by POLR2A HiChIP. Each magenta line represents a genomic interaction. HiChIP links with filter threshold >2 are shown. HiChIP loops in RBLs and LCLs at a. ATP1A1 and CD58, b BUB3. RBL and LCL H3K27ac, CTCF and LCL RAD21, SMC3 ChIP-seq tracks are also shown on the top. c RBLs and LCLs 28 days post infection were fixed and hybridized with labeled BACmids. The nuclei were stained with DAPI. The BAC probes used are indicated in panel b. More than 50 nuclei were scored for each cell type and tabulated on the right. Pearson’s Chi-square test P < 3.69-e-9. Source data are provided as a supplementary Source Data file.
Fig. 5
Fig. 5. EBNA3A induced global changes in chromatin interactions.
a H3K27ac HiChIP experiments were used to identify chromatin loops in EBNA3A conditional LCLs grown under permissive (EBNA3A On) or non-permissive (EBNA3A Off) conditions. EBNA3A inactivation (EBNA3A Off) resulted in a marked decrease in the number of loops formed, decrease in enhancer-promoter loops as well as increases in CTCF loops and other unannotated loops. All HiChIP loops have FDR < 0.01 and p-value <0.05 for differential enrichment between EBNA3A On and Off conditions. b-left Representative genomic tracks on chromosome 4, around the RBPJ gene locus. EBNA3A inactivation resulted in decreased chromatin loops around RBPJ, particularly at sites with EBNA3A and chromatin looping factors (CTCF, SMC3, and Rad21) present. RNA-seq tracks tracing gene expression throughout the EBV infection of B cells show an increase in RBPJ transcripts. HiChIP links with filter threshold >3 are shown. Black arrows indicate different CTCF binding pattern in RBLs and LCLs. b-right Representative genomic tracks on chromosome 12, around CCND2. EBNA3A inactivation resulted in decreased chromatin loops throughout the locus. HiChIP links with filter threshold >3 are shown. EBV infection of B cells induced increase in gene transcription is shown at the bottom. c CTCF and H3K27ac Cut & Run and RAD21 ChIP-seq signals at the genomic loci that lost looping upon EBNA3A inactivation. Boxplot plots: center value is the medium; upper and lower bounds of boxes are upper and lower quartile, respectively; whiskers extend by 1.5*(upper quartile - lower quartile). P values were calculated using the Wilcoxon rank sum test.
Fig. 6
Fig. 6. EBNA3A inactivation reduces ESEs loopings.
a Inactivation of EBNA3A resulted in significantly less interactions between ESEs at chromosome 10 (BUB3, left) and chromosome 1 (ATP1A1 and CD58, right) and their direct target genes. HiChIP links with filter threshold >3 are shown. Black arrows indicate different CTCF binding pattern in RBLs and LCLs. b Cis-chromosomal loops were visualized using Circos plots, originating from two ESEs. The cis-chromosomal loops in EBNA3A On (left) are decreased upon EBNA3A inactivation (right).
Fig. 7
Fig. 7. EBNA3C alters loopings at CDKN2A/B and AICDA.
a Chromatin interactions at the CDKN2A/B locus is shown, with the 4C-seq anchor shown at a distal EBNA3C peak residing upstream of the p14ARF and p16INK4A promoters. Significant differential regions (p < 0.05) are shown in red bars, which overlap with a number of regions previously identified by CTCF and POL2RA ChIA-PET. EBNA3C inactivation (EBNA3C Off) resulted in increased chromatin interactions of regions upstream of p14ARF and p16INK4A with its promoters, indicating putative regulatory regions that are suppressed by EBNA3C to downregulate p14ARF and p16INK4A. b Chromatin interactions at the AICDA locus is shown, with the 4C-seq anchor at a key CTCF site involved in multiple interactions at this locus. Significant differential regions (p < 0.05) are shown in red bars, which overlap with the majority of CTCF peaks and motifs indicated. The directionality of CTCF motifs are also indicated. The presence of EBNA3C (EBNA3C On, teal) resulted in a significant suppression of local CTCF interactions, which is marked by an increase in AICDA and M6PR expression. c The key CTCF motif, marked in purple in b, was deleted via CRISPR-Cas9. Single cell clones of LCLs harboring these deletions were grown out and verified for successful or unsuccessful motif deletion. The gene expression after successful CTCF motif deletion was significantly higher than wildtype, implicating the role of CTCF interactions, when disrupted by EBNA3C, in upregulating AICDA expression. Boxplot plots: center value is the medium; upper and lower bounds of boxes are upper and lower quartile, respectively; whiskers extend by 1.5*(upper quartile - lower quartile). Wilcoxon test, two sided, p = 0.022. Source data are provided as a supplementary Source Data file.

References

    1. Howley PM. Gordon Wilson Lecture: Infectious disease causes of cancer: opportunities for prevention and treatment. Trans. Am. Clin. Climatol. Assoc. 2015;126:117–132. - PMC - PubMed
    1. Krump NA, You J. Molecular mechanisms of viral oncogenesis in humans. Nat. Rev. Microbiol. 2018;16:684–698. doi: 10.1038/s41579-018-0064-6. - DOI - PMC - PubMed
    1. Epstein MA, Achong BG, Barr YM. Virus Particles in Cultured Lymphoblasts from Burkitt’s Lymphoma. Lancet. 1964;1:702–703. doi: 10.1016/S0140-6736(64)91524-7. - DOI - PubMed
    1. Cohen JI, Fauci AS, Varmus H, Nabel GJ. Epstein-Barr virus: an important vaccine target for cancer prevention. Sci. Transl. Med. 2011;3:107fs107. doi: 10.1126/scitranslmed.3002878. - DOI - PMC - PubMed
    1. Longnecker R KE, Cohen JI. Epstein-Barr Virus, 8th edn. Lippincott Williams & Wilkins, a Wolters Kluwer Business. (2013).

Publication types

MeSH terms

Substances