. 2023 Mar 22;14(1):1572.
doi: 10.1038/s41467-023-37224-2.

Interoperable slide microscopy viewer and annotation tool for imaging data science and computational pathology

Affiliations

Interoperable slide microscopy viewer and annotation tool for imaging data science and computational pathology

Chris Gorman et al. Nat Commun. .

Abstract

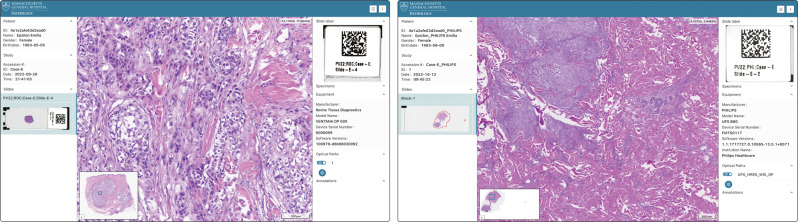
The exchange of large and complex slide microscopy imaging data in biomedical research and pathology practice is impeded by a lack of data standardization and interoperability, which is detrimental to the reproducibility of scientific findings and clinical integration of technological innovations. We introduce Slim, an open-source, web-based slide microscopy viewer that implements the internationally accepted Digital Imaging and Communications in Medicine (DICOM) standard to achieve interoperability with a multitude of existing medical imaging systems. We showcase the capabilities of Slim as the slide microscopy viewer of the NCI Imaging Data Commons and demonstrate how the viewer enables interactive visualization of traditional brightfield microscopy and highly-multiplexed immunofluorescence microscopy images from The Cancer Genome Atlas and Human Tissue Atlas Network, respectively, using standard DICOMweb services. We further show how Slim enables the collection of standardized image annotations for the development or validation of machine learning models and the visual interpretation of model inference results in the form of segmentation masks, spatial heat maps, or image-derived measurements.


Conflict of interest statement

All Authors declare the following competing interests: All Authors received funding from the National Institutes of Health for the research. David A. Clunie receives financial compensation as a consultant of Healthcare Tech Solutions (HCTS), as a consultant for Impact Business Information Solutions (IBIS), as a consultant for Mayo Foundation for Medical Education & Research, as a consultant for Essex Leidos CBIIT under under National Cancer Institute Contract No. 75N91019D00024, Task Order 75N91019F00129, as a consultant for Brigham and Women’s Hospital NCI Imaging Data Commons (IDC), as a consultant for the University of Leeds Northern Pathology Imaging Co-operative (NPIC), and as a contractor for NEMA as DICOM Editor.

Figures

Fig. 1
Fig. 1. Components of the Slim web application and communication of data using DICOMweb services.
Component diagram showing relevant client and server components and their interfaces. Slim is a single-page application that runs fully client side in a web browser without any custom server side components. All data communication occurs via standard DICOMweb services. The application exposes a graphical user interface for interactive visualization and annotation of image pixel data and internally uses the DICOM Microscopy Viewer and DICOMweb Client libraries for decoding, transforming, and rendering data and for querying, retrieving, and storing data via a DICOMweb interface, respectively.
Fig. 2
Fig. 2. Use of Slim as slide microcopy viewer of the NCI Imaging Data Commons.
Screenshots of the NCI Imaging Data Commons data portal (top) and of the Slim viewer (bottom). Shown are a true color image of a hematoxylin and eosin stained lung squamous cell carcinoma specimen from the Clinical Proteomic Tumor Analysis Consortium (CPTAC) that was acquired via brightfield slide microscopy (left) and a pseudocolor image derived from multiple grayscale images of an immunostained colon carcinoma specimen from the Human Tumor Atlas Network (HTAN) that was acquired via fluorescence slide microscopy (right).
Fig. 3
Fig. 3. Display of color images acquired via brightfield slide microscopy.
Screenshot of the Slim user interface displaying a color image of a hematoxylin and eosin stained specimen from the Clinical Proteomic Tumor Analysis Consortium (CPTAC) project that was acquired via brightfield whole slide imaging (left). The viewer applies a sequence of pixel transformations to each retrieved image frame to convert color images from the input device color space into the display device color space (right). Note the subtle but perceptible difference in color of the stored and displayed image frames.
Fig. 4
Fig. 4. Display of grayscale images acquired via fluorescence slide microscopy.
Screenshot of the Slim user interface displaying multiple grayscale images of an immunostained colon adenocarcinoma specimen from the Human Tumor Atlas Network (HTAN) that were acquired via cyclic immunofluorescence imaging, where the user manually selected individual image channels for display and adjusted the display settings for each channel (left). The viewer constructed value of interest and palette color lookup tables from the user-provided display settings to contrast enhance and colorize selected grayscale images, respectively, and additively blended the resulting pseudocolor images (right).
Fig. 5
Fig. 5. Automatic setting of display parameters using presentation states.
Screenshot of the Slim user interface displaying the same grayscale images as shown in Fig. 4, but where the user chose a presentation state, which automatically selected a set of image channels and adjusted the display settings for each channel (upper left). The viewer constructed value of interest and palette color lookup tables from the provided display settings to contrast enhance and colorize referenced grayscale images, respectively, and additively blended the resulting pseudocolor images (upper right). The reference of selected images, the description of the value of interest (VOI) lookup table (LUT), and the description of the palette color lookup table are encoded in a DICOM Advanced Blending Presentation State instance (bottom). In this case, the VOI LUT represents a linear function that maps 16-bit grayscale values into a window of 8-bit grayscale values and the palette color LUT represents three linear functions that each map grayscale values into 8-bit RGB color values. The VOI window is described by the window center and window width and the palette color ranges for the red, green, and blue channels are described separately via two segments that define the first and last color value. The LUT data are encoded in the DICOM object in binary form, but are shown here as text for the purpose of illustration.
Fig. 6
Fig. 6. Annotation of image regions of interest.
a Annotation of image regions of interest (ROIs) using DICOM Structured Reporting. b Screenshot of the Slim user interface displaying a ROI annotation drawn by a user on images of the Clinical Proteomic Tumor Analysis Consortium (CPTAC) project. Note the user-provided qualitative evaluations and machine-generated size measurements of the ROI that are displayed in the side panel. c Screenshot of the Slim user interface displaying a popup window that appears when the user starts to draw regions of interests (ROIs) and that prompts the user to answer questions about the annotated ROIs. The annotation task here is the classification of image regions into different tumor categories, and the user is asked to specify the associated morphology and topography. Note the drop-down menu provides options from which the user can choose an answer without having to enter free text. d Section of the JavaScript configuration file that shows the underlying codes that determine both the questions that are posed to users and the list of permitted answers from which users can choose the appropriate one.
Fig. 7
Fig. 7. Display of image segmentation and object detection results.
Schematic representation of image segmentation or object detection results as raster or vector graphics, respectively, together with semantic metadata (top) and screenshots of the Slim user interface displaying the data (bottom). Shown are the binary segmentation mask (left) as well as the centroids of detected objects (right), which were derived from slide microscopy images from The Cancer Genome Atlas (TCGA) project. The raster graphic data are represented as a two-dimensional pixel matrix and vector graphic data are represented as spatial coordinates in the three-dimensional slide coordinate system in millimeter units. The slide coordinate system serves as a frame of reference and graphic data may need to be transformed and spatially aligned for overlay onto the source images. The affine transformation is parametrized using appropriate DICOM metadata.
Fig. 8
Fig. 8. Display of saliency, class activation, or attention maps.
Screenshot of the Slim user interface displaying an attention map image overlaid on the source slide microscopy images from Clinical Proteomic Tumor Analysis Consortium (CPTAC) project (upper left). The attention map was derived from the slide microscopy image using an attention-based image classification model. Note that the pixel data of the parametric map are colorized by the viewer using the palette color lookup table that was embedded into the image object by the model developer.
Fig. 9
Fig. 9. Successful demonstration of interoperability with DICOM conformant scanners and archives from different manufacturers at a DICOM Connectathon.
Screenshots of the Slim user interface displaying slide microscopy images that were acquired and stored by commercially available devices during a DICOM Connectathon at the Path Visions 2022 conference. Shown are images acquired by the Roche Tissue Diagnostics VENTANA DP 600 scanner and stored in the J4Care SMooTH Archive (left) as well as images acquired by the Philips Healthcare UFS B60 scanner and stored in the Sectra Medical VNA (right).

References

    1. Rozenblatt-Rosen O, et al. The human tumor atlas network: Charting tumor transitions across space and time at single-cell resolution. Cell. 2020;181:236. doi: 10.1016/j.cell.2020.03.053. - DOI - PMC - PubMed
    1. He J, et al. The practical implementation of artificial intelligence technologies in medicine. Nat. Med. 2019;25:30. doi: 10.1038/s41591-018-0307-0. - DOI - PMC - PubMed
    1. Bera K, et al. Artificial intelligence in digital pathology - new tools for diagnosis and precision oncology. Nat. Rev. Clin. Oncol. 2019;16:703. doi: 10.1038/s41571-019-0252-y. - DOI - PMC - PubMed
    1. Niazi MKK, Parwani AV, Gurcan MN. Digital pathology and artificial intelligence. Lancet Oncol. 2019;20:253. doi: 10.1016/S1470-2045(19)30154-8. - DOI - PMC - PubMed
    1. Marqués G, Pengo T, Sanders MA. Imaging methods are vastly underreported in biomedical research. Elife. 2020;9:e55133. doi: 10.7554/eLife.55133. - DOI - PMC - PubMed

Publication types