. 2023 Mar 22;14(1):1595.
doi: 10.1038/s41467-023-37291-5.

A defect in mitochondrial protein translation influences mitonuclear communication in the heart

Affiliations

A defect in mitochondrial protein translation influences mitonuclear communication in the heart

Feng Gao et al. Nat Commun. .

Abstract

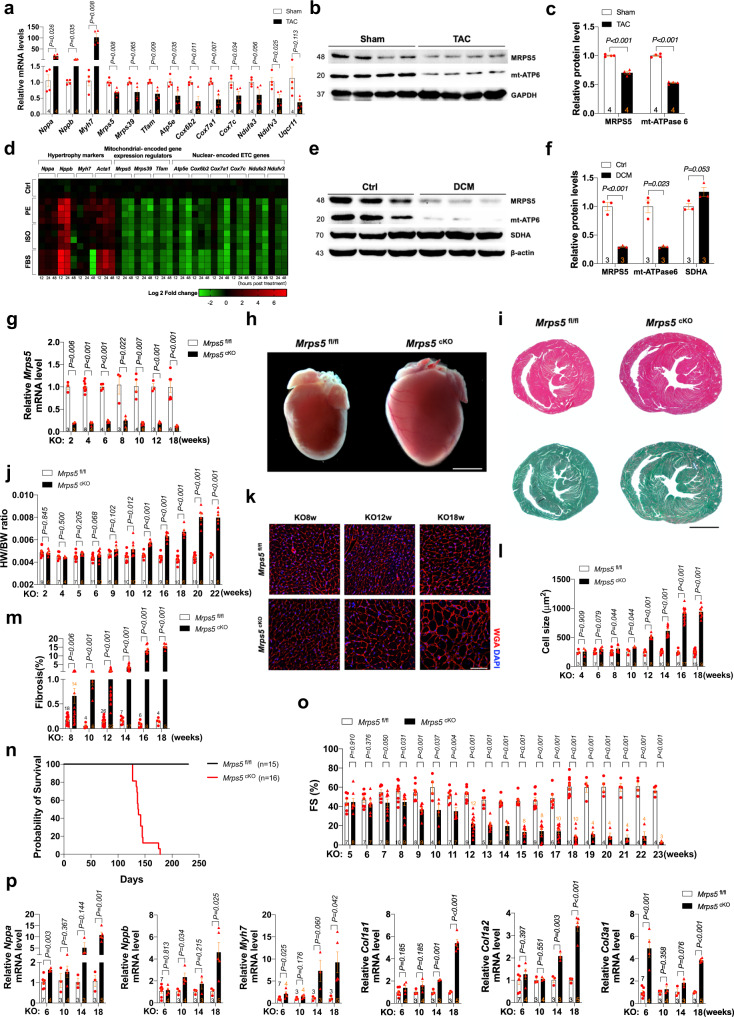
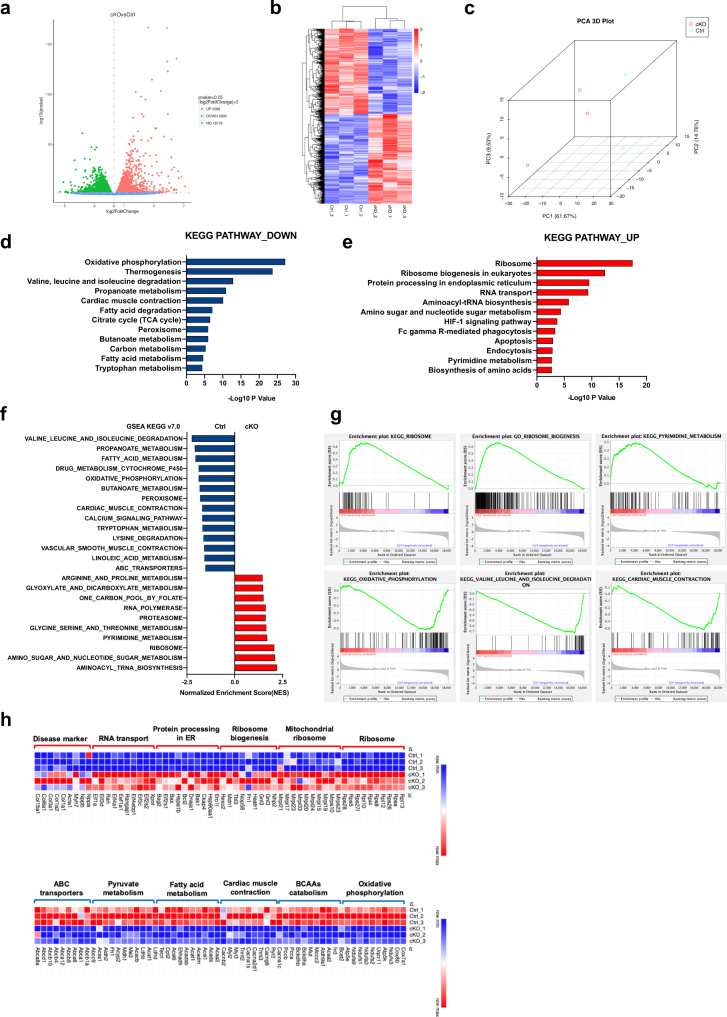
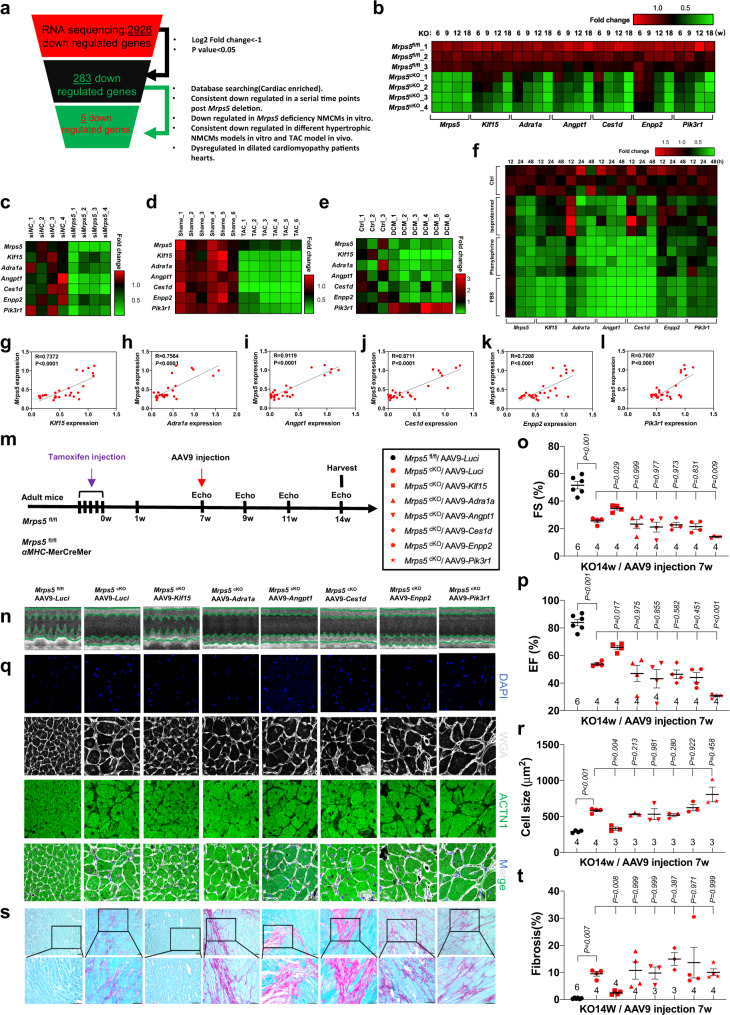
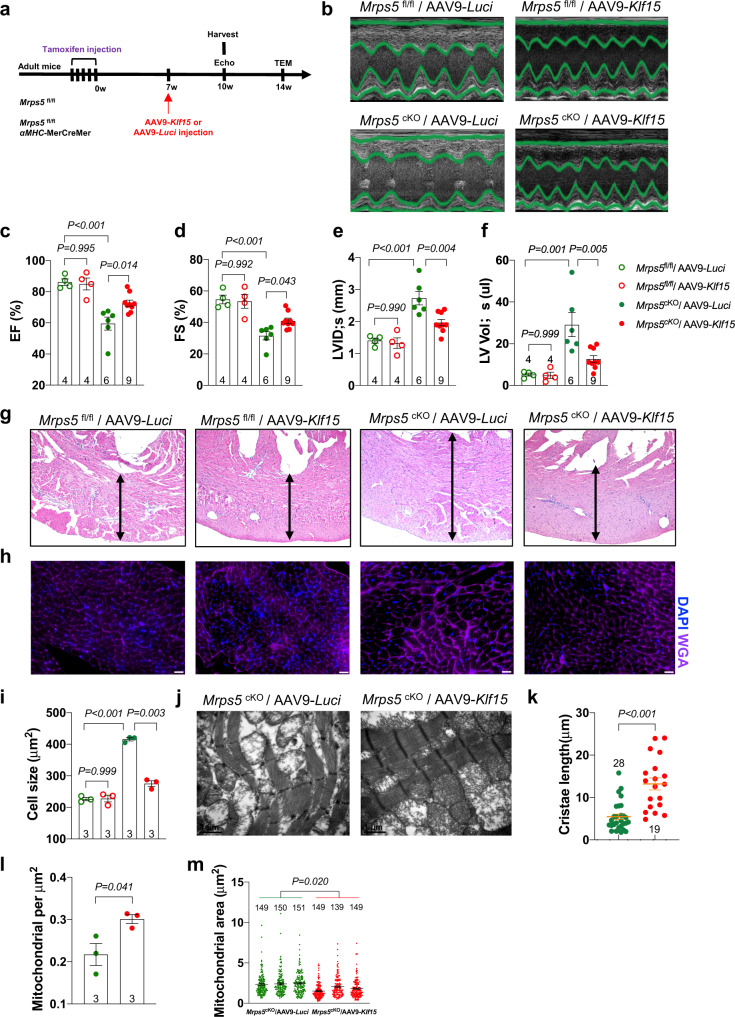
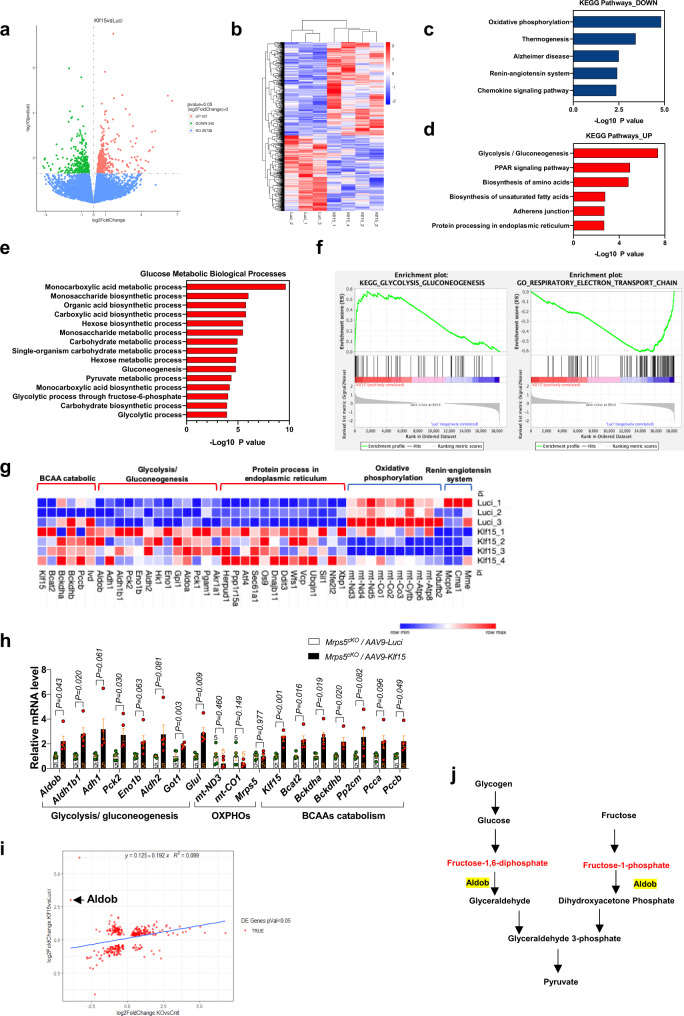
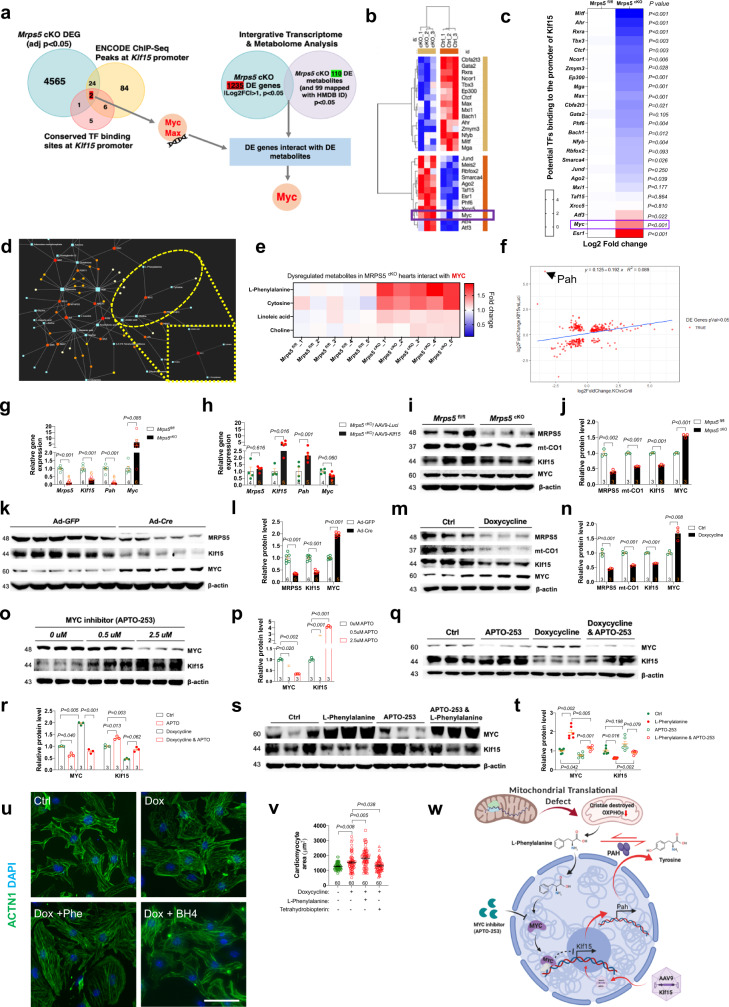
The regulation of the informational flow from the mitochondria to the nucleus (mitonuclear communication) is not fully characterized in the heart. We have determined that mitochondrial ribosomal protein S5 (MRPS5/uS5m) can regulate cardiac function and key pathways to coordinate this process during cardiac stress. We demonstrate that loss of Mrps5 in the developing heart leads to cardiac defects and embryonic lethality while postnatal loss induces cardiac hypertrophy and heart failure. The structure and function of mitochondria is disrupted in Mrps5 mutant cardiomyocytes, impairing mitochondrial protein translation and OXPHOS. We identify Klf15 as a Mrps5 downstream target and demonstrate that exogenous Klf15 is able to rescue the overt defects and re-balance the cardiac metabolome. We further show that Mrps5 represses Klf15 expression through c-myc, together with the metabolite L-phenylalanine. This critical role for Mrps5 in cardiac metabolism and mitonuclear communication highlights its potential as a target for heart failure therapies.


Conflict of interest statement

The authors declare no competing interests.

Figures

Fig. 1
Fig. 1. Cardiomyocyte-specific Mrps5 deletion results in cardiac hypertrophy and heart failure.
a Gene expression level of Mrps5 and other regulators of mitochondrial gene expression and ETC genes are downregulated in hypertrophic hearts. b, c Western blot of protein levels of MRPS5 and mitochondrial encoded protein mt-ATPase 6 in control (Sham) and hypertrophic mouse hearts (TAC). d Gene expression level of Mrps5 and other regulators of mitochondrial gene expression and ETC genes in isolated neonatal mouse cardiomyocytes (NMCMs) in response to hypertrophic agonizts phenylephrine (PE), isoproterenol (ISO) and fetal bovine serum (FBS) in vitro e, f Analysis of protein levels of MRPS5 and mt-ATPase 6 in human hearts from control or patients diagnosed with dilated cardiomyopathy (DCM). g Gene expression level of Mrps5 is significantly decreased at 2 weeks to 18 weeks after tamoxifen injection. h Gross heart morphology from control Mrps5fl/fl and Mrps5cKO mice at 12 weeks after tamoxifen injection. Scale bar = 500 µm. i Heart sections stained with hematoxylin and eosin (top panel) or Sirius Red and Fast Green (bottom panel) from control Mrps5fl/fl and Mrps5cKO mice at 12 weeks after tamoxifen injection. Scale bar = 500 µm. j Heart weight to body weight ratio of Mrps5fl/fl and Mrps5cKO mice at 2 to 22 weeks after tamoxifen injection. k Representative images of heart cross sections from Mrps5fl/fl and Mrps5cKO mice at 8, 12, and 18 weeks after tamoxifen injection (immunostained with Wheat germ agglutinin (WGA) in red and DAPI in blue). Scale bar = 100 μm. l Quantification of the cross-sectional area of cardiomyocytes and m Cardiac fibrosis from Mrps5fl/fl and Mrps5cKO mice at 4 to 18 weeks after tamoxifen injection. n Survival curve of Mrps5fl/fl and Mrps5cKO mice post tamoxifen injection. o Echocardiographic measurement of cardiac function in Mrps5fl/fl and Mrps5cKO mice at 5 to 23 weeks after tamoxifen injection. p qRT-PCR analysis of cardiomyopathy marker genes from control Mrps5fl/fl and Mrps5cKO mouse hearts at 6 to 18 weeks after tamoxifen injection. N numbers are indicated in each panel. All data were presented as mean ± SEM. P values were determined by a two-tailed unpaired Students’ t-test.
Fig. 2
Fig. 2. Mitochondrial defects in Mrps5 mutant hearts.
a Transmission electronic microscopic (TEM) images of Mrps5fl/fl and Mrps5cKO hearts at 8 to 18 weeks after tamoxifen injection showing mitochondria (M) and sarcomeres (S). Scale bar as indicated in the bottom of the figure panels. b Quantification of mitochondrial cristae length of Mrps5fl/fl and Mrps5cKO cardiomyocytes from 8 to 18 weeks after tamoxifen injection. c Quantification of ATP content in heart tissue samples from Mrps5fl/fl and Mrps5cKO mice, 8 to 18 weeks after tamoxifen injection. d Oxygen consumption rate of Mrps5fl/fl and Mrps5cKO hearts at 8 to 18 weeks after tamoxifen injection. e Quantification of activities of the ETC complexes of Mrps5fl/fl and Mrps5cKO hearts at 8 to 18 weeks after tamoxifen injection. f Immunoblot of mitochondrial electron transport chain protein complexes isolated from Mrps5fl/fl and Mrps5cKO mouse heart mitochondria at 12 weeks after tamoxifen injection. g Quantification of mitochondrial genome encoded protein expression level from Mrps5fl/fl and Mrps5cKO mouse heart mitochondria via parallel reaction monitoring (PRM) mass spectrometry at 10 weeks after tamoxifen injection. h Representative immunoblot and quantification of mitochondrial genome encoded proteins from lysates of Mrps5fl/fl and Mrps5cKO mouse hearts at 12 weeks after tamoxifen injection. VDAC serves as a loading control. N numbers are indicated in each panel. All data were presented as mean ± SEM. P values were determined by a two-tailed unpaired Students’ t-test.
Fig. 3
Fig. 3. Loss of Mrps5 alters translational and metabolic programs in the heart.
a Volcano plot of dysregulated transcripts in Mrps5cKO hearts by comparison with Mrps5fl/fl hearts at 12 weeks following tamoxifen injection. b Hierarchical clustering heatmap of dysregulated transcripts in Mrps5cKO hearts. n = 3. c Principal component analysis (PCA) of gene expression in Mrps5fl/fl and Mrps5cKO hearts. n = 3. d Kyoto Encyclopedia of Genes and Genomes (KEGG) functional enrichment analysis of downregulated genes in Mrps5cKO hearts. e KEGG functional enrichment analysis of the upregulated genes in Mrps5cKO hearts. f Gene set enrichment analysis (GSEA) showing dysregulated signaling pathways in Mrps5cKO hearts. g Enrichment plots of key pathways in Mrps5cKO hearts. h Heatmaps of the relative expression of the differentially expressed genes in dysregulated pathways identified in Mrps5cKO hearts. P values were determined by two-tailed unpaired Students’ t-test in (a, d, e).
Fig. 4
Fig. 4. Functional screening identifies KLF15 as an Mrps5 downstream target in the heart.
a Diagram of workflow for the selection of six Mrps5 downstream target genes from the 2926 downregulated genes identified in Mrps5cKO hearts. b Expression of Klf15 and other top candidate genes in the hearts of Mrps5fl/fl control and Mrps5cKO hearts. c Decreased expression of Klf15 and other top candidate genes in Mrps5 knockdown cardiomyocytes. d Heatmap showing expression of Mrps5, Klf15, and other top candidate genes in TAC-induced hypertrophic mouse hearts. e Dysregulated expression of Mrps5, Klf15, and other top candidate genes in hearts of human dilated cardiomyopathy patients. f Heatmap of the relative gene expression for Mrps5, Klf15, and other top candidate genes in NMCMs after 12, 24, 48 h stimulation with ISO, PE, and FBS, respectively. gl Pearson’ r correlation coefficient with corresponding P values for the covariation between Mrps5, Klf15, and other top candidate genes. m Experimental procedure for the use of AAV9-mediated expression of potential targets for functional screening in Mrps5cKO mice. n M-mode echocardiography of Mrps5cKO mice, 7 weeks after injection of indicated AAV9-construct. o Fractional shortening (FS%) of Mrps5cKO mice, 7 weeks after injection with indicated AAV9-construct. p Ejection fraction (EF) of Mrps5cKO mice, 7 weeks after injection with indicated AAV9-construct. q Immunohistology of heart sections of Mrps5cKO mice, 7 weeks after injection with indicated AAV9-construct. DAPI labels the nucleus, WGA marks the cell membrane, and ACTN1 marks cardiomyocytes. Scale bars = 20 µm. r Quantification of sizes of cardiomyocytes from the previous experiment (Fig. 4q). s Sirius Red and Fast Green staining of heart sections of Mrps5cKO mice, 7 weeks after injection of indicated AAV9-construct. Scale bars = 50 µm. The boxed area in the upper panel is shown magnified in the lower panel. t Quantification of fibrosis from the previous experiment (Fig. 4s). N numbers are indicated in each panel. All data were presented as mean ± SEM. P values were determined by one-way ANOVA with the Brown–Forsythe and Welch multiple comparisons test.
Fig. 5
Fig. 5. Overexpression of KLF15 prevents cardiac defects in Mrps5 mutant mice.
a Experimental procedure to test the function of Klf15 in preventing the development of cardiomyopathy in Mrps5cKO mice. Neonatal Mrps5cKO mice were injected with control AAV9-Luci or AAV9-Klf15. Tamoxifen was injected at 4 weeks to induce the deletion of Mrps5 in the heart. Echocardiography was performed at indicated time points (M-mode data shown). b Gene expression of Klf15 in Mrps5cKO mice injected with AAV-Luci/Klf15, respectively. cf Ejection fraction (EF), fractional shortening (FS), left ventricular systolic diameter (LVID;s), and left ventricular volume (LV Vol;s) were recorded in AAV9-Luci or AAV9-Klf15 injected Mrps5cKO mice at indicated time points. g Immunohistology of heart sections of Mrps5cKO mice after neonatal injection of AAV9-Luci or AAV9-Klf15. DAPI (nucleus), WGA (cell membrane), and ACTN1 (cardiomyocytes). Scale bars = 20 µm. h Quantification of cardiomyocyte size from Fig. 5g. i Heart weight to body weight ratio of AAV9-Luci or AAV9-Klf15 injected Mrps5cKO mice. jm qRT-PCR analysis of Nppa, Nppb, Acta1, and Mrps5 genes in 19-week-old Mrps5cKO hearts after neonatal injection of AAV9-Luci or AAV9-Klf15. n Sirius Red and Fast Green staining of heart sections from Mrps5cKO mice at 19 weeks of age following neonatal injection of AAV9-Luci or AAV9-Klf15. Scale bars = 50 µm. o Quantification of fibrosis from hearts described in Fig. 5n. p TEM images of heart tissue from 19-week-old Mrps5cKO mice injected at the neonatal stage with AAV9-Luci or AAV9-Klf15. Scale bars as indicated. q Quantification of mitochondrial cristae length from hearts of mice described in Fig. 5p. r Quantification of mitochondrial numbers per µm in heart tissue from mice described in Fig. 5p. s Quantification of the mitochondrial area in heart tissue from mice described in Fig. 5p. ho, qs Comparisons between Mrps5cKO mice injected with AAV9-Luci (green) or AAV9-Klf15 (red), as indicated in the legend for (Fig. 5r). N numbers are indicated in each panel. All data were presented as mean ± SEM. P values were determined by a two-tailed unpaired Students’ t-test.
Fig. 6
Fig. 6. Restoration of cardiac Klf15 expression rescues heart defects in Mrps5cKO mutant mice.
a Schematic depiction of approach used for delivery of AAV9- Luci/Klf15 to the adult Mrps5fl/fl/Mrps5cKO mouse hearts. b Representative examples of M-mode echocardiography recorded at 10 weeks after tamoxifen injection of Mrps5fl/fl and Mrps5cKO mice injected with either AAV9-Luci or AAV9-Klf15 (as indicated). cf Quantification of EF, FS, LVID;s, and LV Vol;s from each group as indicated in legend for f, at 10 weeks after tamoxifen injection. g Representative images of H&E stained cross sections of heart tissue from each group as indicated. h Representative images of cross sections of heart tissue from each group as indicated. The heart sections were immunostained with WGA in purple and DAPI in blue. Scale bar = 25 μm. i Quantification of the cross-sectional area of cardiomyocytes from hearts of mice at 10 weeks after tamoxifen injection for each group as indicated in legend for (Fig. 6f). j TEM images of AAV9-Luci or AAV9-Klf15 injected Mrps5cKO mice at 14 weeks post last tamoxifen injection. Scale bar as indicated in panels. k Quantification of mitochondrial cristae length from AAV9-Luci or AAV9-Klf15 injected Mrps5cKO mice described in Fig. 6j. l Quantification of mitochondrial numbers per μm from AAV9-Luci or AAV9-Klf15 injected Mrps5cKO mice described in Fig. 6j. m Quantification of the mitochondrial area from AAV9-Luci or AAV9-Klf15 injected Mrps5cKO mice described in Fig. 6j. N numbers are indicated in each panel. All data are presented as mean ± SEM. P values were determined by one-way ANOVA with the Brown–Forsythe and Welch multiple comparisons test.
Fig. 7
Fig. 7. Klf15 regulates cardiac metabolism and corrects imbalanced metabolome in Mrps5 mutant hearts.
a Volcano plot of the dysregulated genes in Mrps5cKO/AAV-Klf15 by comparison with Mrps5cKO/AAV-Luci hearts. b Hierarchical clustering heatmap of dysregulated genes in Mrps5cKO/AAV-Luci and Mrps5cKO/AAV-Klf15 hearts. c Kyoto Encyclopedia of Genes and Genomes (KEGG) functional enrichment analysis of the downregulated genes in Mrps5cKO/AAV-Klf15 hearts. d KEGG functional enrichment analysis of the upregulated genes in Mrps5cKO/AAV-Klf15 hearts. e Gene Ontology (GO) analysis of the glucose metabolic biological processes affected in Mrps5cKO/AAV-Klf15 hearts. f Heatmaps of the relative expression of the differentially expressed genes in dysregulated pathways identified in Mrps5cKO/AAV-Luci and Mrps5cKO/AAV-Klf15 hearts. g Gene set enrichment analysis (GSEA) showing dysregulated signaling pathways in Mrps5cKO/AAV-Klf15 hearts. h qRT-PCR analysis of the mRNA expression level of glycolysis/gluconeogenesis, OXPHOS, and BCAAs catabolic associated genes in Mrps5cKO/AAV-Luci (n = 5) and Mrps5cKO/AAV-Klf15 hearts (n = 5). i Scatter diagram of dysregulated genes in Mrps5cKO versus Mrps5fl/fl hearts and Mrps5cKO/AAV-Klf15 versus Mrps5cKO/AAV-Luci hearts. The gene expression level of Aldob is reduced in Mrps5cKO but enhanced in Mrps5cKO/AAV-Klf15 hearts. j Diagram illustrating the position and role of Aldob in the glycolysis/gluconeogenesis pathway. All data were presented as mean ± SEM. P values were determined by a two-tailed unpaired Students’ t-test in (a, c, d, e, h, i).
Fig. 8
Fig. 8. The metabolite l-phenylalanine and transcription factor myc mediate mitonuclear communication to repress KLF15.
a Rationale used to identify potential upstream signals regulating Klf15 expression in Mrps5cKO hearts. b Correlation of the heatmap and c relative expression of the candidate genes from the Mrps5cKO RNA-sequencing data correlated with the ENCODE ChIP-Seq peaks over the Klf15 gene promoter and/or the conserved transcription factor binding sites over the Klf15 promoter. d Dysregulated gene and metabolite interaction networks after Mrps5 deletion. e Heatmap of the DE metabolites that interact with myc after Mrps5 deletion. f Scatter diagram of dysregulated genes in Mrps5cKO versus Mrps5fl/fl hearts and Mrps5cKO/AAV-Klf15 versus Mrps5cKO/AAV-Luci hearts highlighting Pah expression. The gene expression level of Pah is decreased in Mrps5cKO hearts while it is elevated in Mrps5cKO/AAV-Klf15 hearts. g qRT-PCR analysis of the expression level of Mrps5, Klf15, Pah, and Myc in Mrps5fl/fl and Mrps5cKO hearts and h Mrps5cKO/AAV-Luci and Mrps5cKO/AAV-Klf15 hearts. i, j Representative immunoblot and quantification of protein levels of MRPS5, mt-CO1, KLF15, MYC, and ACTIN in the whole heart lysates of Mrps5fl/fl and Mrps5cKO mice. k, l Representative immunoblot and quantification of the protein level of MRPS5, KLF15, MYC, and ACTIN in whole cell lysates derived from NMCM cells from Mrps5fl/fl mice after adenoviral Cre/GFP treatment for 5 days and m, n H9C2 cells after doxycycline treatment for 4 days (m, n also includes analysis of mt-CO1). o, p Representative immunoblot and quantification of protein levels of MYC and KLF15 in whole cell lysates from H9C2 cells after treatment with the MYC inhibitor APTO-253, q, r APTO-253 and/or doxycycline or s, t APTO-253 and/or l-Phenylalanine. u, v Representative images and cell size quantification of NMCMs treated with doxycycline and/or phenylalanine, tetrahydrobiopterin (BH4). w Schematic depiction of l-phenylalanine/MYC signaling axis demonstrating mechanism for repression of Klf15 expression generated by a defect in mitochondrial translation. Created with BioRender.com. N numbers are indicated in each panel. All data were presented as mean ± SEM. P values were determined by two-tailed unpaired Students’ t-test in (a, c, g, h, j, l, n). P values were determined by one-way ANOVA with Brown–Forsythe and Welch multiple comparisons test in (Fig. 8p, r, t, v).

References

    1. Pagliarini DJ, et al. A mitochondrial protein compendium elucidates complex I disease biology. Cell. 2008;134:112–123. doi: 10.1016/j.cell.2008.06.016. - DOI - PMC - PubMed
    1. Gustafsson CM, Falkenberg M, Larsson NG. Maintenance and expression of mammalian mitochondrial DNA. Ann. Re. Biochem. 2016;85:133–160. doi: 10.1146/annurev-biochem-060815-014402. - DOI - PubMed
    1. Cheong, A., Lingutla, R. & Mager, J. Expression analysis of mammalian mitochondrial ribosomal protein genes. Gene Expr. Patterns38, 119147 (2020). - PMC - PubMed
    1. D’Souza AR, Minczuk M. Mitochondrial transcription and translation: overview. Essays Biochem. 2018;62:309–320. doi: 10.1042/EBC20170102. - DOI - PMC - PubMed
    1. Wang, F., Zhang, D. Y., Zhang, D. J., Li, P. F. & Gao, Y. Y. Mitochondrial protein translation: emerging roles and clinical significance in disease. Front. Cell Dev. Biol.9, 675465 (2021). - PMC - PubMed

Publication types

Substances