. 2023 Mar 22;13(1):4660.
doi: 10.1038/s41598-023-31501-2.

Fascicle dynamics of the tibialis anterior muscle reflect whole-body walking economy

Affiliations

Fascicle dynamics of the tibialis anterior muscle reflect whole-body walking economy

Samuel T Kwak et al. Sci Rep. .

Abstract

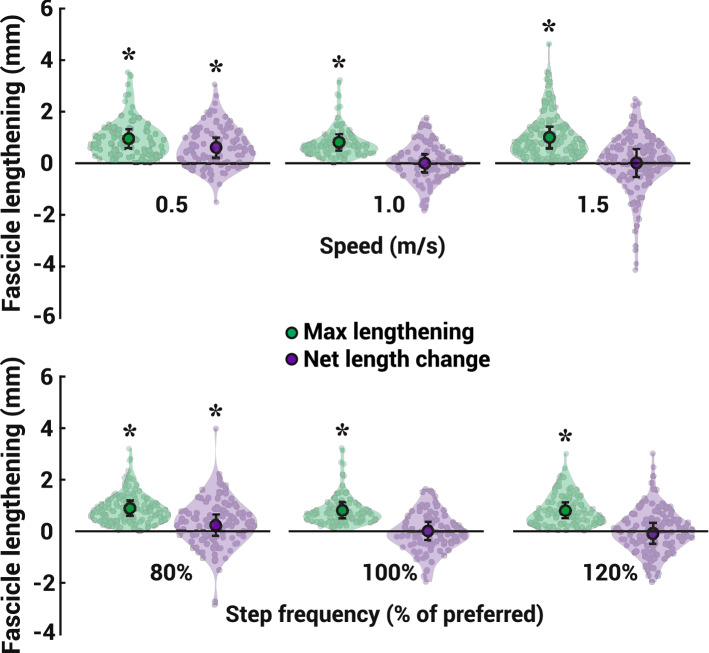
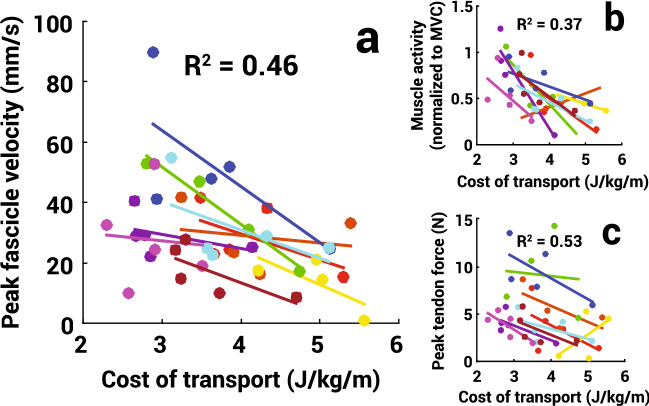
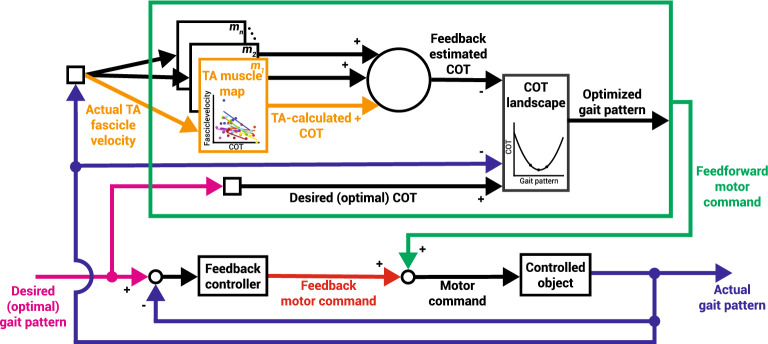
Humans can inherently adapt their gait pattern in a way that minimizes the metabolic cost of transport, or walking economy, within a few steps, which is faster than any known direct physiological sensor of metabolic energy. Instead, walking economy may be indirectly sensed through mechanoreceptors that correlate with the metabolic cost per step to make such gait adaptations. We tested whether velocity feedback from tibialis anterior (TA) muscle fascicles during the early stance phase of walking could potentially act to indirectly sense walking economy. As participants walked within a range of steady-state speeds and step frequencies, we observed that TA fascicles lengthen on almost every step. Moreover, the average peak fascicle velocity experienced during lengthening reflected the metabolic cost of transport of the given walking condition. We observed that the peak TA muscle activation occurred earlier than could be explained by a short latency reflex response. The activation of the TA muscle just prior to heel strike may serve as a prediction of the magnitude of the ground collision and the associated energy exchange. In this scenario, any unexpected length change experienced by the TA fascicle would serve as an error signal to the nervous system and provide additional information about energy lost per step. Our work helps provide a biomechanical framework to understand the possible neural mechanisms underlying the rapid optimization of walking economy.


Conflict of interest statement

The authors declare no competing interests.

Figures

Figure 1
Figure 1
COT landscape curves with respect to walking speed (left) and step frequency (right). Data shown are means (filled circles) and standard deviations (error bars) (n = 10). The solid curves show a 2nd order polynimial fit of the mean data. The dashed curve shows the COT vs speed equation derived by Browning and Kram.
Figure 2
Figure 2
TA fascicle length changes during early stance across different walking speeds (top) and step frequencies (bottom). Mean values with standard deviation bars are superimposed on violin plots representing the maximum fascicle lengthening (green) and the net change in fascicle length (purple) observed for every step of every subject. Asterisks above violin plots indicate significantly greater than zero (α < 0.05).
Figure 3
Figure 3
(a) Peak TA fascicle lengthening velocity, (b) peak TA muscle activity, and (c) peak TA tendon force as a function of whole-body metabolic COT with the adjusted R2 for the linear mixed model across all subjects. Each color represents an individual subject with dots as the mean value for a given walking condition and lines as the linear fit for a single subject across conditions.
Figure 4
Figure 4
Histograms with normal distribution curves for the times after heel contact of the (a) initial TA fascicle lengthening (red) and (b) peak TA EMG activity (blue). (c) The TA fascicle length change (red) and relative EMG (blue) of the TA muscle from a representative step cycle with arrows indicating when initial lengthening (red arrow) and peak EMG (blue arrow) occur. Only a partial gait cycle is shown here. (d) Histogram with a normal distribution curve for the latency from initial lengthening to peak EMG with an indication (red) of the earliest time a short latency response (SLR) would occur.
Figure 5
Figure 5
Proposed feedback control model of gait using cost of transport (adapted from Wolpert et al.). The controlled object, which is a physical entity controlled by the central nervous system such as the legs, consists of transformations from motor command to the motion of the controlled object resulting in a gait pattern. “Optimal” can be considered the gait pattern that minimizes the COT. The actual gait pattern manifests itself through the lengthening and shortening of a subset of n muscles. Each respective muscle map mn correlates individual muscle feedback and whole-body COT, such as TA muscle fascicle velocity as derived from our study (orange, Fig. 3). The individual muscle estimates can be summed to create a more accurate representation of whole-body COT. This feedback-estimated COT value along with the actual gait pattern provides a state estimation within the COT landscape (Fig. 1). An error-based correction can then be made to ultimately generate a predicted optimized gait pattern as a feedforward motor command.
Figure 6
Figure 6
(a) Subjects walked to a metronome beat on a treadmill at a set speed. (b) We measured whole body indirect calorimetry (yellow) as well as EMG (blue) and B-mode ultrasound (red) from the TA muscle during walking. (c) We determined gait events such as heel strike (HS), foot-flat (FF), and toe-off (TO) using retroreflective markers and ground reaction force measurement. We used the ultrasound images to measure TA muscle fascicle length across the gait cycle (top). We calculated the net length change (purple) and single maximum lengthening episode (green) of the fascicle during the period between heel strike and foot-flat (bottom).

References

    1. Ralston HJ. Energy-speed relation and optimal speed during level walking. Int. Zeitschrift Angew. Physiol. Einschl. Arbeitsphysiologie. 1958;17:277–283. - PubMed
    1. Browning RC, Kram R. Energetic cost and preferred speed of walking in obese vs. normal weight women. Obes. Res. 2005;13:891–899. doi: 10.1038/oby.2005.103. - DOI - PubMed
    1. Zarrugh MY, Radcliffe CW. Predicting metabolic cost of level walking. Eur. J. Appl. Physiol. Occup. Physiol. 1978;38:215–223. doi: 10.1007/BF00430080. - DOI - PubMed
    1. Minetti AE, Ardigo LP, Saibene F. The transition between walking and running in humans: Metabolic and mechanical aspects at different gradients. Acta Physiol. Scand. 1994;150:315–323. doi: 10.1111/j.1748-1716.1994.tb09692.x. - DOI - PubMed
    1. Selinger JC, O’Connor SM, Wong JD, Donelan JM. Humans can continuously optimize energetic cost during walking. Curr. Biol. 2015;25:2452–2456. doi: 10.1016/j.cub.2015.08.016. - DOI - PubMed

Publication types