. 2023 Apr;616(7955):168-175.
doi: 10.1038/s41586-023-05838-7. Epub 2023 Mar 22.

RHOJ controls EMT-associated resistance to chemotherapy

Affiliations

RHOJ controls EMT-associated resistance to chemotherapy

Maud Debaugnies et al. Nature. 2023 Apr.

Abstract

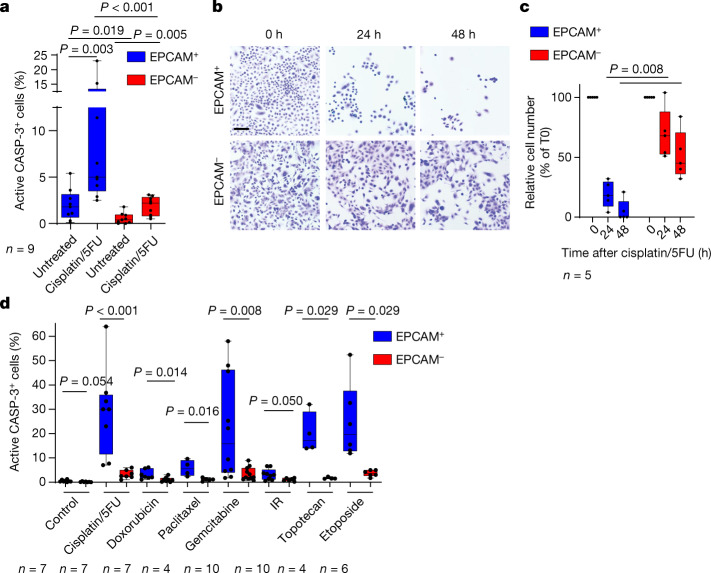
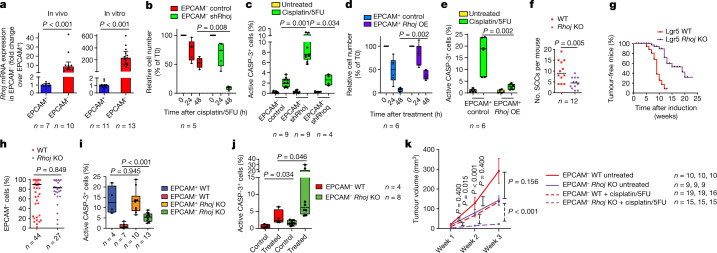
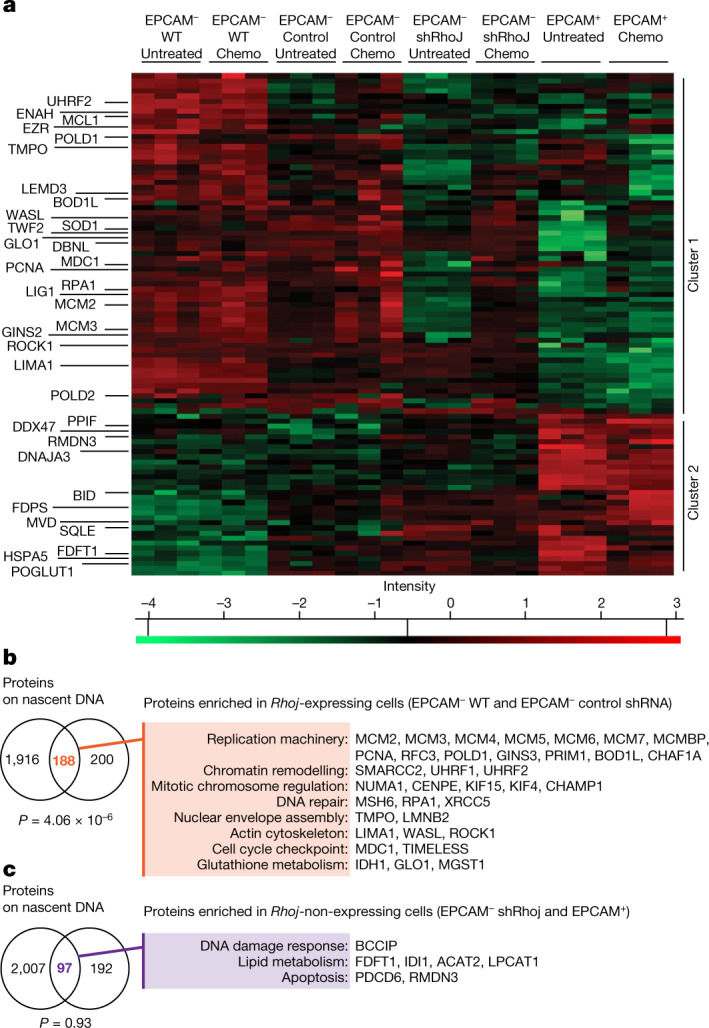
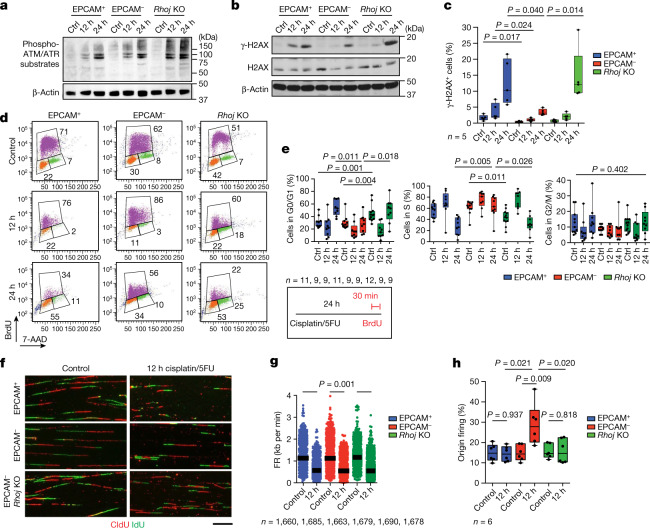
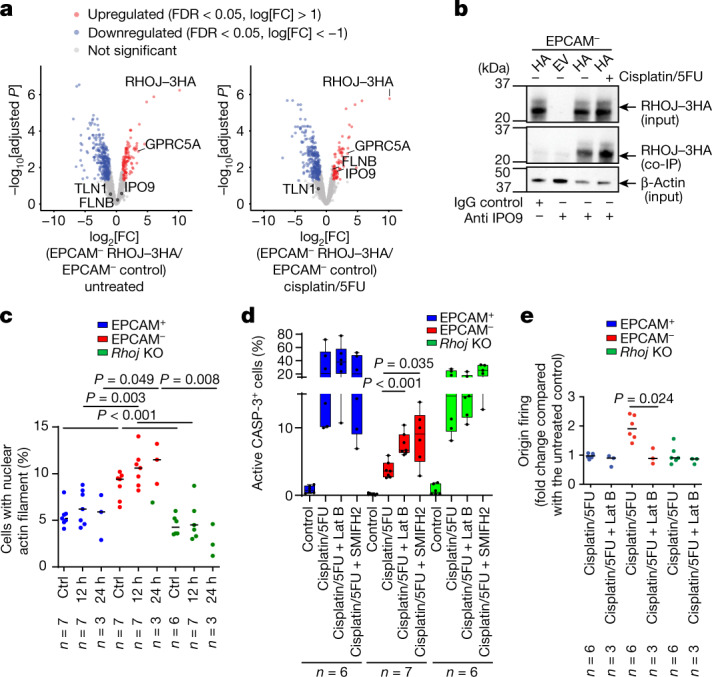
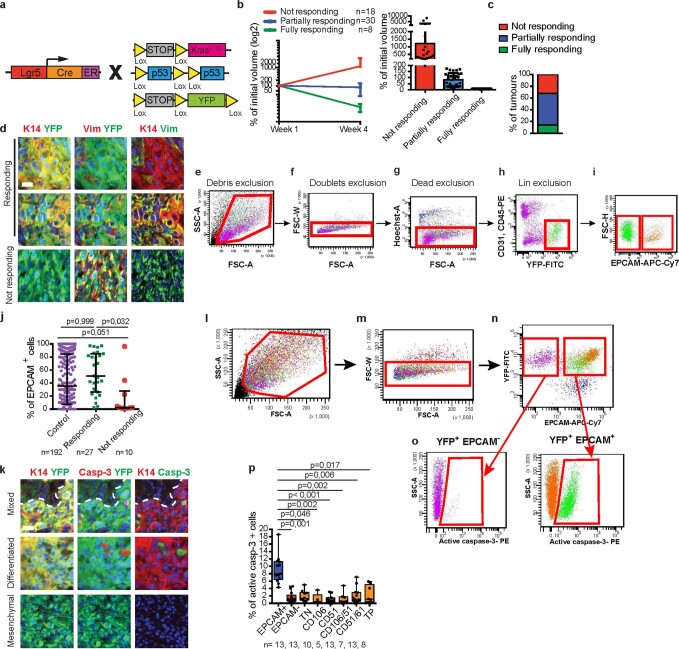
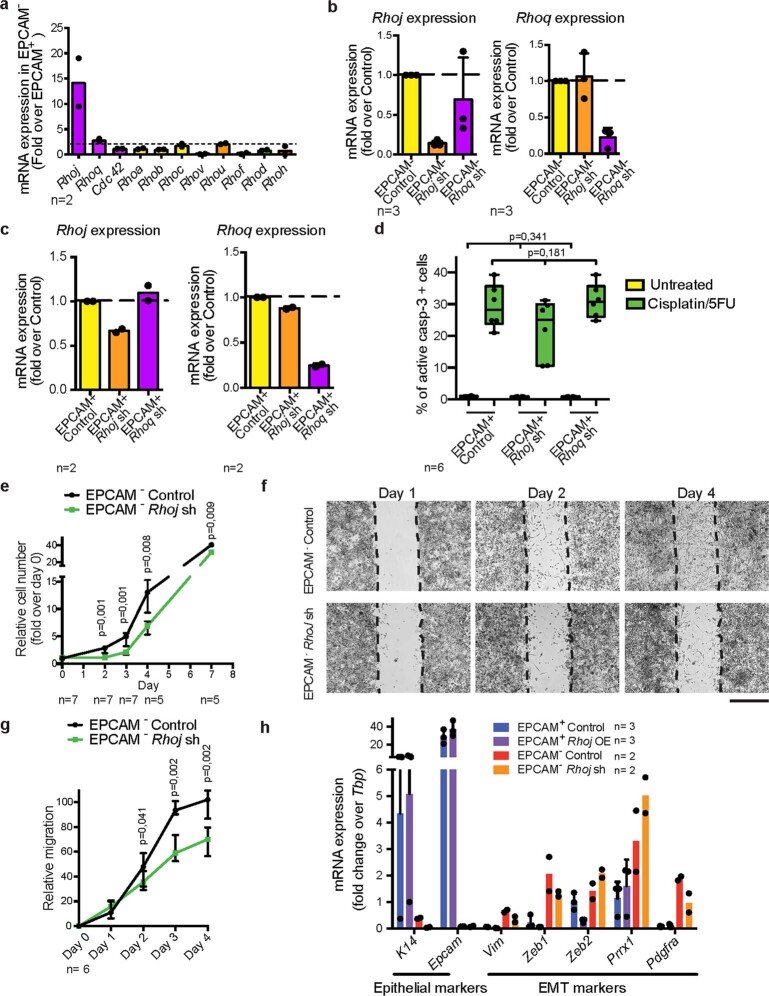
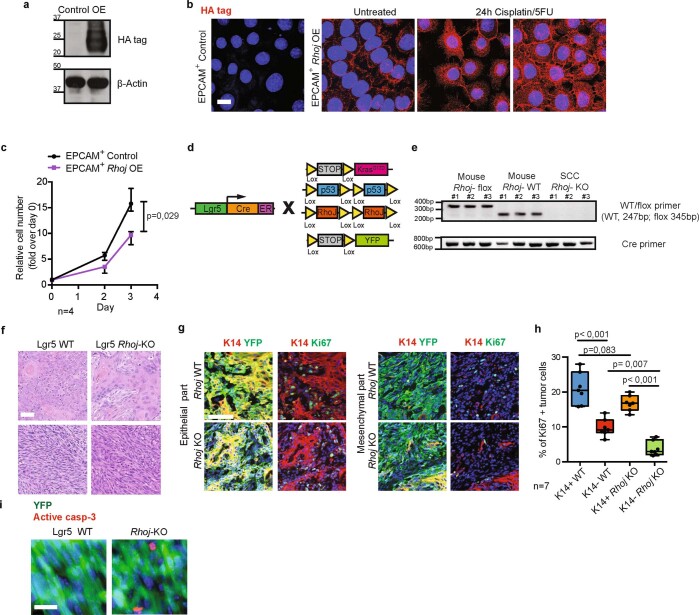
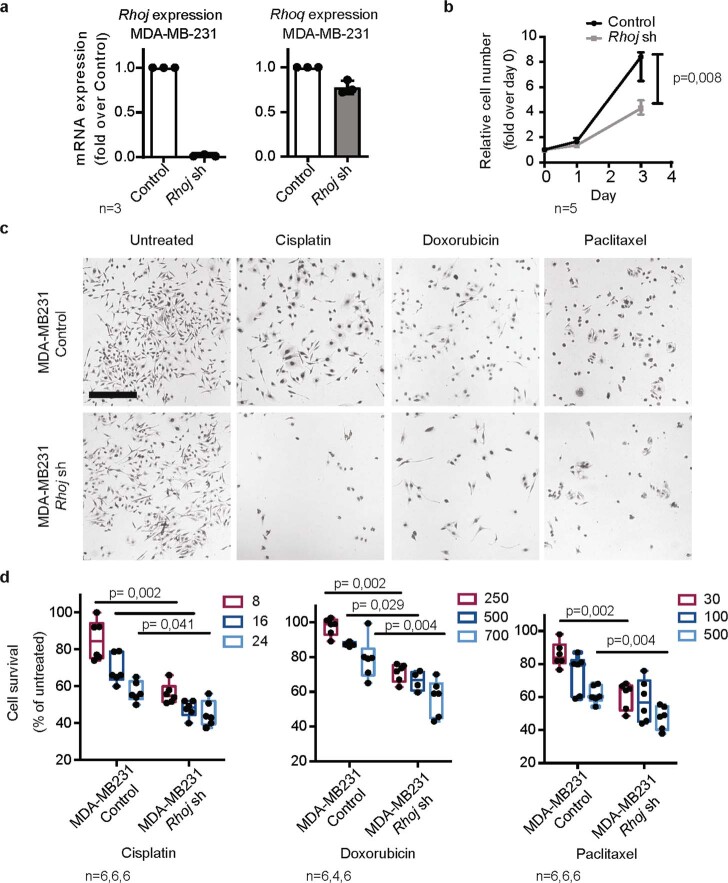
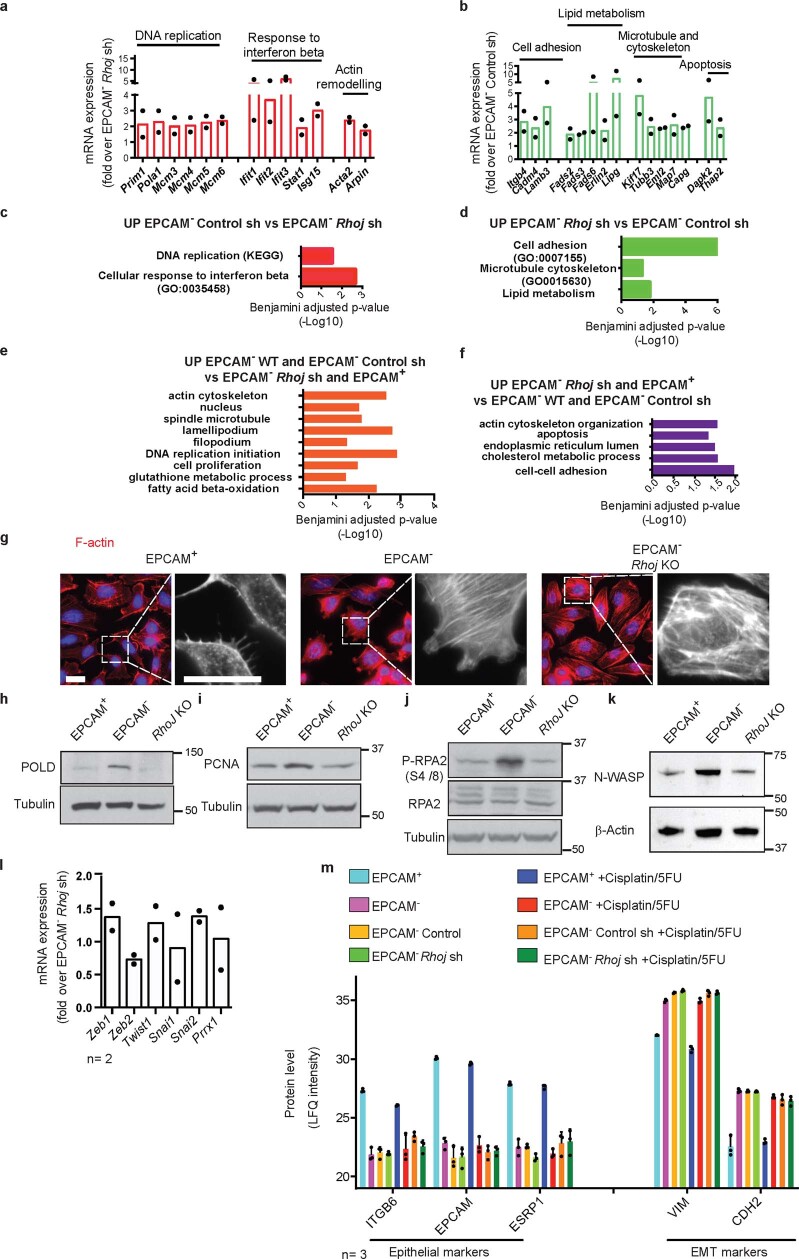
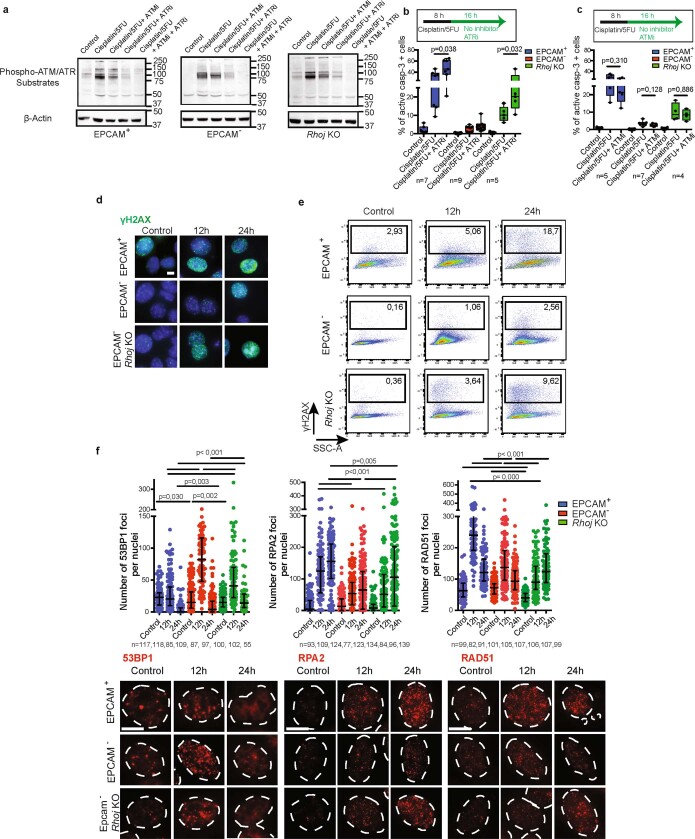
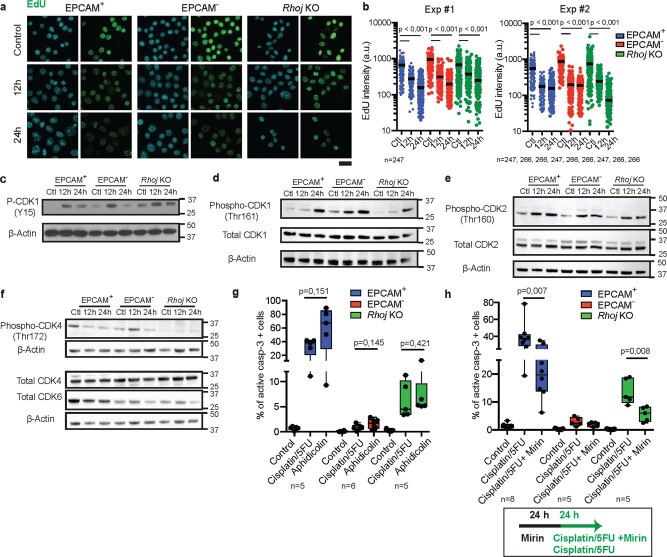
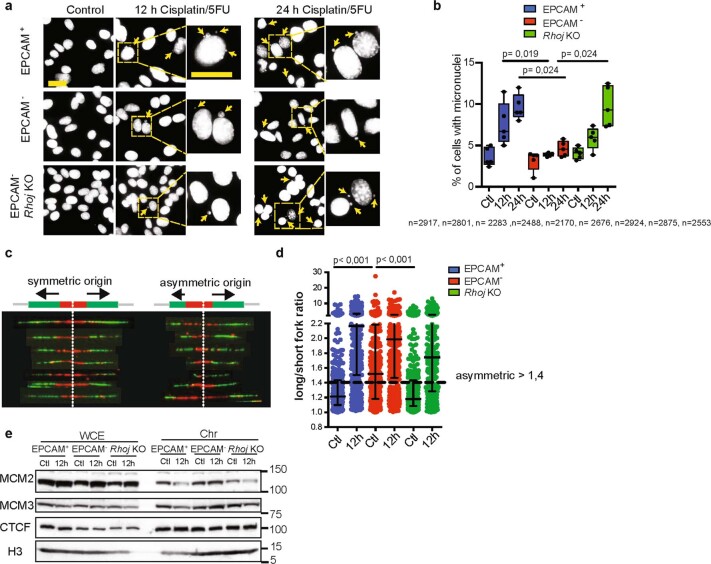
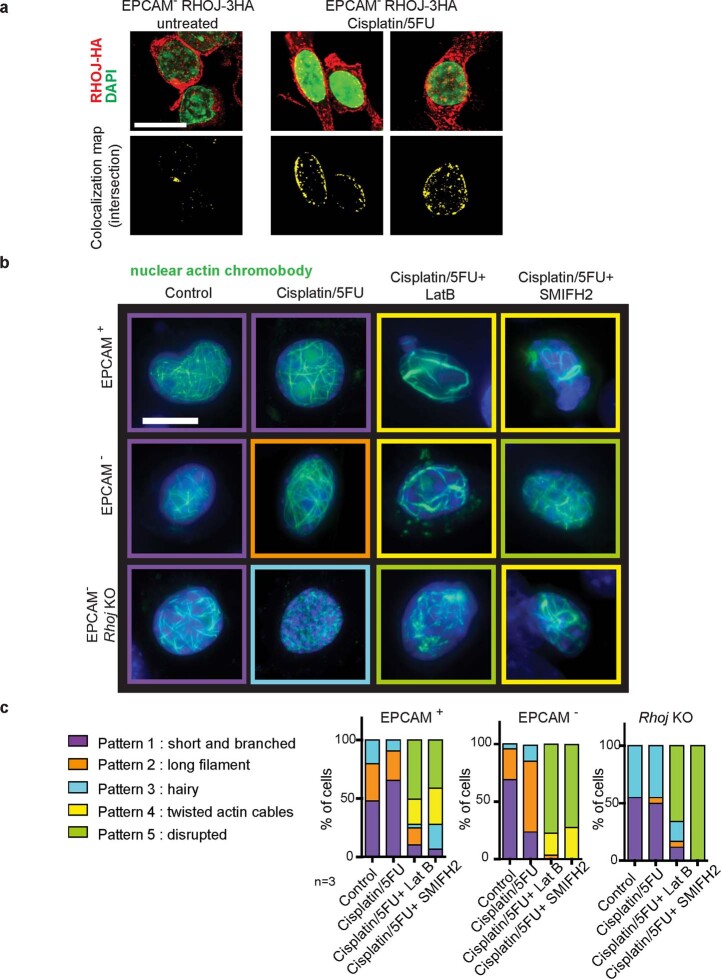
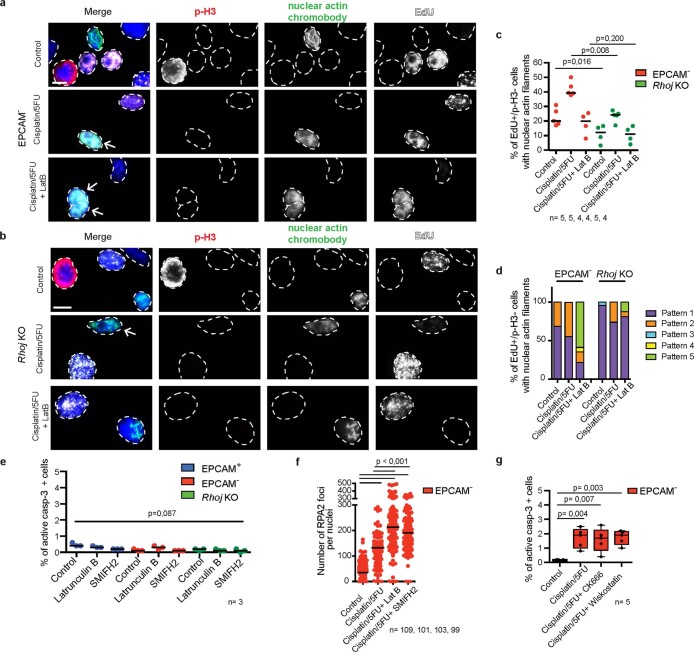
The resistance of cancer cells to therapy is responsible for the death of most patients with cancer1. Epithelial-to-mesenchymal transition (EMT) has been associated with resistance to therapy in different cancer cells2,3. However, the mechanisms by which EMT mediates resistance to therapy remain poorly understood. Here, using a mouse model of skin squamous cell carcinoma undergoing spontaneous EMT during tumorigenesis, we found that EMT tumour cells are highly resistant to a wide range of anti-cancer therapies both in vivo and in vitro. Using gain and loss of function studies in vitro and in vivo, we found that RHOJ-a small GTPase that is preferentially expressed in EMT cancer cells-controls resistance to therapy. Using genome-wide transcriptomic and proteomic profiling, we found that RHOJ regulates EMT-associated resistance to chemotherapy by enhancing the response to replicative stress and activating the DNA-damage response, enabling tumour cells to rapidly repair DNA lesions induced by chemotherapy. RHOJ interacts with proteins that regulate nuclear actin, and inhibition of actin polymerization sensitizes EMT tumour cells to chemotherapy-induced cell death in a RHOJ-dependent manner. Together, our study uncovers the role and the mechanisms through which RHOJ acts as a key regulator of EMT-associated resistance to chemotherapy.


Conflict of interest statement

The authors declare no competing interests.

Figures

Fig. 1
Fig. 1. EMT is associated with intrinsic resistance to chemotherapy in SCCs.
a, FACS quantification of the percentage of active caspase-3-positive cells in YFP+EPCAM+ and YFP+EPCAM cells from control and 24 h cisplatin/5FU-treated SCCs. n = 9 SCCs. b,c, Microscopy analysis of the cellular density of EPCAM+ and EPCAM tumour cells (b) and quantification of the number of cells (c) 24 h and 48 h after cisplatin/5FU administration in vitro. Scale bar, 100 μm. n = 5 independent experiments. d, FACS quantification of the percentage of activated caspase-3-positive cells in YFP+EPCAM+ and YFP+EPCAM cells 24 h after cisplatin/5FU administration (n = 7); doxorubicin (n = 7), paclitaxel (n = 4), gemcitabine (n = 10), topotecan (n = 4) or etoposide (n = 6) administration; and 24 h after receiving 10 Gy irradiation. n values represent the number of biological independent experiments. For a, c and d, statistical analysis was performed using two-sided Mann–Whitney U-tests. P values were adjusted for multiple comparisons using Bonferroni correction. For the box plots, the centre line shows the median, the box limits represent the 25th and 75th percentiles, and the whiskers show the minimum and maximum values. Source data
Fig. 2
Fig. 2. RHOJ mediates resistance to chemotherapy associated with EMT.
a, RT–qPCR analysis of Rhoj expression in EPCAM cells compared with in EPCAM+ cells in vivo (left) and in vitro (right). Data are median ± interquartile range, normalized to the housekeeping gene Tbp. n values indicate the number of independent experiments. b, The relative cell number of EPCAM control and Rhoj shRNA KD cells 24 h and 48 h after cisplatin/5FU administration in vitro. n values indicate the number of independent experiments. c, FACS quantification of the percentage of activated caspase-3-positive cells in EPCAM control, Rhoj shRNA KD and Rhoq shRNA KD cells 24 h after cisplatin/5FU administration. n values indicate the number of independent experiments. d,e, The relative cell number (d) and FACS quantification of the percentage of activated caspase-3-positive cells (e) of control and RHOJ-overexpressing (OE) EPCAM+ cells 24 h and 48 h after cisplatin/5FU administration in vitro. n = 6 independent experiments. f,g, The median number of SCCs per mouse (f) and kinetics of tumour appearance (g) in control and Rhoj-KO mice. n values indicate the number of mice. h, FACS quantification of the percentage of EPCAM cells of tumours from WT and Rhoj-KO SCCs. Data are median. n values indicate the number of mice. i,j, FACS quantification of the percentage of activated caspase-3-positive cells in EPCAM+ and EPCAM cells 24 h after cisplatin/5FU administration from WT (n = 4 and 7 SCCs) and Rhoj-KO mice (n = 10 and 13 SCCs) in vivo (i) and in EPCAM cells from WT-derived (n = 4) and Rhoj-KO-derived (n = 8) cell lines 24 h after cisplatin/5FU administration in vitro (j). n values indicate the number of independent experiments. k, The tumour volume after cisplatin/5FU administration to mice that were grafted with WT and Rhoj-KO tumour cells compared with untreated mice. Data are mean ± s.e.m. n values indicate the number of mice. For af and hk, statistical analysis was performed using two-sided Mann–Whitney U-tests. P values were adjusted using Bonferroni correction when multiple comparisons were performed. For the box plots, the centre line shows the median, the box limits represent the 25th and 75th percentiles, and the whiskers show the minimum and maximum values. Source data
Fig. 3
Fig. 3. Proteomic analysis after Rhoj KO in EMT tumour cells.
a, The relative intensities of selected upregulated proteins identified in RHOJ-expressing cells (EPCAM WT and EPCAM control shRNA) and in RHOJ-non-expressing cells (EPCAM+ and EPCAM Rhoj shRNA KD) in untreated conditions and after 24 h of cisplatin/5FU treatment. Two major clusters were observed. n = 3 technical replicates. Z-scored log2-transformed label-free quantitation (LFQ) intensities are shown. Statistical analysis was performed using two-way ANOVA; P < 0.05. Individual P values are provided as Source Data. b,c, The overlap between a published proteomic study of proteins associated with replicative fork (iPond) and the proteins enriched in RHOJ-expressing cells (b) or the proteins enriched in RHOJ-non-expressing cells (c) in the untreated condition and 24 h after cisplatin/5FU administration. The P value was calculated using the hypergeometric test. Source data
Fig. 4
Fig. 4. RHOJ promotes DNA repair and the activation of new origins of DNA replication after chemotherapy in EMT tumour cells.
a, Western blot analysis of phosphorylation of ATM/ATR substrates in EPCAM+, EPCAM and Rhoj-KO EPCAM cells untreated and treated with cisplatin/5FU for 12 h and 24 h. n = 3. b,c, Western blot analysis (b; n = 3) and FACS analysis quantification (c; n = 5) of the percentage of cells expressing γ-H2AX in EPCAM+, EPCAM and EPCAM Rhoj-KO cells, 12 h and 24 h after cisplatin/5FU administration. β-Actin was the loading control. n values represent the number of independent primary cultured cell lines. d,e, Representative cell cycle FACS profile (d) and quantification (e) of the percentage of cells in G0/G1, S and G2/M phase 12 h and 24 h after cisplatin/5FU treatment of EPCAM+, EPCAM and EPCAM Rhoj-KO BrdU-7AAD-labelled cells. n values indicate the number of independent experiments. f, Representative stretched DNA fibres labelled with CldU and IdU from EPCAM+, EPCAM and EPCAM Rhoj-KO cells untreated and treated with cisplatin/5FU for 12 h. n = 6. Scale bar, 10 μm. g, Fork rate (FR) values in EPCAM+, EPCAM and EPCAM Rhoj-KO cells untreated and treated with cisplatin/5FU for 12 h. Data are median. Statistical analysis was performed using ANOVA, with condition, experience and their interaction; the P value was adjusted using the two-way post hoc Sidak test. n values represent the number of forks pooled from six independent experiments. h, The percentage of origin of firing in EPCAM+, EPCAM and EPCAM Rhoj-KO cells untreated and treated with cisplatin/5FU for 12 h. From left to right, total number of DNA fibres scored: n = 3,020, 3,123, 3,065, 3,091, 3,078 and 3,069, in six independent experiments. For c, e and h, statistical analysis was performed using Kruskal–Wallis tests followed by two-sided Mann–Whitney U-tests; P values were adjusted for multiple comparisons using Bonferroni correction. For the box plots, the centre line shows the median, the box limits represent the 25th and 75th percentiles, and the whiskers show the minimum and maximum values.
Fig. 5
Fig. 5. RHOJ promotes cell survival and DNA repair by regulating nuclear actin polymerization.
a, Differential protein expression detected by AP–MS analysis of protein complexed with 3HA-tagged RHOJ in EPCAM cells. Volcano plot showing the statistical significance (−log10-transformed P) and the fold change (log2) of proteins identified by MS (false-discovery rate (FDR) < 0.05) in the untreated condition (left) and after 12 h of cisplatin/5FU treatment (right). Selected proteins enriched after immunoprecipitation of 3HA-tagged RHOJ are highlighted. b, Co-immunoprecipitation using anti-IPO9 or IgG control antibodies followed by western blotting using anti-HA antibodies, revealing the association between IPO9 and RHOJ–3HA protein in EPCAM cells 12 h after cisplatin/5FU treatment. n = 2. c, Quantification of the percentage of cells presenting nuclear actin filaments in EPCAM+, EPCAM and EPCAM Rhoj-KO cells expressing nuclear actin chromobody-GFP 12 h and 24 h after cisplatin/5FU treatment (>250 nuclei were quantified per replicate). Data are median. Statistical analysis was performed using ANOVA, with condition, experience and their interaction. P values were adjusted using two-way post hoc Sidak tests. n values indicate the number of replicates. d, FACS quantification of the percentage of activated caspase-3-positive cells in EPCAM+, EPCAM and EPCAM Rhoj-KO cells 24 h after treatment with cisplatin/5FU and latrunculin B (Lat B) or SMIFH2 inhibitor. For the box plots, the centre line shows the median, the box limits represent the 25th and 75th percentiles, and the whiskers show the minimum and maximum values. n values indicate the number of replicates. e, The relative proportion of origin firing in EPCAM+, EPCAM and EPCAM Rhoj-KO cells treated with cisplatin/5FU or a combination of cisplatin/5FU and latrunculin B for 12 h compared with the untreated condition. Data are median. n values indicate the number of independent experiments. For d and e, statistical analysis was performed using Kruskal–Wallis tests followed by two-sided Mann–Whitney U-tests. P values were adjusted for multiple comparisons using Bonferroni correction. Gel source data are provided in Supplementary Fig. 1. Source data
Extended Data Fig. 1
Extended Data Fig. 1. Mouse skin SCCs with EMT are resistant to chemotherapy.
a, Scheme of the genetic strategy to induce KrasG12D and YFP expression and Trp53 deletion in the mouse model of skin SCCs. After tumour appearance, mice are treated for 4 weeks with cisplatin/5FU. b, Evolution of tumour size of treated primary SCC. Relative tumour volumes (Mean ± S.D.) are shown for not responding (n = 18), partially responding (n = 30) and fully responding (n = 8) tumours after 4 weeks of cisplatin/5FU treatment. c, Proportion of not responding, partially responding and fully responding tumours after 4 weeks of cisplatin/5FU treatment. d, Coimmunostaining of YFP and Keratin 14 (K14) or Vimentin (Vim) in partially responding and non-responding tumours treated for 4 weeks with cisplatin/5FU treatment (n = 5; scale bar, 20μm). e-i, FACS plots showing the gating strategy used to FACS-isolate or to analyse the proportion of YFP+ EPCAM+ and EPCAM tumour cells from Lgr5creERKrasG12DTrp53cKORosa-YFP and Lgr5creERKrasG12DTrp53cKORhojcKORosa-YFP skin SCCs presented on Fig. 2h and Extended Data Fig. 1j. Cells were stained for endothelial and immune markers (Lin+) (CD31, CD45) in PE, EPCAM in APC-Cy7 and were gated to eliminate debris (e) and to discard the doublets (f). The living cells were gated by Hoescht dye exclusion (g) and the non-epithelial Lin+ cells were discarded (h). EPCAM expression was studied in Lin-YFP+ (i). j, FACS quantification of the percentage of EPCAM+ cells in the different SCCs subtypes. (Medians and interquartile range (IQR) are shown, two-sided Mann-Whitney U-test, n represents the number of SCCs). k, Co-immunostaining of YFP and activated Caspase-3 or K14 in differentiated, mixed and mesenchymal tumours after 24h of cisplatin/5FU treatment (n = 10; scale bar, 20μm). Nuclei are stained with DAPI (blue). l-o, FACS plots showing the gating strategy to quantify the percentage of activated caspase-3 positive cells in YFP+ EPCAM+ and EPCAM cells after eliminating debris and discarding the doublets (Fig. 1a, d; 2c, e, i, j; 5d and Extended Data Fig. 2d, 7g, h, 8d, e, 10e, g). The same strategy (l-n) was used to quantify the percentage of cells expressing γH2AX and cell cycle analysis (Fig. 4c–e) in YFP+EPCAM+, EPCAM and Rhoj KO EPCAM cells. p, FACS quantification of the percentage of activated caspase-3 positive cells in YFP+/EPCAM+ tumour cells, YFP+/EPCAM tumour cells and in the six different subpopulations of EPCAM tumour cells based on CD106/51/61 markers 24h after cisplatin/5FU administration to mice harbouring SCCs (Medians (IQR) are shown, Kruskal-Wallis test followed by two-sided Mann Whitney tests, n represents the number of SCCs). Source data
Extended Data Fig. 2
Extended Data Fig. 2. RHOJ knockdown in EMT tumour cells decreases cell survival, growth and migration without affecting the expression of EMT or epithelial markers.
a, Relative mRNA expression of Rhoj and Rhoq by RNA seq in FACS isolated EPCAM+ and - EPCAM cells (Bar chart indicates mean; n = 2 SCCs). b-c, qRT-PCR of Rhoj and Rhoq expression validating the specific downregulation of Rhoj and Rhoq after shRNA knockdown in EPCAM cells as compared to control shRNA EPCAM cells (b) and after shRNA knockdown in EPCAM+ cells as compared to control shRNA EPCAM+ cells (c) (data are normalized using housekeeping gene Tbp, Bar chart indicates mean± SD, n represents the number of independent primary cell lines). d, FACS quantification of the percentage of activated caspase-3 positive cells in control EPCAM+, Rhoj shRNA knockdown EPCAM+ and Rhoq shRNA knockdown EPCAM+ cells 24h after cisplatin/5FU administration (box boundaries represent 25th and 75th percentiles; whiskers, minimum and maximum; centre line, median, Kruskal-Wallis test followed by two-sided Mann Whitney tests, n represents the numbers of replicates from 2 independent cell lines). e, Relative cell number as compared to day 0 in control EPCAM and Rhoj shRNA knockdown cells cultured in vitro and quantified by crystal violet assay (Medians and range are shown, two-sided Mann-Whitney U-test, n represents replicates of three biological replicates). f-g, Cell Migration. Representative images (f) and quantification (g) of cell migration following scratch-wound assay in EPCAM control and Rhoj shRNA knockdown cells (scale bar, 500μm; data represent the percentage of wound closure, medians with range are shown, two-sided Mann-Whitney U-test, n  = 6 biological replicates, 3–4 pictures per well). h, mRNA expression of selected epithelial and EMT markers quantified by qRT-PCR in EPCAM control cells, Rhoj shRNA knockdown cells, EPCAM+ control cells and Rhoj overexpressing cells (data are normalized using housekeeping gene TBP. Bars represent mean± SD, n represents the number of independent primary cell lines). Source data
Extended Data Fig. 3
Extended Data Fig. 3. RHOJ overexpression in EPCAM+ tumour cells in vitro and RHOJ deletion in tumour cells in vivo impair cell proliferation.
a-b, HA-tagged RHOJ expression measured by western blotting (a) and immunofluorescence (b) validating the overexpression (OE) of RHOJ in EPCAM+ cells as compared to control empty vector transduced EPCAM+ cells. Molecular weights (kDa) are indicated on the left side of the blots (n = 3 biological replicates; scale bar, 20μm). c, Relative cell number of YFP+ EPCAM+ control and RHOJ OE cells quantified by crystal violet assay (Medians and range are shown, two-sided Mann-Whitney U-test, n represents duplicates of two biological replicates). d, Scheme of the genetic strategy to induce KrasG12D and YFP expression, Trp53 and Rhoj deletion in the mouse model of skin SCCs. e, PCR analysis of Cre expression and Rhoj floxed allele recombination in Lgr5creERKrasG12DTrp53cKORosa-YFP mice (n = 3), Lgr5creERKrasG12DTrp53cKORhojcKORosa-YFP (Rhoj KO) mice (n = 3) and Rhoj KO tumours (n = 3) confirming the deletion of the floxed alleles in Rhoj-KO SCCs arising after tamoxifen administration. f, Hematoxylin and Eosin staining of WT and Rhoj-KO SCCs. (Scale bar, 50μm; n = 15 SCCs). g, Co-immunostaining of YFP (tumour cells), K14 and Ki67 (proliferating cells) in epithelial and mesenchymal part of Rhoj WT and Rhoj-KO SCCs (Scale bar, 100 μm). h, Quantification of the percentage of proliferating cells in epithelial (YFP+K14+) and mesenchymal (YFP+K14-) tumour cells from Rhoj-WT and Rhoj-KO SCCs (n = 7 independent tumour samples, Kruskal-Wallis test followed by two-sided Mann-Whitney U-tests, p-values adjusted by Bonferroni correction; box boundaries represent 25th and 75th percentiles; whiskers, minimum and maximum; centre line, median). i, Co-Immunostaining of active caspase-3 and YFP in primary tumours from WT and Rhoj-KO SCCs treated with cisplatin/5FU for 24h (n = 5; scale bar, 20μm). Source data
Extended Data Fig. 4
Extended Data Fig. 4. RHOJ mediates resistance to chemotherapy associated with EMT in human cancer cells.
a, qRT-PCR of Rhoj and Rhoq expression validating the specific downregulation of Rhoj after shRNA knockdown (Rhoj sh) in human breast cancer cell line MDA-MB-231 as compared to control cells. (n = 3 independent experiments, data are normalized using housekeeping gene Polr2a; Control shRNA (Control) is an empty shRNA vector). b, Relative cell number as compared to day 0 in MDA-MB-231 control and RhoJ shRNA knockdown cultured cells in vitro and quantified by performing crystal violet assay (Medians and range are shown, two-sided Mann-Whitney U-test, n represents triplicates from two biological replicates). c-d, Representative images (c) and cell survival analysis (d) after 48h of treatment with 8, 16, 24 μM cisplatin; 30, 100, 300 nM paclitaxel; 250, 500, 700 nM doxorubicin of MDA-MB-231 control cells and Rhoj shRNA knockdown (scale bar, 500 μm; box boundaries represent 25th and 75th percentiles; whiskers, minimum and maximum; centre line, median, two-sided Mann-Whitney U-test, n represents replicates from two biological replicates).
Extended Data Fig. 5
Extended Data Fig. 5. Transcriptomic and proteomic characterization of EMT tumour cells after Rhoj deletion.
a, b, mRNA expression of genes upregulated (a) or downregulated (b) in EPCAM Control shRNA compared to EPCAM Rhoj sh KD measured by RNA seq. (Means are shown, n = 2 independent primary cultured cell lines). c,d, Gene Ontology analysis of genes that are upregulated (c) or downregulated (d) in EPCAM control cells compared to Rhoj Sh KD EPCAM cells (c), showing categories of genes that are significantly enriched. e-f, Gene Ontology analysis corresponding to the proteins significantly upregulated in EPCAM WT and EPCAM Control sh (e) and in EPCAM+ and EPCAM Rhoj sh (f). p value is calculated according to the Benjamini–Hochberg method for multiple hypothesis testing. g, Immunofluorescence of Phalloidin (red) in EPCAM+, EPCAM and EPCAM Rhoj KO cells. Nuclei are counterstained with DAPI (blue) (n = 3 biological replicates; scale bar, 20μm). h-k, Western blot showing the expression of POLD (h), PCNA (i), phospho-RPA2 (S4/8), total RPA2 (j) and N-WASP (k) in EPCAM+, EPCAM and Rhoj KO cells. Tubulin or β-Actin loading controls (n = 2, molecular weights (kDa) are indicated to the right side of the blots). l, mRNA expression of EMT transcription factors measured by RNA-sequencing in EPCAM control cells compared to EPCAM Rhoj sh KD cells (Means are shown, n represents the number of independent primary cell lines). m, Protein expression of selected epithelial and EMT markers in EPCAM+, EPCAM WT, EPCAM Control sh, EPCAM Rhoj sh cells untreated and treated for 24h with cisplatin/5FU (n represents the number of technical replicates, Means + S.D. are shown). Source data
Extended Data Fig. 6
Extended Data Fig. 6. RHOJ promotes DNA repair in EMT tumour cells independently of ATM and ATR.
a, Western blot analysis of phospho-ATM/ATR substrates (S*Q) in EPCAM+, EPCAM and EPCAM Rhoj KO cells untreated, treated with cisplatin/5FU for 8 h and treated with cisplatin/5FU for 8 h followed by 16 h of ATM inhibitor (KU60019, 5μM) or ATR inhibitor (VE-821, 1μM) or a combination of ATM and ATR inhibitor showing the specific decrease in the level of phosphorylated ATM/ ATR substrates upon combination of their respective inhibitors with chemotherapy (n = 2 independent experiments, β-Actin loading control, molecular weights (kDa) are indicated to the right side of the blots). b, c, FACS quantification of the percentage of activated caspase-3 positive cells treated with cisplatin/5FU for 8h followed by treatment with ATR inhibitor (b) or ATM inhibitor (c) for 16h. Top panel shows drug treatment scheme. (two-sided Mann-Whitney U-test, n represents the number of replicates using 4 different primary cultured cell lines, box boundaries represent 25th and 75th percentiles; whiskers, minimum and maximum; centre line, median). d, e, Representative immunofluorescence (d), and FACS plots (e) of the cells expressing γH2AX in EPCAM+, EPCAM and EPCAM Rhoj KO cells, 12h and 24h after cisplatin/5FU administration. (n = 3 independent primary cultured cell lines; scale bar, 10μm). f, Representative immunofluorescence and quantification of 53BP1, RPA2 and RAD51 focus formation (in red) in EPCAM+, EPCAM and EPCAM Rhoj KO cells treated with cisplatin for 12h and 24h. (Scale bar, 10μm. Medians (IQR) are shown, Kruskal-Wallis test, p-values adjusted for multiple comparisons by Bonferroni correction, n represents the number of analysed nuclei from two independent primary cultured cell lines and experiments).
Extended Data Fig. 7
Extended Data Fig. 7. RHOJ promotes tolerance to replicative stress in EMT tumour cells following chemotherapy.
a, Immunofluorescence of EdU incorporation (green) in EPCAM+, EPCAM and EPCAM Rhoj KO cells treated with cisplatin/5FU for 12 and 24h. EdU pulse is given 30 min before sampling. Nuclei are counterstained with DAPI (blue) (Scale bar, 25μm). b, EdU intensity measured with Cell profiler software in EPCAM+, EPCAM and EPCAM Rhoj KO cells treated with cisplatin/5FU for 12 and 24h. (n represents the number of nuclei analysed from 2 independent experiments ; a.u., arbitrary unit, Medians are shown, Kruskal-Wallis test) c-f, Western blot of p-CDK1 at Y15 (c), at Thr161 and total CDK1 (d), p-CDK2 at Thr160 and total CDK2 (e), p-CDK4 at Thr172, total CDK4 and CDK6 (f) and corresponding β-Actin in EPCAM+, EPCAM and Rhoj KO cells exposed to cisplatin/5FU treatment showing the differential activation of the CDKs in response to chemotherapy in the different tumour cell types. Activation of CDK1 was observed in EPCAM cells as shown by transient level of inhibitory phosphorylation and earlier appearance of activating phosphorylation of CDK1 in response to chemotherapy as compared to EPCAM+ and Rhoj KO Epcam- cells. Same levels of activating CDK2 phosphorylation was found in all cell types and sustained activating CDK4 phosphorylation was observed in EPCAM cells 12h after chemotherapy compared to EPCAM+ and Rhoj KO EPCAM cells suggesting that EPCAM cells are allowed to progress in the cell cycle following chemotherapy. Molecular weights (kDa) are indicated on the right side of the blots (n = 2). g, FACS quantification of the percentage of activated caspase-3 positive cells in YFP+ EPCAM+, EPCAM and EPCAM Rhoj KO in response to 24h aphidicolin (50μM) and cisplatin/5FU. h, FACS quantification of the percentage of activated caspase-3 positive cells in response to 24h combination of cisplatin/5FU with MRE11 inhibitor (Mirin 50μM). Lower panel shows drug treatment scheme. (n represents the number of independent primary cultured cell lines). In g and h, Kruskal-Wallis test followed by Mann-Whitney U-tests. p-values adjusted for multiple comparisons by Bonferroni correction, box boundaries represent 25th and 75th percentiles; whiskers, minimum and maximum; centre line, median.
Extended Data Fig. 8
Extended Data Fig. 8. Replicative stress in EMT tumour cells is associated with the activation of dormant origins in a RHOJ-dependent manner that prevents micronuclei formation.
a-b, Representative images (a) and quantification (b) of micronuclei in EPCAM+, EPCAM and EPCAM Rhoj KO cells untreated and treated with cisplatin/5FU for 12 and 24h. Nuclei are stained with DAPI. Yellow arrowheads indicate micronuclei (a) (Scale bar, 25μm, n represents the number of nuclei pooled from five independent experiments, Kruskal-Wallis test followed by two-sided Mann-Whitney paired comparisons tests. p-values adjusted for multiple comparisons by Bonferroni correction, box boundaries represent 25th and 75th percentiles; whiskers, minimum and maximum; centre line, median). c-d, Representative images (c) and quantification (d) of fork asymmetry to measure fork stalling inEPCAM+, EPCAM and EPCAM Rhoj KO cells untreated and treated with cisplatin/5FU for 12 h. The degree of symmetry around the replication origin was calculated as long/short fork ratio (100 individual forks were measured for each cell line in three replicates, medians with interquartile range are shown, ANOVA with condition, experience and their interaction, p-values after two-way post-hoc Sidak tests). e, Western blot analysis of the indicated replication factors and loading control in the whole cell extract and loaded on chromatin in untreated conditions and 12h after cisplatin/5FU administration (n = 2, molecular weights (kDa) are indicated on the right side of the blots).
Extended Data Fig. 9
Extended Data Fig. 9. Patterns of nuclear actin filaments in response to chemotherapy, RHOJ deletion and actin polymerization inhibitor.
a, Representative images of EPCAM cells transfected with HA-tagged RHOJ untreated and 12h after cisplatin/5FU treatment. Maximum intensity projections are shown (n = 3 biological replicates; anti-HA in red; nuclei are counterstained with DAPI in green; scale bar, 20μm) (top). Corresponding colocalization map of the overlap between HA-tagged RHOJ and DAPI signals showing peri- and intra- nuclear localization of RHOJ. Global intersection coefficient is represented (bottom). b, Representative images of the different nuclear actin patterns found in EPCAM+, EPCAM and EPCAM Rhoj KO cells expressing nuclear actin chromobody-GFP treated with cisplatin/5FU and a combination of cisplatin/5FU + Latrunculin B (LatB, 400nM) or SMIFH2 (50 µM) for 12h. Nuclei are counterstained with DAPI (blue) (n = 3; scale bar, 10μm). c, Quantification of nuclear actin patterns in EPCAM+, EPCAM and EPCAM Rhoj KO cells treated with cisplatin/5FU and a combination of cisplatin/5FU + Latrunculin B or SMIFH2 for 12h (Means are shown, n represents the number of independent primary cultured cell lines). Several classes of nuclear actin filaments are observed (b). Pattern 1, thin, short and branched filaments, is found in all cell types as shown in panel highlighted by a purple border ; pattern 2, elongated filaments, is mainly induced in EPCAM cells upon chemotherapy treatment as shown in panel highlighted by an orange border; pattern 3, hairy filaments which are short filaments with a dense and multipolar organization, is detected in EPCAM Rhoj KO cells, as shown in panel highlighted by a blue border; pattern 4, thick and twisted actin filaments as shown in panel highlighted by a yellow border and pattern 5, severe disruption of actin filaments as shown in panel highlighted by a green border, are found when chemotherapy was combined with F-actin inhibitors.
Extended Data Fig. 10
Extended Data Fig. 10. Nuclear actin filament formation occurs in replicative cells and participates in DNA repair and cell survival in response to chemotherapy.
a-b, Representative immunofluorescence of phospho-histone H3 (p-H3) (red) and EdU (white) in EPCAM (a) and EPCAM Rhoj KO (b) cells expressing nuclear actin chromobody-GFP treated with cisplatin/5FU or a combination of cisplatin/5FU and Latrunculin B for 12h compared to untreated conditions. Nuclei are counterstained with DAPI (blue). Arrowhead indicates a nucleus presenting co-localization of nuclear actin filament and EdU (Scale bar, 10μm). c, Quantification of EdU positive/ p-H3 negative cells in EPCAM and EPCAM Rhoj KO tumour cells presenting nuclear actin filaments of (a) and (b) (>100 cells counted per condition; n represents the number of replicates from 2 independent cell lines, medians are shown, two-sided Mann-Whitney U-tests). d, Quantification of the proportion of each nuclear actin patterns in EPCAM and EPCAM Rhoj KO cells presenting nuclear actin filaments of (a) and (b) (Means are shown). e, FACS quantification of the percentage of activated caspase-3 positive cells in EPCAM+, EPCAM and EPCAM Rhoj KO in response to Latrunculin B or SMIFH2 for 24h. (Medians are shown, Kruskal-Wallis test, n represents the number of independent primary cultured cell lines). f, Quantification of RPA2 foci in EPCAM cells treated with a combination of cisplatin/5FU with Latrunculin B or SMIFH2 inhibitor for 12h. (Medians are shown, Kruskal-Wallis test, p-values adjusted for multiple comparisons by Bonferroni correction, n represents the number of analysed nuclei pooled from two independent primary cultured cell lines). g, FACS quantification of the percentage of activated caspase-3 positive cells in EPCAM tumour cells in response to cisplatin/5FU combined with ARP2/3 inhibitor (CK666, 50 µM) or N-WASP inhibitor (Wiskostatin, 5 µM) for 24h (box boundaries represent 25th and 75th percentiles; whiskers, minimum and maximum; centre line, median; n represents the number of replicates from 3 independent cell lines, Kruskal-Wallis test followed by two- sided Mann Whitney tests). For gel source data, see Supplementary Figure 1 and 2.

Comment in

References

    1. Zaorsky NG, et al. Causes of death among cancer patients. Ann. Oncol. 2017;28:400–407. doi: 10.1093/annonc/mdw604. - DOI - PMC - PubMed
    1. Brabletz T, Kalluri R, Nieto MA, Weinberg RA. EMT in cancer. Nat. Rev. Cancer. 2018;18:128–134. doi: 10.1038/nrc.2017.118. - DOI - PubMed
    1. Shibue T, Weinberg RA. EMT, CSCs, and drug resistance: the mechanistic link and clinical implications. Nat. Rev. Clin. Oncol. 2017;14:611–629. doi: 10.1038/nrclinonc.2017.44. - DOI - PMC - PubMed
    1. Nieto MA, Huang RY, Jackson RA, Thiery JP. EMT: 2016. Cell. 2016;166:21–45. doi: 10.1016/j.cell.2016.06.028. - DOI - PubMed
    1. Puisieux A, Brabletz T, Caramel J. Oncogenic roles of EMT-inducing transcription factors. Nat. Cell Biol. 2014;16:488–494. doi: 10.1038/ncb2976. - DOI - PubMed

Publication types

MeSH terms