. 2023 May;617(7959):147-153.
doi: 10.1038/s41586-023-05820-3. Epub 2023 Mar 22.

RBFOX2 modulates a metastatic signature of alternative splicing in pancreatic cancer

Affiliations

RBFOX2 modulates a metastatic signature of alternative splicing in pancreatic cancer

Amina Jbara et al. Nature. 2023 May.

Abstract

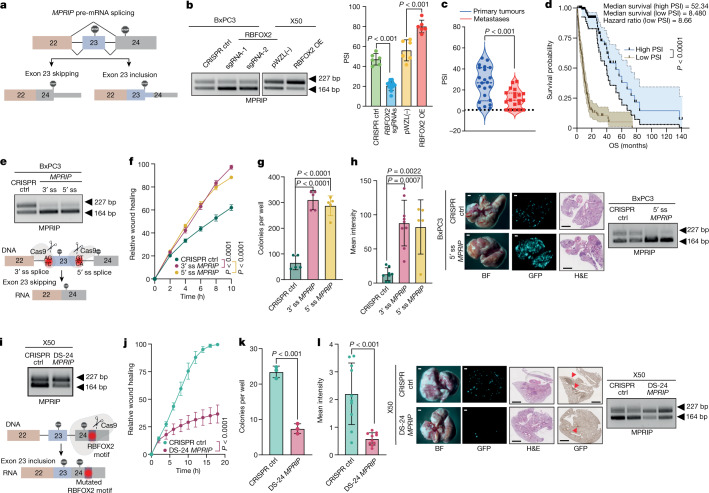
Pancreatic ductal adenocarcinoma (PDA) is characterized by aggressive local invasion and metastatic spread, leading to high lethality. Although driver gene mutations during PDA progression are conserved, no specific mutation is correlated with the dissemination of metastases1-3. Here we analysed RNA splicing data of a large cohort of primary and metastatic PDA tumours to identify differentially spliced events that correlate with PDA progression. De novo motif analysis of these events detected enrichment of motifs with high similarity to the RBFOX2 motif. Overexpression of RBFOX2 in a patient-derived xenograft (PDX) metastatic PDA cell line drastically reduced the metastatic potential of these cells in vitro and in vivo, whereas depletion of RBFOX2 in primary pancreatic tumour cell lines increased the metastatic potential of these cells. These findings support the role of RBFOX2 as a potent metastatic suppressor in PDA. RNA-sequencing and splicing analysis of RBFOX2 target genes revealed enrichment of genes in the RHO GTPase pathways, suggesting a role of RBFOX2 splicing activity in cytoskeletal organization and focal adhesion formation. Modulation of RBFOX2-regulated splicing events, such as via myosin phosphatase RHO-interacting protein (MPRIP), is associated with PDA metastases, altered cytoskeletal organization and the induction of focal adhesion formation. Our results implicate the splicing-regulatory function of RBFOX2 as a tumour suppressor in PDA and suggest a therapeutic approach for metastatic PDA.


Conflict of interest statement

The authors declare no competing interests.

Figures

Fig. 1
Fig. 1. The alternative splicing landscape of PDA.
a, PCA of alternative splicing events in 395 samples from patients with pancreatic cancer, computed by PSI scores. Blue dots represent primary tumour samples, and red dots represent metastatic tumour samples. The inset shows a PCA analysis of a subset of samples whose clinical annotation (either primary or metastatic) matched their respective cluster. b, Unsupervised clustering of 249 PDA patient samples based on the top 20 differentially spliced events (PSI). Asterisks indicate different splice events for the same gene. Mutation status, clinical stage and overall survival (OS) are also shown. Max, maximum; min, minimum; mut, mutant; WT, wild type; NA, not available. c, Reactome pathway analysis of the significant differentially spliced genes between primary tumours and metastatic tumours. Genes entered into the analysis had an imposed cut-off (|ΔPSI| > 10%) and a nominal P value (P < 0.05, over-representation analysis (hypergeometric distribution) test). Gene sets were limited to between 5 and 500 genes, and pathways were filtered for a statistical threshold of P < 0.05. d, The top two enriched motifs identified in the differentially spliced genes involved in the RHO GTPase pathway,. e, Immunoblot analysis of RBFOX2 in representative primary and PDX metastatic pancreatic tumours. Tubulin and total MEK1 (t-MEK1) serve as loading controls (n = 4 patient samples for each group). Gel source data are provided in Supplementary Fig. 1. f, Quantification of RBFOX2 protein relative to tubulin (n = 4 patient samples per group; data are mean ± s.d.) in primary and metastatic tumours. g, Quantitative PCR with reverse transcription (RT–qPCR) analysis of RBFOX2 expression in primary tumours and metastases from patients with PDA (n = 15 patient samples for each group; data are mean ± s.d.). f,g, Two-tailed Student’s t-test. NS, not significant. Genetic alterations and clinical data of patients with PDA are shown in Supplementary Table 1; differentially spliced events in PDA patient samples are shown in Supplementary Table 2; sequence motif enrichment analysis is shown in Supplementary Table 3; reactome analysis is shown in Supplementary Table 4. Source data
Fig. 2
Fig. 2. RBFOX2 acts as a metastatic tumour suppressor in pancreatic cancer progression.
a, Immunoblot analysis of X50 cells transduced with pWZL(−) (empty vector control) or RBFOX2 cDNA (RBFOX2 overexpression (OE)) (left), BxPC3 cells transduced with CRISPR control (ctrl), RBFOX2 sgRNA-1 or RBFOX2 sgRNA-2 (second from left), CRISPR control or RBFOX2-specific sgRNA targeting the RBFOX2 exon–intron junction (EIJ) (third from left), and these cells transduced again with pWZL(−) or RBFOX2 cDNA (right). b,c, Wound healing assay (b) and colony formation in soft agar assay (c) of X50 cells in a, left. d, Left, quantification of lung metastases in NOD-SCID mice injected intravenously with mCherry-labelled X50 cells expressing either pWZL(–) or RBFOX2 OE (n = 10 mice per group). Right, representative images of the lungs visualized by bright-field (BF) (top) and fluorescence (bottom) microscopy. Scale bars, 1,000 µm. e,f, Wound healing assay (e) and colony formation in soft agar assay (f) of cells described in a, second from left. g, Left, quantification of lung metastases in NOD-SCID mice injected intravenously with GFP-labelled BxPC3 cells expressing CRISPR control, RBFOX2 sgRNA-1 or RBFOX2 sgRNA-2 (n = 9 mice per group). Right, representative images of the lungs visualized by bright-field (top) and fluorescence (bottom) microscopy. Scale bars, 1,000 µm. h,i, Wound healing assay (h) and colony formation in soft agar assay (i) of cells described in a, third from left and a, right. j, Immunoblot analysis of BxPC3 cells expressing RBFOX2 EIJ sgRNA transduced with SFFV2(−) (empty vector control) or RBFOX2(ΔRRM) (left) and X50 cells transduced with lentiviruses encoding either SFFV2(−) or RBFOX2(ΔRRM) (right). k,l, Wound healing assay (k) and colony formation in soft agar assay (l) of cells in j, left. m,n, Wound healing assay (m) and colony formation in soft agar assay (n) of cells in j, right. Gel source data in a,j are provided in Supplementary Fig. 2. Data are mean ± s.d. In all panels, n ≥ 3 independent experiments, exact P values are shown. Two-way ANOVA (b,e,f,h,i,k,m) or unpaired two-tailed Student’s t-test (c,d,g,l,n). Source data
Fig. 3
Fig. 3. RBFOX2 regulates splicing events in pancreatic cancer progression.
a, Venn diagram showing the overlap of differentially spliced events, with reciprocal splicing. Two comparisons are shown: X50 cells with RBFOX2 OE versus BxPC3 cells expressing RBFOX2 sgRNA-1, and X50 cells with RBFOX2 OE versus BxPC3 cells expressing RBFOX2 sgRNA-2. b, ΔPSI of the reciprocal splicing events described in a. The doughnut chart shows the distribution of the types of alternatively spliced events: single-exon skipping (SES), alternative 5′ splice site (alt 5′ ss), alternative 3′ splice site (alt 3′ ss), mutually exclusive exon (MXE), multiple exon skipping (MES) and intron retention (IR). P values were calculated using PSI-sigma bioinformatic analysis (nominal P value < 0.05 and |ΔPSI| > 10%) (details in Methods). c, Reactome pathway analysis for 114 shared events identified in a. Genes included in the analysis had imposed cut-offs, as described in Methods. Pathways were filtered for a statistical threshold of P < 0.05 using an over-representation analysis (hypergeometric distribution) test. d, Wound healing assay of BxPC3 RBFOX2 sgRNA-1 cells treated with either MBQ167 (0.05 µM) or DMSO. e, Proliferation assay of cells in d. f, Trypan blue cell count of cells described in d 24 h after treatment. g, Left, mean GFP intensity in lungs from NOD-SCID mice injected intravenously with GFP-labelled BxPC3 RBFOX2 sgRNA-1 cells treated with either vehicle or MBQ167 (3 mg per kg) (n = 7 mice per group). Right, representative images of the lungs visualized by bright-field (top) and fluorescence (middle) microscopy, and haematoxylin and eosin (H&E) staining (bottom). Scale bars, 1,000 µm. Full data are shown in Supplementary Fig. 12. h, Weight of mice during the experiment in g. Data are mean ± s.d. In all panels, n ≥ 3 independent experiments. Exact P values are shown. Unpaired two-tailed Student’s t-test (f), two-way ANOVA (d,e,h) or unpaired one-tailed Student’s t-test (g). Reactome analysis is provided in Supplementary Table 4 and differentially spliced events in RBFOX2 manipulated cell lines are listed in Supplementary Table 6. Source data
Fig. 4
Fig. 4. Modulation of MPRIP splicing regulates the metastatic potential of pancreatic tumour cells.
a, Scheme of RBFOX2-mediated MPRIP splicing. b, PCR with reverse transcription (RT–PCR) and quantification of MPRIP PSI values in BxPC3 cells expressing CRISPR control, RBFOX2 sgRNA-1 or RBFOX2 sgRNA-2, and X50 cells expressing pWZL(−) or RBFOX2 OE. c, Violin plot of MPRIP PSI values in samples from patients with pancreatic cancer (n = 22 primary tumours and n = 20 metastases), analysed using LabChip GX. d, Kaplan–Meier curves for overall survival and MPRIP PSI values from the PanCurX dataset. e, Bottom, scheme showing modulation of MPRIP splicing (skipping). Top, RT–PCR analysis of MPRIP splicing in BxPC3 cells transduced with MPRIP sgRNA. f,g, Wound healing assay (f) and colony formation in soft agar assay (g) of cells in e. h, Left, mean GFP intensity in lungs from NOD-SCID mice injected intravenously with GFP-labelled BxPC3 cells expressing MPRIP sgRNA (n = 8 mice per group for CRISPR control and 3′ splice site MPRIP sgRNA, n = 5 mice per group for 5′ splice site MPRIP sgRNA). Centre, representative images of lungs visualized by visualized by bright-field (left) and fluorescence (middle) microscopy, and haematoxylin and eosin staining (right) (scale bars, 1,000 µm). Right, RT–PCR analysis of RNA from two lungs from each group (right) from a repeated in vivo experiment (n = 4 mice for CRISPR control and n = 5 mice for 5′ splice site MPRIP sgRNA). i, Bottom, scheme of MPRIP splicing (inclusion) (bottom). Top, RT–PCR showing MPRIP splicing in X50 cells transduced with DS-24 MPRIP sgRNA. j,k, Wound healing assay (j) and colony formation in soft agar assay (k) of cells in i. l, Left, mean GFP intensity in lungs from NOD-SCID mice injected intravenously with GFP-labelled X50 metastatic cells expressing either CRISPR control or DS-24 MPRIP sgRNA (n = 10 mice per group). Centre, representative images of lungs. Scale bars, 1,000 µm. Right, RT–PCR analysis of RNA from two lungs from each group. Gel source data, images of the lungs and H&E staining are provided in Supplementary Figs. 3, 13 and 14. Data are mean ± s.d. In all panels, n ≥ 3 independent experiments. Exact P values are shown. Unpaired two-tailed Student’s t-test (b,c,h,k,l), log-rank (Mantel–Cox) test (d) and two-way ANOVA (f,g,j). The schemes in a,e,i were created with Biorender.com. Source data
Extended Data Fig. 1
Extended Data Fig. 1. PCA analysis of splicing and gene expression changes in pancreatic cancer patient samples based on driver mutation status, stage, and tumor site.
ae. PCA analysis of alternative splicing events in 395 pancreatic cancer patient samples computed by PSI scores. Each color-coded point represents a sample based on: KRAS mutation status (blue: wild-type, red: mutant, black: data not available) (a); SMAD4 mutation status (blue: wild-type, red: mutant, black: data not available) (b); CDKN2A mutation status (blue: wild-type, red: mutant, black: data not available) (c); TP53 mutation status (blue: wild-type, red: mutant, black: data not available) (d); and clinical tumor stage (e). f. PCA analysis of alternative splicing in 166 metastatic pancreatic cancer patient samples, computed by PSI scores. Each color-coded point represents a sample based on the location of the metastasis. Adrenal gland (Ag), heart (Hr), lymph node (Ln), lung (Lu), liver (Lv), omentum (Om), and peritoneum (Pm). g. PCA analysis of gene expression in 155 pancreatic cancer patient samples. Each color-coded point represents a sample according to its tumor origin; red: primary, blue: metastasis. h. Unsupervised clustering of gene expression in 155 PDA patient samples, based on the top 20 differentially spliced events (PSI) (18 genes) that were identified in Fig. 1b. Supplementary Tables 1-2 and 5. Source data
Extended Data Fig. 2
Extended Data Fig. 2. Motif enrichment and Reactome analysis of differentially spliced events identified in the primary versus metastatic PDA patient samples.
a. Top 5 enriched motifs identified in the 5′ ss of the differentially spliced events shown in Supplementary Table 3. b. The intersection of RBFOX2 known targets and differentially spliced genes obtained from the comparisons in Supplementary Table 7. Statistical analysis was performed using Normal approximation test, and the exact p-values are shown. Reactome pathway analysis of the intersection of the differentially spliced genes with known RBFOX2 targets (bottom). Supplementary Table 4. Gene sets were limited to between 5 and 500 genes, and pathways were filtered for a statistical threshold of P < 0.05 using over-representation analysis (hypergeometric distribution) test.
Extended Data Fig. 3
Extended Data Fig. 3. Decreased RBFOX2 protein levels in PDA patient metastatic samples.
a. Immunoblot analysis of representative primary and metastatic (PDX) pancreatic tumors. Total ERK (t-ERK) and actin serve as loading controls. Gel source data is provided in Supplementary Fig. 4. b. Quantification of immunoblot analysis of primary and metastatic (PDX) pancreatic tumors. n = 4 primary tumors, n = 11 metastases. Actin was used for normalization. Data are mean ± SD. Statistical analysis was performed using unpaired two-tailed Student’s t-test; exact p-values are shown. c. RT-qPCR of RBFOX2 mRNA in BxPC3 primary tumor cells and X50 metastatic cells treated with actinomycin D (10 µg/ml) at different time points after treatment. d. Quantification of protein levels of RBFOX2 in BxPC3 primary tumor cells and X50 metastatic cells after treatment with cycloheximide (10 µg/ml) at different time points after treatment. n = 3 independent experiments (c, d). Statistical analysis was performed using non-linear regression (one phase decay) (c, d). Source data
Extended Data Fig. 4
Extended Data Fig. 4. RBFOX2 acts as a metastatic tumor suppressor in pancreatic cancer progression.
a. Immunoblot analysis of metastatic cell line X139 (PDX-derived) transduced with either empty vector pWZL(−) or RBFOX2 (OE RBFOX2). b. Quantification of wound healing assay of cells described in (a). c. Proliferation assay of cells described in (a). d. Proliferation assay of metastatic cell line X50 (PDX-derived) transduced with retroviruses expressing either empty vector pWZL(−) or RBFOX2 cDNA (OE RBFOX2). e. Tumor volumes of tumors formed in NOD-SCID mice injected subcutaneously with X50 cells described in (a) (n = 5 mice per group, 2 tumors/mouse). f. Immunoblot analysis of primary pancreatic tumor cell line X252 transduced with lentivirus encoding either empty CRISPR vector (CRISPR Cont.) or two different RBFOX2 specific sgRNAs (sgRNA-1, sgRNA-2). g. Quantification of wound healing assay of cells described in (f). h. Proliferation assay of cells described in (f). i. Proliferation assay of primary tumor cell line BxPC3 transduced with lentiviruses encoding either empty CRISPR vector (CRISPR Cont.) or two different RBFOX2 specific sgRNAs (sgRNA-1, sgRNA-2). j. Tumor volumes of tumors formed in NOD-SCID mice injected subcutaneously with BxPC3 cells expressing either empty vector (CRISPR Cont.) or RBFOX2 specific sgRNA (sgRNA-1) (n = 7 mice per group, 2 tumors/mouse). k. Proliferation assay of primary tumor cell line BxPC3 transduced with lentiviruses encoding either empty CRISPR vector (CRISPR Cont.) or RBFOX2 specific sgRNA targeting endogenous RBFOX2 exon-intron junction (EIJ sgRNA) and BxPC3 cells with EIJ sgRNA transduced with retroviruses encoding either empty vector pWZL(−) or OE RBFOX2. l. Proliferation assay of RBFOX2 EIJ sgRNA-expressing BxPC3 cells (BxPC3 EIJ sgRNA) transduced with lentiviruses encoding either SFFV2(−) empty vector or ΔRRM RBFOX2. m. Proliferation assay of X50 cells transduced with lentiviruses encoding either SFFV2(−) empty vector or ΔRRM RBFOX2. Gel source data (h, k) are provided in Supplementary Fig. 5. Data are mean ± SD. For all panels n≥3 independent experiments, p-values are shown, n.s. non-significant. Statistical analysis was performed using unpaired two-tailed Student’s t-test (e, j) and two-way ANOVA test (b–d, g–i, k–m). Source data
Extended Data Fig. 5
Extended Data Fig. 5. RBFOX2 regulates alternative splicing events in pancreatic cancer progression.
a. Volcano plot showing delta PSI of splicing changes in metastatic cell line X50 (PDX-derived) transduced with empty vector pWZL(−) compared to cells transduced with OE RBFOX2 b. Volcano plot showing delta PSI of splicing changes in primary tumor cell line BxPC3 transduced with lentivirus encoding empty CRISPR vector (CRISPR Cont.) compared to cells transduced with RBFOX2 sgRNA-1. c. Volcano plot showing delta PSI of splicing changes in primary tumor cell line BxPC3 transduced with lentivirus encoding empty CRISPR vector (CRISPR Cont.) compared to cells transduced with RBFOX2 sgRNA-2. p-values were calculated using PSI-Sigma bioinformatic analysis (nominal p-value < 0.05 and |ΔPSI| > 10%) (a-c) (more details described in the methods section). d. Intersection of the differentially spliced genes that were identified in the patient’s samples from Supplementary Table 2 and the merged genes that were found in the comparison of X50 OE RBFOX2 versus BxPC3 sgRNAs (see Fig. 3a). Statistical analysis was performed using Normal approximation test, and the exact p-values are shown (top). Reactome pathway analysis of the intersection of differentially spliced genes (bottom). Gene sets were limited to between 5 and 500 genes, and pathways were filtered for a statistical threshold of p < 0.05 using over-representation analysis (hypergeometric distribution) test. e. Intersection of RBFOX2 known targets and the merged genes that were found in the comparison of X50 OE RBFOX2 versus BxPC3 sgRNAs (see Fig. 3a). Statistical analysis was performed using Normal approximation test, and the exact p-values are shown (top). Reactome pathway analysis of the intersection of differentially spliced genes (bottom). Gene sets were limited to between 5 and 500 genes, and pathways were filtered for a statistical threshold of P < 0.05 using over-representation analysis (hypergeometric distribution) test. f. Enriched motif identified in the 5′ ss of the differentially spliced events shown in Fig. 3b using XSTREME package (more details described in the methods section). Supplementary Tables 3-4 and 6-7.
Extended Data Fig. 6
Extended Data Fig. 6. Validation of RBFOX2 splicing targets.
RT-PCR and quantitation of alternative splicing of RBFOX2 targets in BxPC3 cells expressing RBFOX2 sgRNAs or X50 cells expressing OE RBFOX2 and their respective controls. Primers are specific to regions upstream and downstream of the alternatively spliced exons (Supplementary Table 11). The percent spliced-in (PSI) was quantified using the Image Lab platform. Data are mean ± SD. For all panels n = 3 independent experiments, exact p-values are shown. Statistical analysis was performed using unpaired two-tailed Student’s t-test. Gel source data is provided in Supplementary Fig. 6. Source data
Extended Data Fig. 7
Extended Data Fig. 7. RBFOX2 modulates cytoskeleton organization in pancreatic tumor cells.
a. Paxillin immunofluorescence (IF) of X50 cells expressing either empty vector pWZL (−) or OE RBFOX2. b. Paxillin IF of BxPC3 cells transduced with either CRISPR Cont. or RBFOX2 sgRNAs (sgRNA-1, sgRNA-2). c, d. Quantification of the IF (a and b, respectively). Data are mean ± SD. The exact p-values are shown. Statistical analysis was performed using unpaired two-tailed Student’s t-test. e. Paxillin IF of BxPC3 cells transduced with lentivirus encoding either empty CRISPR vector (CRISPR Cont.) or RBFOX2 specific sgRNA targeting RBFOX2 exon-intron junction (EIJ, which silences endogenous RBFOX2 but not exogenous RBFOX2 cDNA), and same cells transduced again with either empty vector pWZL(−) (EIJ Cont.) or RBFOX2 cDNA (EIJ OE RBFOX2). f. Paxillin IF of BxPC3 EIJ sgRNA cells transduced with either empty vector (SFFV2(−)) or ΔRRM RBFOX2 cDNA. g. Paxillin IF of X50 cells transduced with either empty vector (SFFV2(−)) or ΔRRM RBFOX2 cDNA. For all panels, paxillin: green, DAPI: blue. Scale bars, 20 μm. For all panels, n = 3 independent experiments. Source data
Extended Data Fig. 8
Extended Data Fig. 8. Modulation of Rho GTPase pathways reverse RBFOX2 knock-out effect on PDA cells.
a. Mean GFP intensity of lungs from NOD-SCID mice injected intravenously with GFP-labeled X50 cells treated with either vehicle or MBQ167 3 mg/Kg (n = 8 mice/group) (left). Representative pictures of the lungs visualized by fluorescent microscopy (scale bar 1000 µm) and H&E and GFP staining (scale bar 1 mm) (right). b. Weight of mice throughout the experiment described in (a). c. Tumor volumes of tumors formed in NOD-SCID mice injected subcutaneously with X50 cells and treated with either vehicle or MBQ167 3 mg/Kg (n = 5 mice/group) (left). Representative pictures of the tumors (right) (scale bar 1 cm). d. Weight of the mice throughout the experiment described in (c). e. Tumor volumes of tumors formed in NOD-SCID mice injected subcutaneously with BxPC3 cells and treated with either vehicle or MBQ167 3 mg/Kg (n = 5 mice/vehicle group, n = 4 mice/treated group) (left). Representative pictures of the tumors (right) (scale bar 1 cm). f. Weight of mice throughout the experiment described in (e). g. Quantification of the mean mCherry intensity of lungs from NOD-SCID mice injected intravenously with mCherry-labeled X50 cells treated with either vehicle (PBS) or Azathioprine 10 mg/Kg (n = 8 mice/group) (left). Representative pictures of the lungs were visualized by fluorescent microscopy (scale bar 1000 µm) (right). h. Weight of the mice throughout the experiment described in (g). i. Tumor volumes of tumors formed in NOD-SCID mice injected subcutaneously with X50 cells and treated with either vehicle (PBS) or Azathioprine 10 mg/Kg (n = 4 mice/vehicle group, n = 5 mice/treated group) (left). Representative pictures of the tumors (right) (scale bar 1 cm). j. Weight of the mice throughout the experiment described in (i). k. Tumor volumes of tumors formed in NOD-SCID mice injected subcutaneously with BxPC3 cells and treated with either vehicle (PBS) or Azathioprine 10 mg/Kg (n = 5 mice/vehicle group, n = 4 mice/treated group) (left). Representative pictures of the tumors (right) (scale bar 1 cm). l. Weight of mice throughout the experiment described in (k). m. Immunoblot analysis of BxPC3 cells with RBFOX2 sgRNA-1 transduced with either CRISPR Cont. or two different sgRNAs for Rac1. n. Quantification of wound healing assay of cells described in (m). o. Proliferation assay of cells described in (m). p. Mean GFP intensity of lungs from NOD-SCID mice injected intravenously with GFP-labeled BxPC3 cells with RBFOX2 sgRNA-1 transduced with either CRISPR Cont. or sgRNA-1 Rac1 (n = 9, n = 7 mice/group, respectively) (left). Representative pictures of the lungs, visualized by fluorescent microscopy and H&E staining (scale bar 1000 µm) (right). Data are mean ± SD. n≥3 independent experiments (n, o), exact p-values are shown, n.s. non-significant. Statistical analysis was performed using unpaired two-tailed Student’s t-test (a, g, and p) and two-way ANOVA test (b-f, h-l, and n-o). Gel source data, pictures of the lungs, and H&E staining are provided in Supplementary Figs. 7, 15, and 16. Source data
Extended Data Fig. 9
Extended Data Fig. 9. MPRIP alternative splicing isoforms alter the cytoskeleton organization of PDA cells.
a. Proliferation assay of MPRIP splicing changes in BxPC3 cells transduced with either CRISPR Cont. or 3′ and 5′ ss MPRIP sgRNAs. b. Proliferation assay of MPRIP splicing changes in X50 cells transduced with either CRISPR Cont. or RBFOX2 motif downstream MPRIP exon 24 sgRNA (DS-24 MPRIP sgRNA). c. IF of Paxillin in BxPC3 cells transduced with 3′ ss and 5′ ss MPRIP sgRNAs. d. IF of Paxillin in X50 cells transduced with RBFOX2 motif sgRNA (DS-24 MPRIP sgRNA). For (a, b) Paxillin: green, DAPI: blue. Scale bars, 20 μm. e. RT-PCR validation of MPRIP alternative splicing in X50 cells expressing either empty vector pWZL(−) or OE RBFOX2, and X50 cells with OE RBFOX2 transduced with lentiviruses encoding either CRISPR Cont. or 3′ ss MPRIP sgRNA or MPRIP, MYL6, and CLSTN1 3′ ss sgRNAs together. Gel source data is provided in Supplementary Fig. 8. f. Quantification of wound healing assay of cells described in (e). Data are mean ± SD. For all panels n≥3 independent experiments, exact p-values are shown, n.s. non-significant. Statistical analysis was performed using two-way ANOVA test (a-b and f). Source data
Extended Data Fig. 10
Extended Data Fig. 10. MPRIP exon 23 skipped isoform binds RAF/MAP kinase cascade proteins.
a. Summary of predicted kinases for different phosphorylation sites on each MPRIP isoform as predicted by serine-threonine kinome prediction tool. Supplementary Table 8. b. Structure analysis of the C-terminus of each MPRIP isoform as predicted by AlphaFold prediction tool. c. Volcano plot representation of the ratio of label-free quantitation (LFQ) intensities of the proteins pulled-down by MPRIP 23 skipped isoform compared to empty vector. d. Reactome pathway analysis of the proteins identified in (c). e. Volcano plot representation of the ratio of label-free quantitation (LFQ) intensities of the proteins pulled-down by MPRIP exon 23 included isoform compared to empty vector. f. Reactome pathway analysis of the proteins identified in (e). g. Volcano plot representation of the ratio of label-free quantitation (LFQ) intensities of the proteins pulled-down by MPRIP 23 skipped isoform compared to MPRIP exon 23 included isoform. p-value < 0.05 calculated using two-tailed Student’s t-test (Perseus statistical package) (c, e, g) (more details described in the methods section). Genes entered into Reactome analysis were identified with imposed cutoffs p-value < 0.05. Gene sets were limited to between 5 and 500 genes, and pathways were filtered for a statistical threshold of p < 0.05 using over-representation analysis (hypergeometric distribution) test. (d, f). Supplementary Table 9. h. Immunoblot of total lysate (top) and immunoprecipitation (bottom) of HEK293 cells transfected with either empty vector, FLAG-MPRIP exon 23 included isoform, or FLAG-MPRIP exon 23 skipped isoform with antibodies against A-Raf and FLAG. n = 3 independent experiments. Gel source data is provided in Supplementary Fig. 9.
Extended Data Fig. 11
Extended Data Fig. 11. Manipulation of alternative splicing of MYL6 enhances the metastatic potential of primary tumor pancreatic cells.
a. RT-PCR and quantification of MYL6 alternative splicing in BxPC3 cells expressing CRISPR Cont. or RBFOX2 sgRNA-1, 2 and X50 cells expressing pWZL (−) or OE RBFOX2. b. Violin plot of MYL6 PSI-values in PDA patient samples (n = 20 primary tumors, n = 24 metastases), analyzed using LabChip®GX microfluidics platform. c. Schematic representation of MYL6 splicing modulation (skipping) by CRISPR sgRNAs.(bottom). RT-PCR validation of MYL6 splicing changes in BxPC3 cells transduced with either CRISPR Cont. or 3′ and 5′ ss MYL6 sgRNAs (top). The diagram was created using BioRender.com. d. Quantification of wound healing assay of cells described in (c). e. RT-PCR validation of MYL6 alternative splicing in X50 cells expressing either empty vector pWZL(−) or OE RBFOX2, and X50 cells with OE RBFOX2 transduced with lentiviruses encoding either CRISPR Cont. or 3′ ss MYL6 sgRNA or MPRIP, MYL6 and CLSTN1 3′ ss sgRNAs together. f. Quantification of wound healing assay of cells described in (e). g. Mean GFP intensity of lungs from NOD-SCID mice injected intravenously with GFP-labeled BxPC3 cells expressing either CRISPR Cont. or 3′ ss MYL6 sgRNAs (n = 8 mice/group for CRISPR Cont. and 3′ ss MYL6 sgRNAs). Representative pictures of the lungs visualized by fluorescent microscopy (scale bar 1000 µm) and H&E staining (scale bar 1 mm) (right). RT-PCR of RNA from two representative lungs from each group (bottom). h. IF of Paxillin in BxPC3 cells transduced with 3′ ss and 5′ ss MYL6 sgRNAs. Paxillin: green, DAPI: blue. Scale bar 20 μm. Data are mean ± SD. For all panels n≥3 independent experiments, exact p-values are shown. Statistical analysis was performed using unpaired two-tailed Student’s t-test (a-b, g) and two-way ANOVA test (d, f). Gel source data, pictures of the lung, and H&E staining are provided in Supplementary Figs. 10 and 17. Source data
Extended Data Fig. 12
Extended Data Fig. 12. Manipulation of alternative splicing of CLSTN1 enhances the oncogenic potential of primary tumor pancreatic cells.
a. RT-PCR and quantification of CLSTN1 alternative splicing in BxPC3 cells expressing CRISPR Cont. or RBFOX2 sgRNA- 1, 2 and X50 cells expressing pWZL (−) or OE RBFOX2. b. Violin plot of CLSTN1 PSI-values in PDA patient samples (n = 22 primary tumors, n = 21 metastases), analyzed using LabChip®GX microfluidics platform. c. Schematic representation of CLSTN1 splicing modulation (skipping) by CRISPR sgRNAs. (bottom). RT-PCR validation of CLSTN1 splicing changes in BxPC3 cells transduced with either CRISPR Cont. or 3′ and 5′ ss CLSTN1 sgRNAs(top). The diagram was created using BioRender.com. d. Quantification of wound healing assay of cells described in (c). e. RT-PCR validation of CLSTN1 alternative splicing in X50 cells expressing either empty vector pWZL(−) or OE RBFOX2, and X50 cells with OE RBFOX2 transduced with lentiviruses encoding either CRISPR Cont. or 3′ ss CLSTN1 sgRNA or MPRIP, MYL6 and CLSTN1 3′ ss sgRNAs together. f. Quantification of wound healing assay of cells described in (e). g. Mean GFP intensity of lungs from NOD-SCID mice injected intravenously with GFP-labeled BxPC3 cells expressing either CRISPR Cont. or 3′ ss CLSTN1 sgRNAs (n = 9 mice/group for CRISPR Cont. and 3′ ss CLSTN1 sgRNAs). Representative pictures of the lungs visualized by fluorescent microscopy (scale bar 1000 µm) and H&E staining (scale bar 1 mm) (right). RT-PCR of RNA from two representative lungs from each group (bottom). h. IF of Paxillin in BxPC3 cells transduced with 3′ ss and 5′ ss CLSTN1 sgRNAs. Paxillin: green, DAPI: blue. Scale bar 20 μm. Data are mean ± SD. For all panels n≥3 independent experiments, exact p-values are shown, n.s. non-significant. Statistical analysis was performed using unpaired two-tailed Student’s t-test (a-b,g) and two-way ANOVA test (d, f). Gel source data, pictures of the lung, and H&E staining are provided in Supplementary Figs. 11 and 18. Source data

Comment in

References

    1. Connor AA, et al. Integration of genomic and transcriptional features in pancreatic cancer reveals increased cell cycle progression in metastases. Cancer Cell. 2019;35:267–282.e7. doi: 10.1016/j.ccell.2018.12.010. - DOI - PMC - PubMed
    1. Yachida S, et al. Distant metastasis occurs late during the genetic evolution of pancreatic cancer. Nature. 2010;467:1114–1117. doi: 10.1038/nature09515. - DOI - PMC - PubMed
    1. Makohon-Moore AP, et al. Limited heterogeneity of known driver gene mutations among the metastases of individual patients with pancreatic cancer. Nat. Genet. 2017;49:358–366. doi: 10.1038/ng.3764. - DOI - PMC - PubMed
    1. Jones S, et al. Core signaling pathways in human pancreatic cancers revealed by global genomic analyses. Science. 2008;321:1801–1806. doi: 10.1126/science.1164368. - DOI - PMC - PubMed
    1. Ryan DP, Hong TS, Bardeesy N. Pancreatic adenocarcinoma. N. Engl J. Med. 2014;371:1039–1049. doi: 10.1056/NEJMra1404198. - DOI - PubMed

Publication types

MeSH terms