. 2023 Apr;616(7957):606-614.
doi: 10.1038/s41586-023-05854-7. Epub 2023 Mar 22.

CFTR function, pathology and pharmacology at single-molecule resolution

Affiliations

CFTR function, pathology and pharmacology at single-molecule resolution

Jesper Levring et al. Nature. 2023 Apr.

Erratum in

Abstract

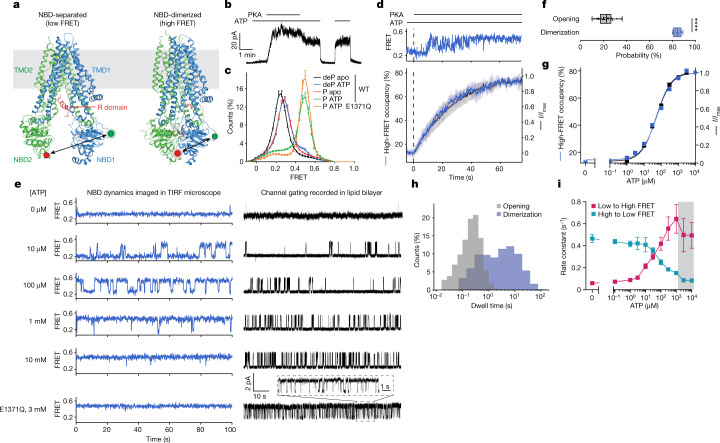
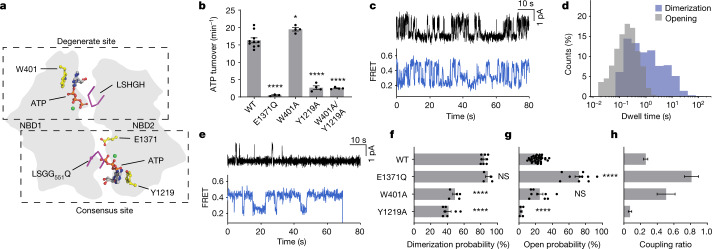
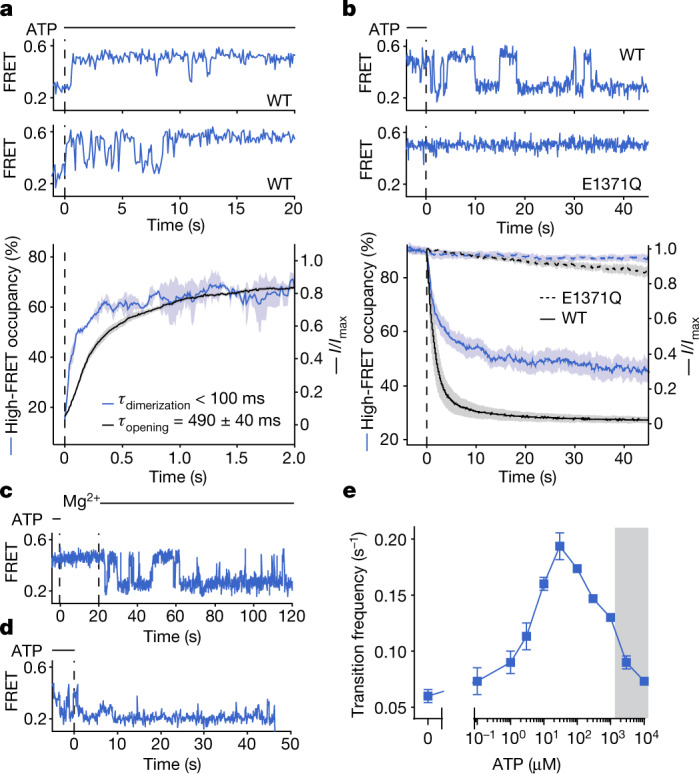
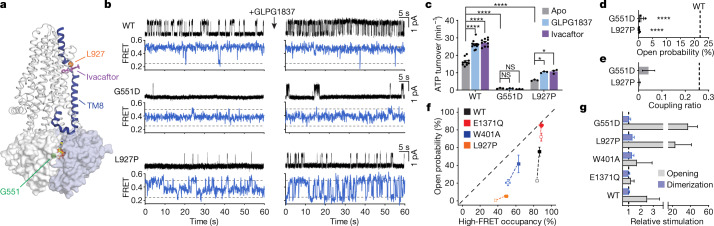
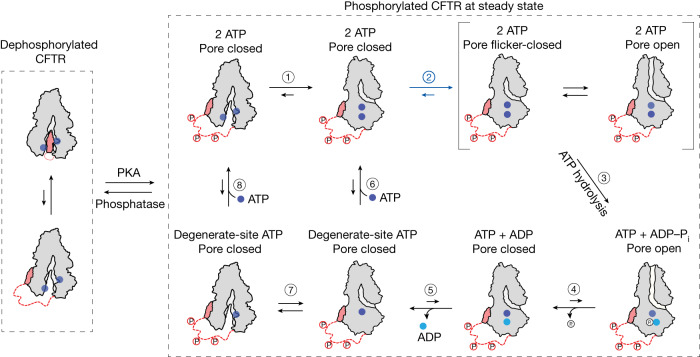
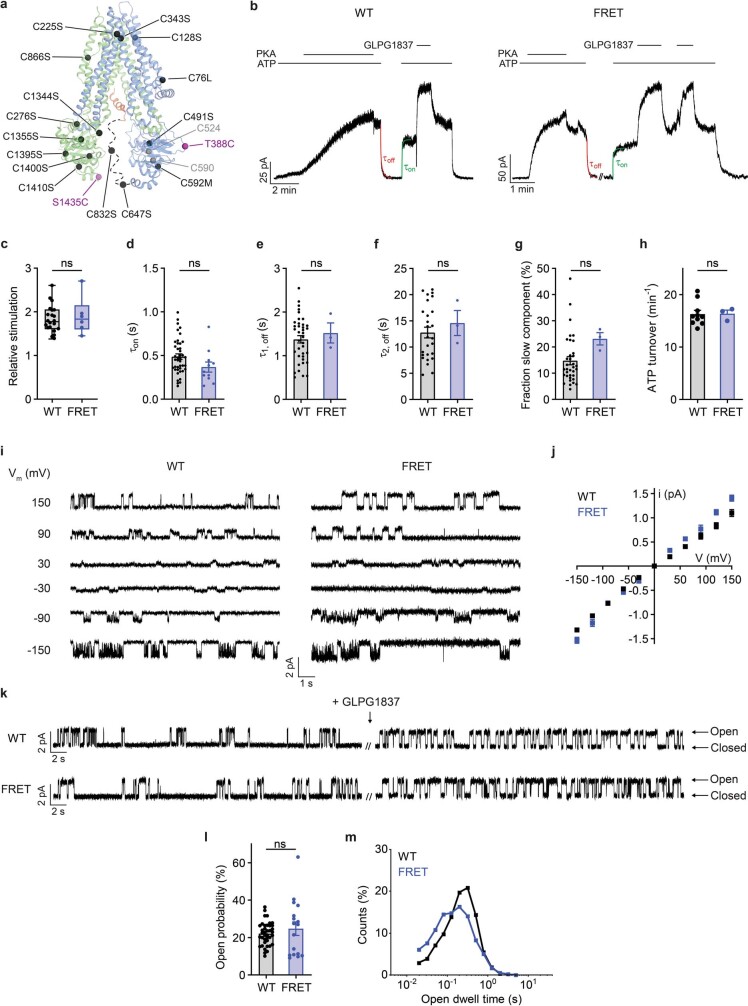
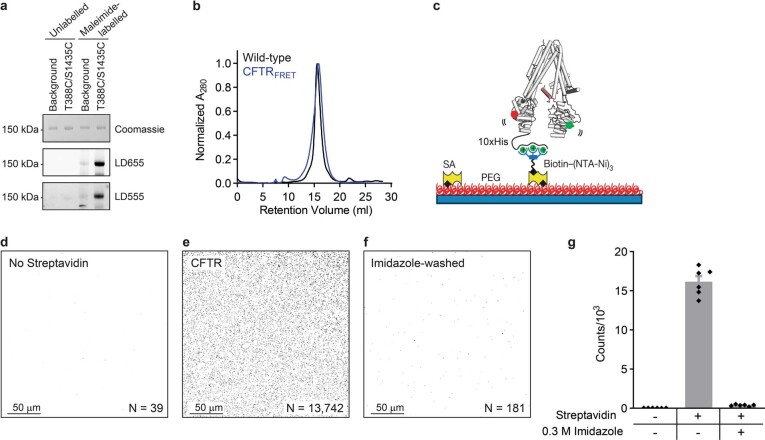
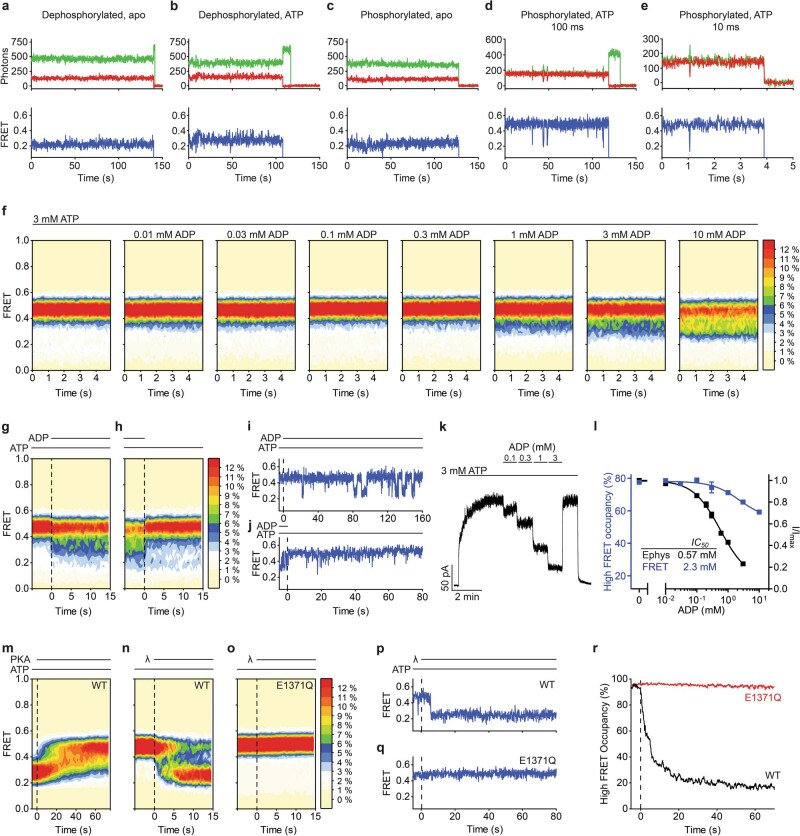
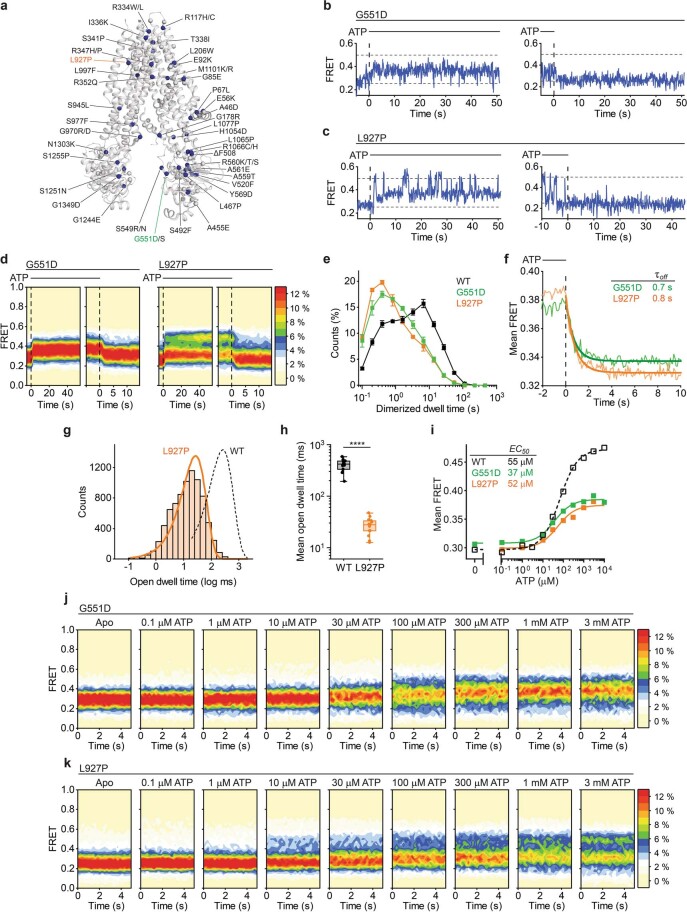
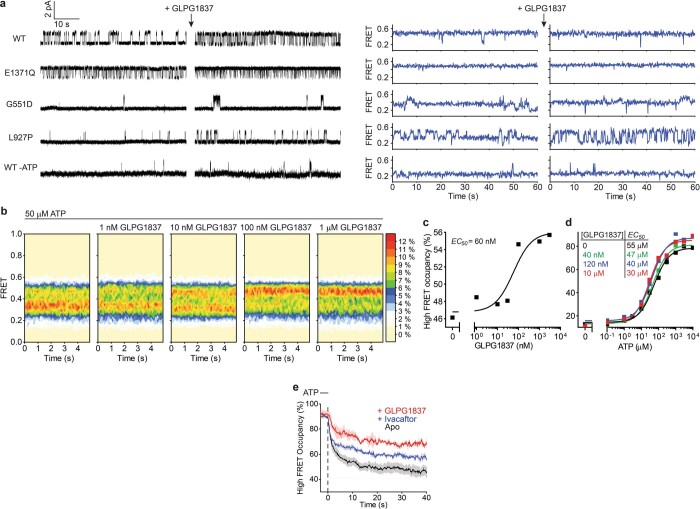
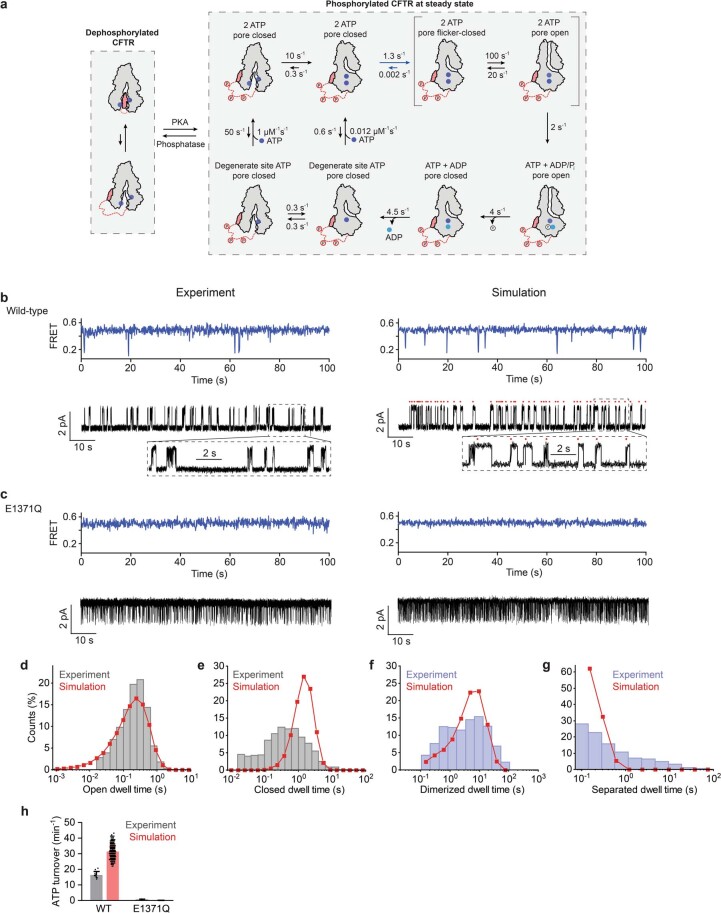
The cystic fibrosis transmembrane conductance regulator (CFTR) is an anion channel that regulates salt and fluid homeostasis across epithelial membranes1. Alterations in CFTR cause cystic fibrosis, a fatal disease without a cure2,3. Electrophysiological properties of CFTR have been analysed for decades4-6. The structure of CFTR, determined in two globally distinct conformations, underscores its evolutionary relationship with other ATP-binding cassette transporters. However, direct correlations between the essential functions of CFTR and extant structures are lacking at present. Here we combine ensemble functional measurements, single-molecule fluorescence resonance energy transfer, electrophysiology and kinetic simulations to show that the two nucleotide-binding domains (NBDs) of human CFTR dimerize before channel opening. CFTR exhibits an allosteric gating mechanism in which conformational changes within the NBD-dimerized channel, governed by ATP hydrolysis, regulate chloride conductance. The potentiators ivacaftor and GLPG1837 enhance channel activity by increasing pore opening while NBDs are dimerized. Disease-causing substitutions proximal (G551D) or distal (L927P) to the ATPase site both reduce the efficiency of NBD dimerization. These findings collectively enable the framing of a gating mechanism that informs on the search for more efficacious clinical therapies.


Conflict of interest statement

S.C.B. has an equity interest in Lumidyne Technologies. The other authors declare no competing interests.

Figures

Fig. 1
Fig. 1. Dependence of CFTR pore opening and NBD dimerization on phosphorylation and ATP.
a, CFTR structures in dephosphorylated, ATP-free (left, Protein Data Bank 5UAK) and phosphorylated, ATP-bound (right, Protein Data Bank 6MSM) states. Green and red circles indicate fluorophore positions. b, Inside-out excised patch showing dependence of wild-type (WT) CFTR-mediated currents on phosphorylation and ATP. Concentrations of 300 nM PKA and 3 mM ATP were used. c, FRET histograms for dephosphorylated (deP) and phosphorylated (P) wild-type CFTRFRET in the presence and absence of ATP, and phosphorylated CFTRFRET(E1371Q) with ATP. Data represent means and standard errors for n independent experiments. n = 6 for wild-type dephosphorylated and phosphorylated apo, n = 5 for wild-type dephosphorylated with ATP, n = 7 for wild-type phosphorylated with ATP, and n = 3 for phosphorylated E1371Q with ATP. d, Activation of pore opening and increase in occupancy of the high-FRET state after application of 300 nM PKA (at the dashed line), in the presence of 3 mM ATP. Upper panel, representative smFRET trace of CFTRFRET during phosphorylation. Lower panel, population-wide time-dependent changes in current and high-FRET occupancy after PKA application. Data represent means and standard deviations (shaded area) for three patches and three FRET experiments. e, Sample 100-s excerpts of traces from smFRET with phosphorylated CFTRFRET (left) and single-channel electrophysiology in lipid bilayers with phosphorylated wild-type CFTR (right) at the indicated ATP concentrations. In electrophysiology traces, upward deflections correspond to opening. The bottom traces are with the E1371Q variant in 3 mM ATP. f, Probabilities of opening and dimerization of phosphorylated CFTR in 3 mM ATP. Whiskers represent minima and maxima and boxes represent 25th, 50th and 75th percentiles for 39 bilayers and 8 FRET experiments. Statistical significance was tested by two-tailed Student’s t-test (****P = 2 × 10−18). g, ATP dose responses of CFTR-mediated current and high-FRET-state occupancy. Responses were fitted using the Hill equation with an EC50 of 53 ± 4 µM for opening and an EC50 of 55 ± 8 µM for high-FRET occupancy. Hill coefficients were fixed to 1. h, Dwell-time distributions of opening and dimerization events for phosphorylated CFTR in 3 mM ATP. i, ATP dose responses for rates of transitioning between low- and high-FRET states for phosphorylated CFTRFRET. Data represent means and standard errors for three experiments. The shaded area indicates the regime in which transitions are obscured by time averaging, resulting in erroneous rate estimates.
Fig. 2
Fig. 2. Asymmetric contributions of degenerate and consensus ATP-binding sites.
a, Schematic of degenerate and consensus sites as viewed from the plasma membrane. b, Steady-state ATP hydrolysis rates for the wild-type CFTR and variants. Data represent means and standard errors for 10 (wild-type), 3 (E1371Q) or 4 (W401A, Y1219 and W401A/Y1219A) measurements. *P = 0.014; ****P = 1.2 × 10−11 (E1371Q), 2.7 × 10−11 (Y1219A) and 2.1 × 10−11 (W401A/Y1219A). c, Sample traces from single-channel electrophysiology (top) and smFRET (bottom) of the CFTR(W401A) variant. The substitution was made in wild-type CFTR and CFTRFRET backgrounds for electrophysiology and smFRET, respectively. In electrophysiology traces, upward deflections correspond to opening. d, Dwell-time distributions of opening and dimerization events for CFTR(W401A). e, As in c, but with the CFTR(Y1219A) variant. f, Dimerization probabilities of wild-type CFTRFRET and variants. Data represent means and standard errors for 8 (wild-type), 4 (E1371Q), 5 (W401A) and 7 (Y1219A) measurements. NS, not significant; ****P = 8.0 × 10−9 (W401A) and 4.4 × 10−11 (Y1219A). g, Open probabilities of CFTR variants. Data represent means and standard errors for 39 (wild-type), 10 (E1371Q), 9 (W401A) and 5 (Y1291A) bilayers. ****P = 10−15 (E1371Q) and 4.9 × 10−5 (Y1219A). h, Coupling ratios of CFTR variants, defined as open probability divided by dimerization probability. Data represent means and standard errors. Phosphorylated CFTR variants at 3 mM ATP were used in all panels. For relevant panels, statistical significance relative to the wild-type was tested by one-way analysis of variance.
Fig. 3
Fig. 3. Temporal resolution of NBD conformation from pore state in the pre-steady state.
a, Upper panels, representative smFRET traces of ATP delivery (at the dashed line) to phosphorylated and nucleotide-free wild-type CFTRFRET. Lower panel, time-dependent changes in high-FRET occupancy of CFTRFRET and wild-type CFTR current after ATP delivery. Data represent means (solid line) and standard errors (shaded area) of 3 FRET experiments and 42 patches. Individual time courses were fitted as mono-exponential relaxations (see Extended Data Fig. 7a,b). Means and standard errors of exponential time constants are reported. b, Upper panels, representative smFRET traces of ATP withdrawal (at the vertical dashed line) from phosphorylated wild-type CFTRFRET and the CFTRFRET(E1371Q) variant. Lower panel, time-dependent changes in high-FRET occupancy of CFTRFRET and CFTR current after ATP withdrawal from the wild-type (solid lines) and the E1371Q (dashed lines) variant. Data represent means (line) and standard errors (shaded area) of 5 FRET experiments and 41 (wild-type) or 6 (E1371Q) patches. c, Representative single-molecule trace of ATP withdrawal from wild-type CFTRFRET. Initially Mg2+ is absent, followed by reintroduction of 2 mM Mg2+. d, Representative single-molecule trace of ATP withdrawal from the CFTRFRET(W401A) variant. e, ATP dose response for the frequency of transition between low- and high-FRET states for phosphorylated wild-type CFTRFRET. Data represent means and standard errors for three experiments. The shaded area indicates the regime in which transitions are obscured by time averaging, resulting in erroneous rate estimates. ATP was used at 3 mM in all panels.
Fig. 4
Fig. 4. Cystic fibrosis-associated variants and pharmacological potentiation.
a, Cartoon representation of CFTR, indicating the positions of residues G551 and L927, and the ivacaftor-binding site. The structural link between the potentiator-binding site and the NBD interface through TM8 is coloured blue. The consensus-site ATP is shown as sticks. b, Sample traces from single-channel electrophysiology (top) and smFRET (bottom) of wild-type CFTR and the CFTR(G551D) and CFTR(L927P) variants in the absence or presence of 10 µM GLPG1837. Substitutions were made in wild-type CFTR and CFTRFRET backgrounds for electrophysiology and smFRET experiments, respectively. Horizontal dashed lines indicate mean FRET efficiencies of low- and high-FRET states. c, Steady-state ATP hydrolysis rates for the wild-type CFTR and the CFTR(G551D) and CFTR(L927P) variants. Measurements were carried out in the absence or presence of 10 µM GLPG1837 or 1 µM ivacaftor. Data represent means and standard errors for 10 (wild-type apo and with ivacaftor), 12 (wild-type with GLPG1837) and 3 (G551D and L927P all conditions) measurements. *P = 0.032 (L927P apo versus GLPG1837) and 0.017 (L927P apo versus ivacaftor); ****P = 3 × 10−14 (wild-type apo versus GLPG1837), 4 × 10−15 (wild-type apo versus ivacaftor), 2 × 10−14 (wild-type versus G551D) and 8.8 × 10−10 (wild-type versus L927P). d, Open probabilities of G551D and L927P variants. Data represent means and standard errors for 3 (G551D) or 6 (L927P) bilayers. The dashed line indicates mean open probability of wild-type CFTR. ****P = 3.1 × 10−7 (G551D) and 4.3 × 10−11 (L927P). e, Coupling ratios of G551D and L927P variants. Data represent means and standard errors. The dashed line indicates the coupling ratio for wild-type CFTR. f, Correlation of probabilities of dimerization and opening for wild-type CFTR, CFTR(E1371Q), CFTR(W401A) and CFTR(L927P) in the absence (open squares) or presence (filled squares) of 10 µM GLPG1837. Data represent means and standard errors for 39 (wild-type apo), 9 (wild-type GLPG1837 and W401A apo), 10 (E1371Q apo), 6 (E1371Q GLPG1837 and L927P apo), 5 (W401A GLPG1837) and 3 (L927P GLPG1837) open-probability measurements and for 8 (wild-type apo), 4 (wild-type GLPG1837, E1371Q apo and E1371Q GLP1837), 5 (W401A apo and L927P apo) and 3 (W401A GLPG1837 and L927P GLPG1837) FRET measurements. The dashed line indicates equality between probabilities of opening and dimerization. g, Relative stimulation of opening and dimerization probabilities with 10 µM GLPG1837. Data represent means and standard deviations. The dashed line indicates no stimulation. Relative stimulation of G551D opening was determined by macroscopic current measurements in excised inside-out patches. Phosphorylated CFTR variants at 3 mM ATP were used in all panels. For relevant panels, statistical significance was tested by one-way analysis of variance.
Fig. 5
Fig. 5. CFTR gating model.
Model of the wild-type CFTR gating cycle at physiological ATP concentration. Dephosphorylated CFTR adopts an NBD-separated, auto-inhibited conformation. At steady state, the NBDs of fully phosphorylated CFTR dimerize rapidly with ATP bound at both sites (step 1). Dimerization is followed by conformational change to enable pore opening (step 2) and ATP hydrolysis at the consensus site (step 3). During the pre-hydrolytic open burst, CFTR rapidly samples a flicker-closed state. Post-hydrolytic CFTR remains open, but eventually relaxes to a non-conductive dimerized state (step 4). ADP dissociation (step 5) leads to a dynamically isomerizing intermediate (step 7). ATP rebinding may occur with subtle rearrangement at the dimer interface (step 6) or with complete NBD separation (step 8) to initiate a new gating cycle.
Extended Data Fig. 1
Extended Data Fig. 1. Functional characterization of CFTRFRET.
a. Design of FRET variant CFTR. The positions of native substituted, native retained, and novel cysteines are indicated with black, grey, and magenta spheres, respectively. The dashed line represents the structurally unresolved part of the R-domain. The C1458S substitution in the disordered C-terminus is not annotated. b. Example recordings showing Protein Kinase A (PKA)-activated, ATP-dependent, and GLPG1837-stimulated current from C-terminally GFP-fused wild-type and FRET variant CFTR in inside-out excised patches. 3 mM ATP, 300 nM PKA, and 10 µM GLPG1837 were used. c. Relative GLPG1837-mediated stimulation of wild-type and FRET variant CFTR currents in excised inside-out patches. Whiskers represent minima and maxima and boxes represent 25th, 50th, and 75th percentiles for 21 (wild-type) or 6 (FRET variant) patches. d. Single exponential time-constants of current activation for wild-type and FRET variant CFTR after application of 3 mM ATP. Data represent means and standard errors for 42 (wild-type) or 11 (FRET variant) patches. e-g. Exponential time-constants of the fast (e) and slow (f) components of current relaxation after ATP withdrawal, and the relative weight of the slow component (g), for wild-type and FRET variant CFTR. Data represent means and standard errors for 38 (wild-type) or 3 (FRET variant) patches. h. Steady state ATPase activity of wild-type and fluorophore-labelled FRET variant CFTR determined from bulk experiments. Data points represent means and standard errors for 10 (wild-type) or 3 (FRET variant) measurements. i. Voltage families of individual wild-type (left) and fluorophore-labelled FRET variant (right) CFTR channels reconstituted in synthetic lipid bilayers. The membrane potential (Vm) is indicated using physiological convention. j. Current-voltage relationships of wild-type and fluorophore-labelled FRET variant CFTR. Data points represent means and standard errors for 3 (wild-type) or 7-18 (FRET variant) channels. k. Example recordings of wild-type and fluorophore-labelled FRET variant CFTR reconstituted in synthetic lipid bilayers. CFTR was phosphorylated with PKA prior to fusion with the bilayer. The recording was performed with 3 mM ATP before (left) and after (right) addition of 10 µM GLPG1837. l. Open probabilities of the phosphorylated wild-type and fluorophore-labelled FRET variant CFTR in 3 mM ATP. Data points represent means and standard errors for 39 (wild-type) or 17 (FRET variant) channels. m. Open dwell time distributions for the phosphorylated wild-type and fluorophore-labelled FRET variant CFTR in 3 mM ATP. Statistical significance was tested using two-tailed Student’s t-test (ns: not significant).
Extended Data Fig. 2
Extended Data Fig. 2. Site-specific labelling and surface-immobilization of CFTR.
a. Site-specificity of fluorophore-conjugation to novel cysteines. Cysteine-less CFTR, with or without T388C/S1435C substitutions, was incubated with maleimide-conjugated LD555 and LD655 fluorophores. The products were separated by SDS-PAGE. The gel was imaged for LD555 and LD655 fluorescence and then Coomassie-stained. Labeling was >90 % specific to the two introduced cysteines. The experiment was repeated twice independently with similar results. For gel source data, see Supplementary Fig. 1. b. Gel-filtration profiles of wild-type CFTR and fluorophore-labelled CFTRFRET. c. Schematic drawing of the immobilization strategy. d–f. Wide-field fluorescence images of CFTRFRET immobilized to a Streptavidin-free (d) or Streptavidin-coated (e) surface. (f) CFTRFRET immobilized to a Streptavidin-coated surface was washed off with 0.3 M imidazole. N denotes the number of immobilized molecules detected. g. Quantification of the specificity of Streptavidin- and His-tag-dependent immobilization. Data points represent the means and standard errors of six immobilizations. The representation of the immobilization surface in c was recreated from ref. .
Extended Data Fig. 3
Extended Data Fig. 3. Phosphorylation- and nucleotide-dependence of CFTR dimerization.
a–e. Representative single-molecule traces showing donor (green) and acceptor (red) fluorescence intensities (top) and FRET (bottom) for dephosphorylated and nucleotide-free CFTRFRET (a), dephosphorylated CFTRFRET in the presence of 3 mM ATP (b), phosphorylated and nucleotide-free CFTRFRET (c), and phosphorylated CFTRFRET in the presence of 3 mM ATP (d-e). Panels a–d were collected with 100 ms integration time. Panel e was collected with 10 ms integration time. f. Contour plots of dose-dependent decrease in high FRET occupancy for phosphorylated CFTRFRET mediated by ADP in the presence of 3 mM ATP and increasing concentration of ADP. g-h. Contour plots showing time-dependent changes in FRET after rapid delivery (g) or withdrawal (h) of 10 mM ADP. CFTRFRET was phosphorylated prior to the experiments and 3 mM ATP was present throughout the experiments. i-j. Example single-molecule traces of changes in FRET dynamics of phosphorylated CFTRFRET upon rapid ADP delivery (i) or withdrawal (j). 3 mM ATP was present throughout the experiments. k. Representative titration of ADP-mediated competitive inhibition of ATP-dependent CFTR current in an inside-out excised patch. CFTR was phosphorylated prior to the recording. l. ADP dose-responses of CFTR-mediated current and high FRET state occupancy for phosphorylated CFTR in the presence of 3 mM ATP. Responses were fitted using the Hill equation (solid lines) with an IC50 of 0.57 ± 0.05 mM for opening and an IC50 of 2.3 ± 0.9 mM for high FRET occupancy. Hill coefficients were fixed to 1. Data represent means and standard errors for 7-11 patches and 3 FRET experiments. m. Contour plot showing time-dependent increase in FRET after application of 300 nM PKA (at the dashed line) to CFTRFRET in the presence of 3 mM ATP. n-o. Contour plots showing time-dependent decreases in FRET after application of 1 µM λ phosphatase (indicated as λ) to phosphorylated wild-type (n) and E1371Q (o) CFTRFRET, in the presence of 3 mM ATP. p-q. Example single-molecule traces of λ-dependent dephosphorylation of wild-type (p) and E1371Q (q) CFTRFRET. r. Quantification of the rate of high FRET depopulation after λ phosphatase application for wild-type and E1371Q CFTRFRET.
Extended Data Fig. 4
Extended Data Fig. 4. Structural characterization of dephosphorylated and ATP-bound CFTR.
a. Summary of cryo-EM workflow. b. cryo-EM map of dephosphorylated and ATP-bound wild-type CFTR at 4.3 Å resolution. c. Structural model of dephosphorylated and ATP-bound CFTR (PDB 8FZQ) docked into the map. d. ATP densities in consensus (left) and degenerate (right) nucleotide binding sites.
Extended Data Fig. 5
Extended Data Fig. 5. Nucleotide-sensitivity of CFTR dynamics.
a. Representative ATP titration of CFTR-mediated current in an inside-out excised patch. C-terminally GFP-fused wild-type CFTR was phosphorylated prior to the recording. b. FRET distributions of phosphorylated CFTRFRET at the indicated ATP concentrations. c-d. Dwell time distributions of low FRET (c) and high FRET (d) states for phosphorylated CFTRFRET at the indicated ATP concentrations. e. Contour plots for phosphorylated wild-type and E1371Q variant CFTRFRET at the indicated ATP concentrations. f. Transition density plots for the same conditions as in e.
Extended Data Fig. 6
Extended Data Fig. 6. smFRET imaging of proteoliposome-reconstituted CFTR.
a. Schematic drawing of the immobilization strategy for proteoliposome-reconstituted CFTRFRET. CFTRFRET molecules may be reconstituted with either orientation in the membrane. b–f. Example single-molecule traces showing donor (green) and acceptor (red) fluorescence intensities (top) and FRET (bottom) for phosphorylated and proteoliposome-reconstituted CFTRFRET. Traces are before addition of ATP (b), upon addition of 3 mM ATP at the first dashed line (c), at steady state with ATP (d), upon ATP withdrawal at the second dashed line (e), and at steady state after ATP withdrawal (f). The representation of the immobilization surface in a was recreated from ref. .
Extended Data Fig. 7
Extended Data Fig. 7. Correlating CFTR pore opening and closure with NBD conformation.
a. Example recordings of current responses to ATP application. 3 mM ATP was rapidly applied to an inside-out excised patch containing C-terminally GFP-fused wild-type CFTR (at the dashed lined). PKA-phosphorylation was performed prior to the recording. Time-courses were fitted with monoexponential functions (red lines). b. Example measurements of FRET responses to ATP application. 3 mM ATP was rapidly applied to PKA-phosphorylated CFTRFRET (at the dashed line). Time-courses were fitted with monoexponential functions (red lines). c. Representative inside-out excised patch showing the rate of solute exchange with local perfusion. CFTR was phosphorylated prior to the recording. CFTR current was then elicited by application of 3 mM ATP. The chloride Nernst potential was switched by exchanging from a chloride-containing perfusion solution (blue bar) to a sulfate-containing perfusion solution (red bar). d. Rate of current relaxation after solute exchange. Data represent means (solid black line) and standard errors (grey shaded area) for 7 patches. The time-course was fit with a monoexponential function (red line). e. Rate of relaxation in fluorescence intensity after injection (at the dashed line) of a DNA-conjugated Cy2 fluorophore into the imaging chamber. The experimental time-course (black points) was fitted with a monoexponential function (red line). f–h. Representative recordings of CFTR current relaxation upon ATP-withdrawal in inside-out excised patches: ATP withdrawal from wild-type CFTR, BeF3-trapped wild-type CFTR, and E1371Q CFTR (f); ATP withdrawal from wild-type CFTR in the absence of Mg2+, and upon reapplication of Mg2+ (g); ATP withdrawal from W401A CFTR (h). 2 mM Mg2+ was present throughout the recordings in f and h. 3 mM ATP, 0.5 mM BeF3, 2 mM Mg2+, and 10 mM EDTA were perfused onto the patches where indicated. CFTR was activated by application of 300 nM PKA and 3 mM ATP prior to the displayed recordings. i–k. Contour plots of FRET responses after ATP-withdrawal from phosphorylated CFTRFRET: ATP withdrawal from wild-type CFTRFRET in absence and presence of BeF3 or AlF4 and E1371Q CFTRFRET (i); ATP withdrawal from wild-type CFTRFRET in the absence of Mg2+ and upon reapplication of Mg2+ (j); ATP withdrawal from W401A CFTRFRET (k). 2 mM Mg2+ was present throughout the experiments in i and k. 3 mM ATP, 0.5 mM BeF3, 1 mM AlF4, 2 mM Mg2+, and 10 mM EDTA were present where indicated. l. Schematic of events underlying CFTR pore closure and NBD separation. CFTR bound to two ATP molecules is dimerized, open, and competent for hydrolysis. ATP hydrolysis at the consensus site is followed by release of ADP and inorganic phosphate (Pi). The degenerate site remains occupied by ATP and this intermediate dynamically transitions between dimerized and separated conformations. The dimerized state has low open probability without ATP in the consensus site. ATP release from the degenerate site leads to stable NBD separation and channel closure. ATP is shown as blue circles.
Extended Data Fig. 8
Extended Data Fig. 8. Characterization of cystic fibrosis-associated variants.
a. Positions of cystic fibrosis-causing missense mutations. Mutated sites are shown as spheres. b–c. Representative smFRET traces of ATP delivery to and withdrawal from phosphorylated G551D (b) and L927P (c) CFTRFRET (at the vertical dashed lines). Horizontal dashed lines indicate mean FRET efficiencies of the low and high FRET states. ATP concentration was 3 mM. d. Contour plots showing time-dependent changes in FRET after application and withdrawal of 3 mM ATP (at the dashed lines) to and from phosphorylated G551D and L927P variant CFTRFRET. e. Dwell time distributions of the NBD-dimerized state for phosphorylated wild-type, L927P, and G551D CFTRFRET at 3 mM ATP. Data represent means and standard errors for 8 (wild-type) or 3 (G551D and L927P) experiments. f. FRET responses of G551D and L927P variants to ATP withdrawal (3 mM ATP to nucleotide-free at the dashed line). Relaxation to low FRET was fit with monoexponential functions (solid lines). g. Open dwell time distribution of L927P variant CFTR. The distribution was fit with a monoexponential function (orange line). The dashed line is a monoexponential fit of the open dwell time distribution of wild-type CFTR. h. Mean open dwell times for wild-type and L927P variant CFTR. Whiskers represent minima and maxima and boxes represent 25th, 50th, and 75th percentiles for 13 (wild-type) or 13 (L927P) bilayer recordings. Statistical significance was tested using two-tailed Student’s t-test (****p = 2 x 10⁻⁸). i. ATP dose-responses of mean FRET for G551D and L927P variants. Responses were fitted using the Hill equation with EC50 values of 37 ± 7 µM for G551D and 52 ± 18 µM for L927P. j-k. Contour plots of phosphorylated G551D (j) and L927P (k) CFTRFRET at the indicated ATP concentrations.
Extended Data Fig. 9
Extended Data Fig. 9. Potentiator-dependent changes in CFTR NBD dynamics.
a. Sample traces from single channel electrophysiology (black) and smFRET (blue) of wild-type, E1371Q, G551D, and L927P CFTR variants in the absence (left) or presence (right) of 10 µM GLPG1837. The bottom traces are wild-type CFTR in the absence of ATP. All other recordings were with 3 mM ATP. Measurements were performed with phosphorylated CFTR. In electrophysiology traces, upward deflections correspond to opening. b. Contour plots of phosphorylated wild-type CFTRFRET with 50 µM ATP and GLPG1837 at the indicated concentrations. c. GLPG1837 dose-response of high FRET occupancy for phosphorylated wild-type CFTRFRET at 50 µM ATP. The response was fit using the Hill equation (solid line) with an EC50 value of 0.06 ± 0.04 µM. d. ATP dose-responses of high FRET occupancy in the presence of GLPG1837 at the indicated concentrations. The responses were fit using the Hill equation (solid lines) with EC50 values of 55 ± 8 µM (no GLPG1837), 47 ± 8 µM (40 nM GLPG1837), 40 ± 9 µM (120 nM GLPG1837), and 30 ± 5 µM (10 µM GLPG1837). e. Rates of depopulation from the high FRET state after ATP withdrawal from phosphorylated wild-type CFTRFRET in the absence of potentiator, with 10 µM GLPG1837, or with 100 nM Ivacaftor. Data represent means and standard errors (shaded area) for 5 (without potentiator) or 3 (with GLPG1837 or Ivacaftor) experiments.
Extended Data Fig. 10
Extended Data Fig. 10. Stochastic simulation of CFTR pore and NBD dynamics.
a. Topology and rates of the simulated model. b–c. Experimental and simulated smFRET and single-channel electrophysiology traces of the wild-type (b) and E1371Q variant CFTR (c). The red dots above the simulated current traces indicate ATP hydrolysis events. d–g. Comparison of experimental and simulated dwell time distributions of pore open (c), pore closed (d), NBD dimerized (e), and NBD separated (f) states for wild-type CFTR. Experimental distributions are shown as histograms, and simulated distributions as red lines. Flicker-closures were ignored in analysis and the open and closed dwell times therefore reflect open burst and interburst dwell times, respectively. h. Experimental and simulated steady state ATP hydrolysis rates. Data represent means and standard deviations for 10 (wild-type) or 3 (E1371Q) measurements and 1500 (wild-type or E1371Q) simulated molecules.

References

    1. Cutting G. Cystic fibrosis genetics: from molecular understanding to clinical application. Nat. Rev. Genet. 2015;16:45–56. doi: 10.1038/nrg3849. - DOI - PMC - PubMed
    1. Riordan JR, et al. Identification of the cystic fibrosis gene: cloning and characterization of complementary DNA. Science. 1989;245:1066–1073. doi: 10.1126/science.2475911. - DOI - PubMed
    1. Rommens JM, et al. Identification of the cystic fibrosis gene: chromosome walking and jumping. Science. 1989;245:1059–1065. doi: 10.1126/science.2772657. - DOI - PubMed
    1. Gadsby D, Vergani P, Csanády L. The ABC protein turned chloride channel whose failure causes cystic fibrosis. Nature. 2006;440:477–483. doi: 10.1038/nature04712. - DOI - PMC - PubMed
    1. Csanády L, Vergani P, Gadsby DC. Structure, gating, and regulation of the CFTR anion channel. Physiol. Rev. 2019;99:707–738. doi: 10.1152/physrev.00007.2018. - DOI - PubMed

Publication types

MeSH terms