. 2023 Mar;615(7954):939-944.
doi: 10.1038/s41586-023-05863-6. Epub 2023 Mar 22.

Ultrafast structural changes direct the first molecular events of vision

Affiliations

Ultrafast structural changes direct the first molecular events of vision

Thomas Gruhl et al. Nature. 2023 Mar.

Abstract

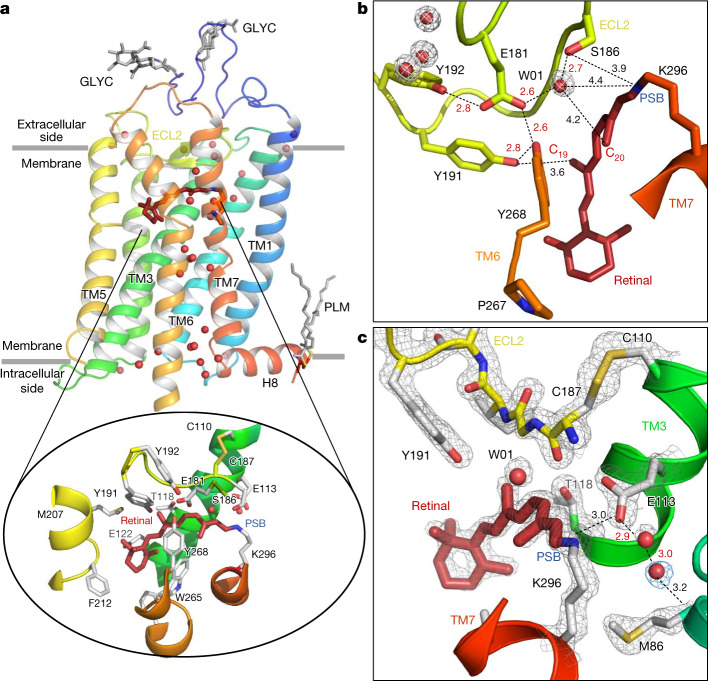
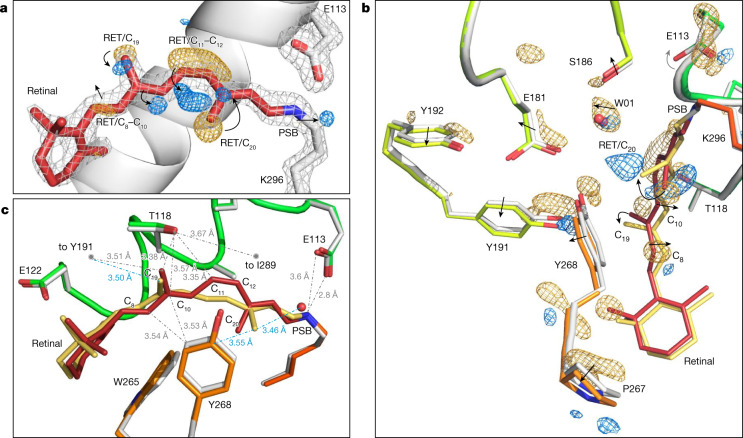
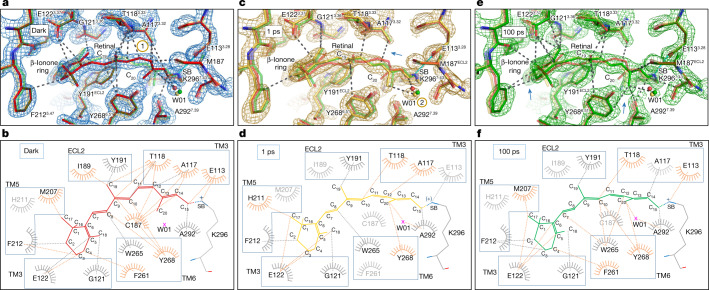
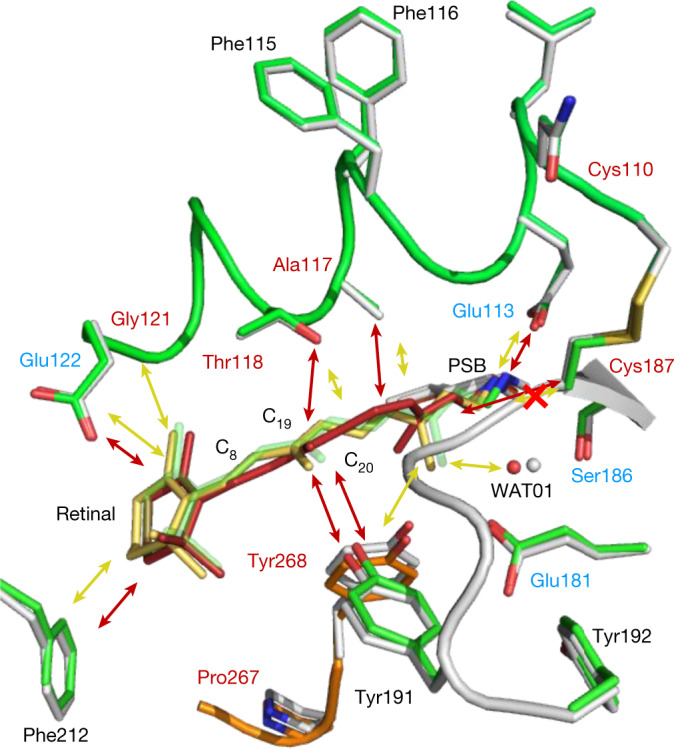
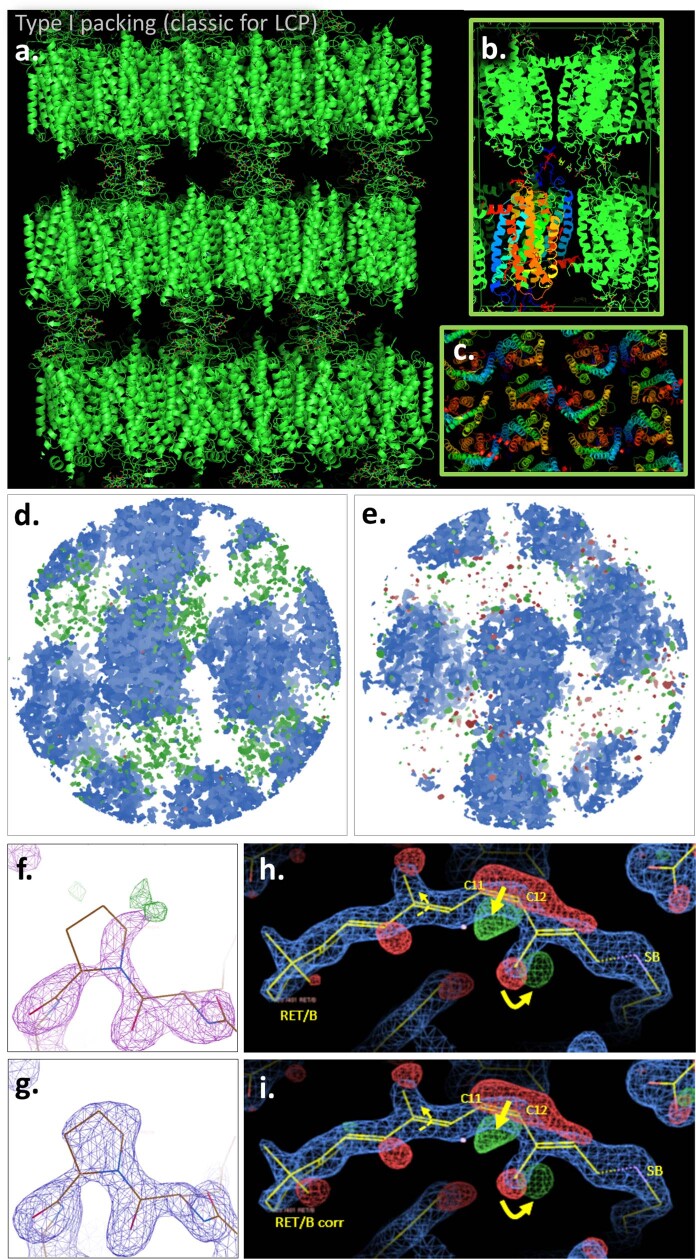
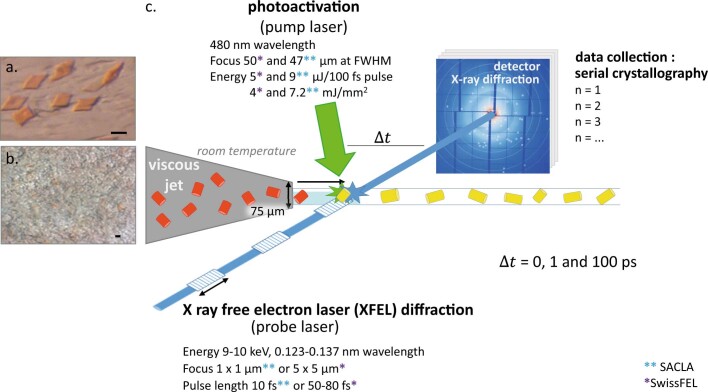
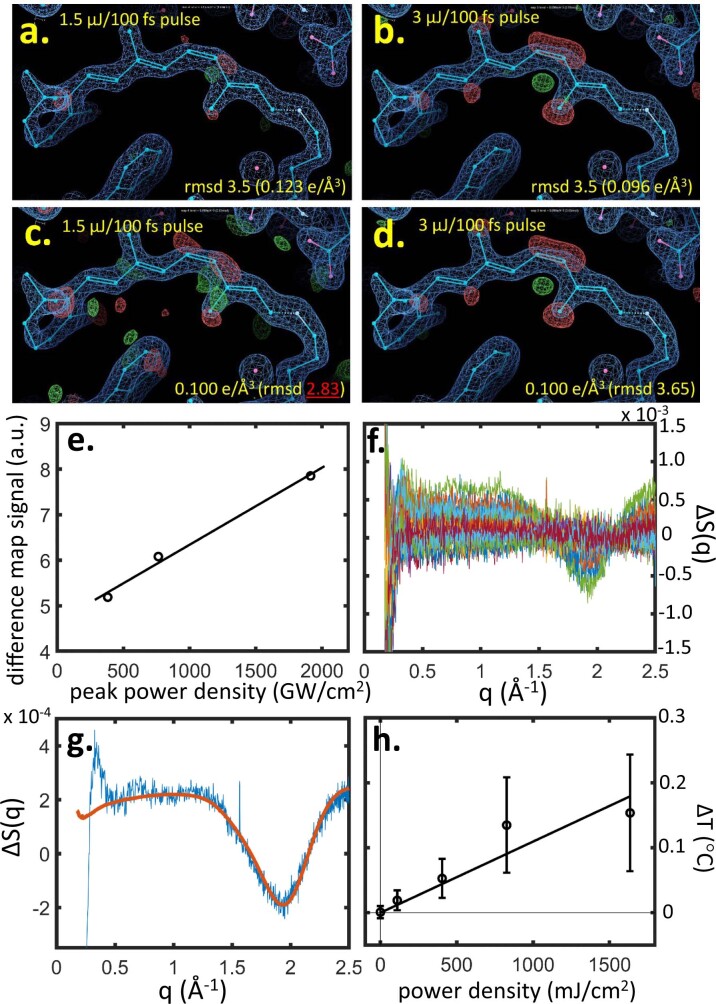
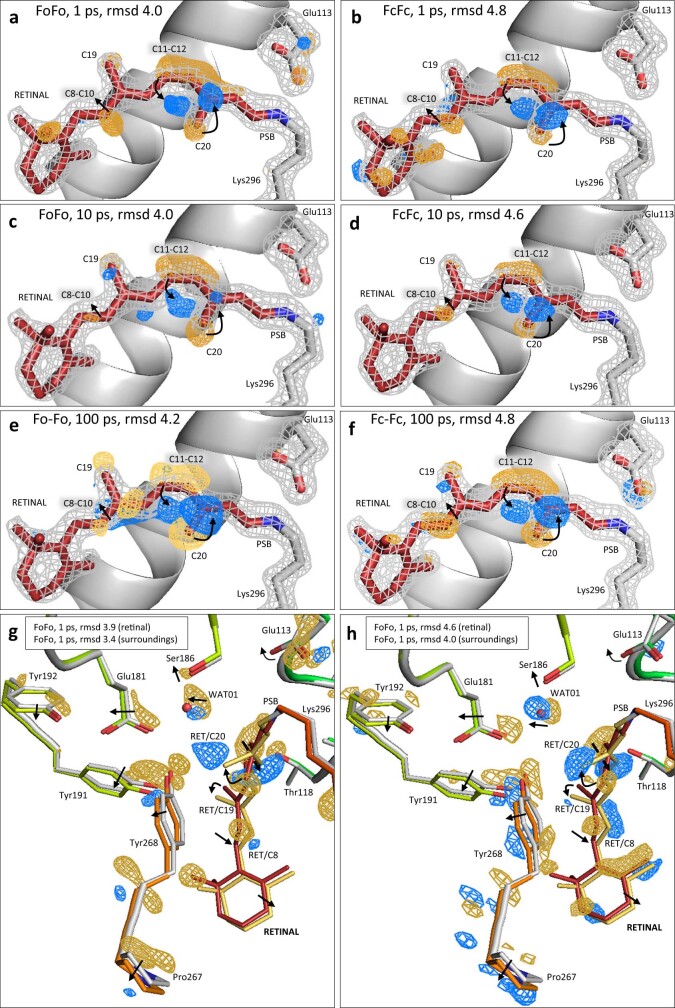
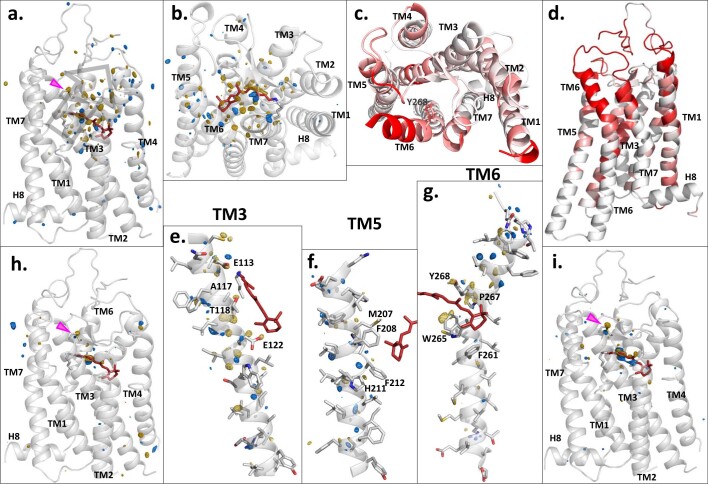
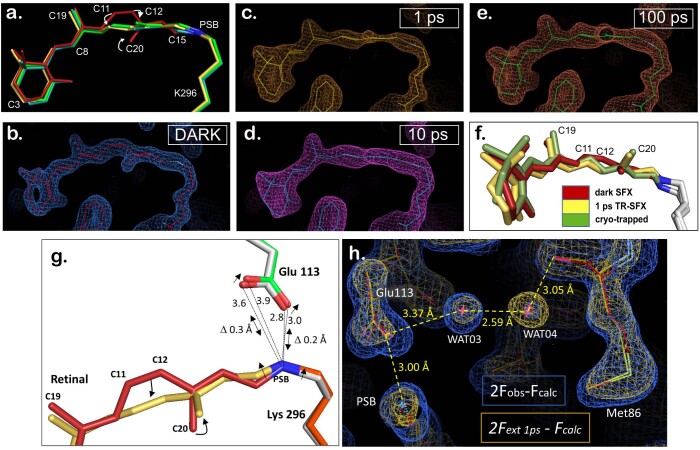
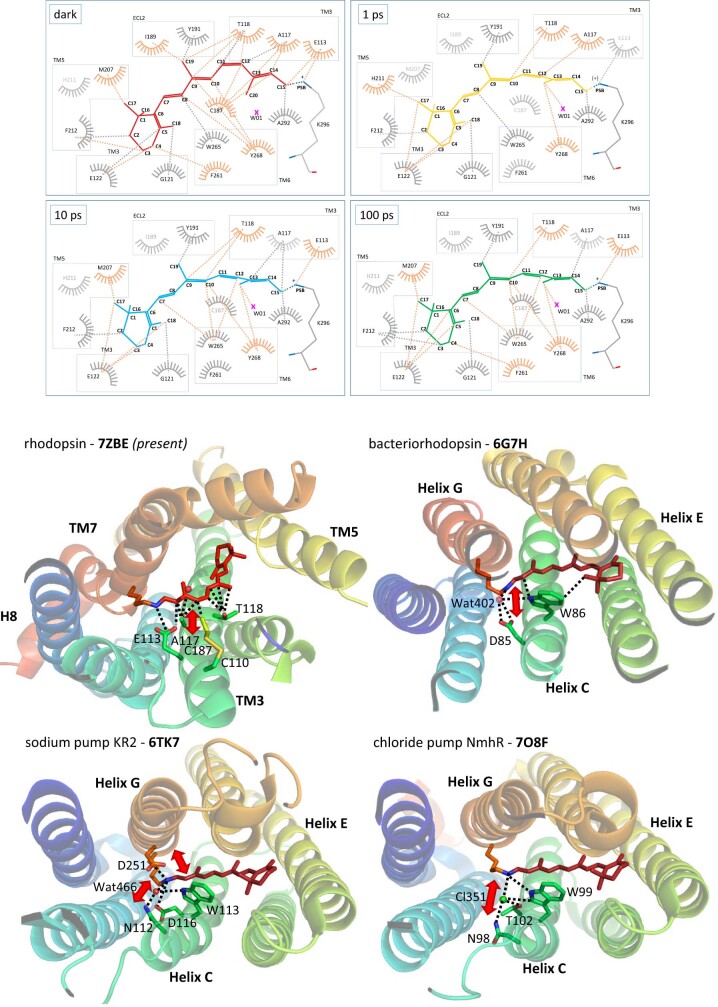
Vision is initiated by the rhodopsin family of light-sensitive G protein-coupled receptors (GPCRs)1. A photon is absorbed by the 11-cis retinal chromophore of rhodopsin, which isomerizes within 200 femtoseconds to the all-trans conformation2, thereby initiating the cellular signal transduction processes that ultimately lead to vision. However, the intramolecular mechanism by which the photoactivated retinal induces the activation events inside rhodopsin remains experimentally unclear. Here we use ultrafast time-resolved crystallography at room temperature3 to determine how an isomerized twisted all-trans retinal stores the photon energy that is required to initiate the protein conformational changes associated with the formation of the G protein-binding signalling state. The distorted retinal at a 1-ps time delay after photoactivation has pulled away from half of its numerous interactions with its binding pocket, and the excess of the photon energy is released through an anisotropic protein breathing motion in the direction of the extracellular space. Notably, the very early structural motions in the protein side chains of rhodopsin appear in regions that are involved in later stages of the conserved class A GPCR activation mechanism. Our study sheds light on the earliest stages of vision in vertebrates and points to fundamental aspects of the molecular mechanisms of agonist-mediated GPCR activation.


Conflict of interest statement

The authors declare no competing interests.

Figures

Fig. 1
Fig. 1. Room temperature SFX structure of the dark state of bovine rhodopsin from crystals grown in LCP.
a, The overall structure of rhodopsin, rainbow coloured by residue number from blue (N terminus) to red (C terminus). The seven-TM bundle contains two N-glycosylation domains (GLYC) and palmitate groups (PLM) that anchor the amphipathic helix H8 to the membrane (grey lines). Water molecules (red spheres) form key networks between the extracellular (retinal ligand-binding pocket) and intracellular (G protein-binding site) regions of the receptor. The 11-cis retinal (dark red) is covalently bound to Lys296 (inset) through the PSB. The retinal-binding pocket is further composed of amino acids surrounding the PSB (the counterion Glu113, and Met44, Phe91, Thr94, Ala292 and Phe293), the retinal aliphatic chain (Ala117, Thr118, Tyr191, Trp265 and Glu181/Ser186 through water W01) and the β-ionone ring (Gly120, Gly121, Glu122, Phe212, Met207, Phe261 and Ala269; for clarity, only selected residues in the binding pocket are shown). b,c, Examples of well-resolved molecules in the water-mediated networks connecting the residues in the ancestral counterion Glu181 network (b) and the counterion Glu113 to Met86 of TM2 (and Ala1173.32, not shown) (c). The water molecules have well-defined electron densities (grey and blue meshes, 2Fobs − Fcalc electron density contoured at 2.2 and 0.7σ, respectively).
Fig. 2
Fig. 2. Retinal conformation captured 1 ps after rhodopsin photoactivation using TR-SFX.
a, Changes in electron density. The retinal (RET) model (red) and the contoured grey mesh (at 2.7σ of the 2Fobs − Fcalc electron density map) correspond to rhodopsin in the dark state obtained by SFX. The difference Fourier electron density (Fobs(light) − Fobs(dark) contoured at 3.8σ) around the C11=C12 bond of the polyene chain and the C20 methyl show features appearing after 1 ps photoactivation in blue (positive density) that are correlated with disappearing features in gold (negative density), establishing that the chromophore has already isomerized. A negative density is also observed along C8 and C10 of the retinal polyene chain. b,c, The effect of retinal isomerization on the surrounding amino acid residues. The model of 1-ps-photoactivated rhodopsin (retinal in yellow; rhodopsin in orange and green) obtained from the extrapolated map 2Fext − Fcalc (21% photoactivation; Methods) superimposed to the dark-state model (retinal in red; rhodopsin in grey). The main chain Cɑ atoms of the protein were used for the structural superposition. b, The difference electron density map (Fobs(light) − Fobs(dark), contoured at 3.4σ) shows the presence of positive and negative electron densities (blue and yellow) around specific amino acids such as Tyr2686.51 of the binding pocket. The arrows illustrate shifts or rotations. c, The torsion of the retinal polyene chain at C11–C13 in the direction of Tyr268 (the π-system at the isomerizing bond of retinal (yellow model) is now rotated 90° with respect to that of the dark state (red model) (Extended Data Fig. 6)) and the bending along C6–C11. Selected distances from retinal to rhodopsin residues are shown as grey dotted lines for the dark state and as blue dotted lines for the isomerized form.
Fig. 3
Fig. 3. Residue environment distances from retinal measured using PyMol and LigPlot software, respectively.
a,c,e, The two rhodopsin models after 1 ps (yellow) and 100 ps (green) of photoactivation were superimposed in PyMol with the rhodopsin dark-state model (red) and the residue environment distances were drawn with a cut-off at 3.7 Å using dashed lines from the retinal in the dark (a) and after 1 ps (c) and 100 ps (e) photoactivation. The salt bridge between the Schiff base (SB) and counterion Glu113 is marked in cyan. The yellow-circled numbers 1 and 2 show the regions in which interactions will weaken and appear, respectively (see also the blue arrows). b,d,f, While PyMol displays the three-dimensional structure of amino acids in the previous panels, the LigPlot represents a flat interaction plot with all amino acids involved (orange) or less (grey) in the conformational changes during the picosecond time delays of photoactivation (dark (b), 1 ps (d) and 100 ps (f)).
Fig. 4
Fig. 4. Interactions between retinal and the binding-pocket residues are substantially reduced 1 ps after photoactivation.
Schematic of the interactions of retinal in the rhodopsin ligand-binding pocket before (red arrows) and after photoactivation in the picosecond range (yellow arrows; the red cross on the yellow arrow shows the bond disruption). A longer arrow represents a stronger interaction. The grey structure corresponds to the dark state (retinal in red) and the coloured structure corresponds to the 1-ps illuminated model (retinal in yellow). For comparison, the retinal model after 100 ps is shown in green. The residues labelled in red are GPCR-conserved and the blue residues are rhodopsin-conserved.
Extended Data Fig. 1
Extended Data Fig. 1. Rhodopsin molecules crystal packing and lattice translation correction.
a-c.) Rhodopsin molecules packing in the crystal lattice of space group P 2 21 21. Bovine rhodopsin crystals obtained with the lipidic cubic phase method reveal a typical molecule packing of type I, consisting of a well-ordered stacking of 2D-crystals (a.) The 2D-crystals contact each other through the glycosyl groups of Asn2 and Asn15 of the rhodopsin N-termini, generating head-to-head crystal contacts in the c-dimension. (b.) View of the potential physiological dimer contacting the transmembrane domains 1 (in blue) of each of the two rhodopsin molecules. (c.) top view of the molecules arrangement. The “Spectrum” rainbow colour transforms gradually from the TM1 in blue to the TM7 and the amphipathic helix 8 in red. d-i) Lattice translation correction. Despite a straightforward molecular replacement (Phaser MR, Phenix, see Methods) and a solution harbouring a P 2 21 21 space group, the dark rhodopsin data analysis indicated the presence of more than one off-origin peaks in the Patterson function. In particular, the Patterson peak at td = (0,0.245,0)(SwissFEL) and (0,0.243,0)(SACLA) were attributed to the presence of two translation-related domains within the crystals. Accordingly, a ghost density was identified (d) in the Fo-Fc map (in green and red, contoured at 3.83 rmsd) partially overlapping with the 2Fo-Fc map (blue, 2.7 rmsd) from which the rhodopsin model was built in. e) After correction of the single domain X-ray intensities according to Wang et al. (see Methods), the overall rhodopsin electron density map 2Fo-Fc displays less ghost electron density (green and red). More locally at a few affected amino acid residues locations, e.g. compare the electron density of P34(1.29)/A in the lower panel (g) (corrected) to upper (f) (original). h-i) Importantly, the retinal binding pocket of rhodopsin was not affected by the density overlapping and correction, and the density after correction (i) shows only minor changes in the difference map compared to the original data (h).
Extended Data Fig. 2
Extended Data Fig. 2. Time resolved serial femtosecond crystallography.
Time resolved serial femtosecond crystallography (TR-SFX) was conducted using an X-ray free electron laser. Crystal plates (20 µm large and about 1.5 µm thick) were made of rhodopsin purified from bovine retinae (a. panel, scale bar is 20 µm). The sample was scaled up (b. panel, scale bar is 20 µm) and subjected to a pump and probe experiment (c. panel) triggered by a photoactivation at 480 nm (pump laser). Briefly, rhodopsin crystals grown in lipidic cubic phase (LCP) in the darkness were successively injected (viscous jet) in the light of a pump laser and probed for X-ray diffraction after various time-delays (∆t from 1 to 100 picoseconds) using the X-ray free electron laser from SACLA (Japan)(blue double asterisk) or SwissFEL (Switzerland)(purple asterisk) under the regime “diffract-before-destroy”. The 10 ps time-delay was performed at the SwissFEL with the following laser settings: pump laser, 483 nm, 3 µJ/100fs pulse, 84 µm FWHM and an XFEL at 12 keV with 25 fs pulse length, focus 3 x 5 µm. The processing was done both on the fly and at home using the CrystFEL software combining 30’000 of the diffraction patterns generated by each crystal into a dataset. The inset of the b. panel illustrates the opacity of the lipidic phase around the crystal when the rhodopsin crystals are produced in large quantity, hampering spectroscopic experiments on the TR-SFX sample.
Extended Data Fig. 3
Extended Data Fig. 3. Correlation between the power density of the pump laser and either the water heating signal by time-resolved X-ray solution scattering (TR-XSS) or the rhodopsin photoproduct appearance by time-resolved serial femtosecond crystallography.
a-e.) Lowest limit of pump laser power (a-e) for observing decent difference electron density (DED) signals in rhodopsin within the present experimental settings. Two datasets of rhodopsin photoactivated for a 10 ps time delay were collected (SwissFEL beamtime 20200597) at 2 different laser powers, 1.5 (a and c) and 3 µJ/100 fs pulse (b and d) with the same focus (100 µm spot diameter (1/e2)) and same amount of 29.900 images. For both pump laser powers, the retinal isomerization and the concomitant C20-methyl rotation are observable, but the positive electron density signals are barely detectable in the case of the low power setting (a panel compared to b), e.g. the 11-cis-to-trans event is marked by a strong negative electron density on the 11-cis, but no corresponding positive density is detected. When the intensity of the DED is increased for both until an equal level of 0.100 e/Å3, we observe that the signal-to-noise ratio for the low pump laser energy condition (c panel) is so low that the signals cannot be interpreted, compared to the condition with twice the energy (d panel). Power titration including 1.5 µJ/100 fs pulse, 3 µJ/100 fs pulse (10 ps time points) and the 5 µJ/100 fs pulse (1 ps time point), with peak power density of 382 GW/cm2, 764 GW/cm2 and 1914 GW/cm2, respectively (e panel). (f-h) Time-resolved X-ray solution scattering (TR-XSS) studies of visual rhodopsin using XFEL radiation. f) TR-XSS difference data (laser on minus laser off) recorded at the LCLS from detergent solubilized samples of rhodopsin for the time-delays 10 ps ≤ Δt ≤ 1 μs at various laser power densities. g) Principal singular value decomposition (SVD) component (blue line) from samples of visual rhodopsin indicating laser induced heating (characteristic curve from 0.5 Å−1 ≤ q ≤ 2.5 Å−1) as well as oscillations usually associated with protein induced structural changes (visible from 0.25 Å−1 ≤ q ≤ 1.0 Å−1). An experimental difference X-ray scattering curve due to heating alone (red line) recorded from detergent solubilized samples of a photosynthetic reaction centre using synchrotron radiation, is used to calibrate this laser induced heating. h) Laser induced heating in samples of visual rhodopsin measured by TR-XSS when using a 480 nm fs laser pulse with a fluence of 110 mJ/cm2 (number of independent measurements, n = 6); 400 mJ/cm2 (n = 6); 830 mJ/cm2 (n = 3); and 1640 mJ/cm2 (n = 2), where the fluence is averaged across the FWHM of the laser spot. Negative time-delays (n = 4) were used as a control (plotted at zero fluence). Data are presented as mean values +/− SEM.
Extended Data Fig. 4
Extended Data Fig. 4. Comparison of observed and calculated difference electron density maps at the three time-delays 1, 10 and 100 ps of rhodopsin photoactivation, showing that the refined models (right panels) are in good agreement with raw difference electron density data (left panels).
Difference Fourier electron density maps were created directly from the starting experimental electron density maps (Fobs(light)-Fobs(dark)) (left panels) or from the calculated atomic structure model factors (Fcalc(light)-Fcalc(dark)) (right panels) and compared for the 1 ps dataset (a versus b; g versus h), 10 ps (c versus d), 100 ps datasets (e versus f). The panels show the retinal binding pocket of rhodopsin in the dark state (all panels) (or superimposed with the 1 ps photoactivated structure (g-f)) with retinal in red (or in yellow for the 1 ps structure (g-f)) and contoured with the 2Fobs-Fcalc electron density map (grey mesh) (a—f). Highlighted in colour, the difference Fourier electron density signals between photoactivated and dark rhodopsin are displaying features appearing with time, in blue (positive density) that are correlated with disappearing features in gold (negative density). The mesh contouring at various rmsd values was adjusted for easier side to side comparison of the different types of maps and clarity of the figure (see the values in the panels a—h).
Extended Data Fig. 5
Extended Data Fig. 5. Anisotropic breathing motion of rhodopsin.
Comparison of the overall conformational changes in rhodopsin photoactivated for 1, 10 and 100 picoseconds. The difference electron density map (Fobs(1ps-light)-Fobs(dark) contoured at 4.2 rmsd) from the dataset of 1ps-illuminated rhodopsin superimposed on the rhodopsin dark state structure model (grey) (a-b) shows strong signals (blue=positive density; yellow=negative density) on the retinal molecule (red) demonstrating the early isomerization. Surrounding the retinal, changes occur at the amino acid level in an anisotropic direction towards the extracellular side (grey arrow of panel a) along TM5 and TM6 (panels f and g). This anisotropic breathing motion can be detected in the extracellular part of TM3 (e), TM5 (f) and TM6 (g). After 10 ps (panel h) and 100 ps (panel i) of photoactivation, most of the conformational concerted motion changes are reset (h, i and Extended Data Table 3), only a few amino acids only will not revert –like the disulphide bridge C110-C187 (pink arrow)- and take part to further changes along the photoactivation pathway (Extended Data Table 3). Interestingly, we also observe localized intrinsic fluctuations in molecular dynamics simulations of rhodopsin in the dark state (PDBid: 1GZM) analysed from the GPCRmd database. These fluctuations localize at the extracellular side of the transmembrane bundle and are compatible with the energy dissipation changes observed at 1 ps (compare panels c and d (molecular dynamics simulations) with the panels a and b (breathing motion)). Three independent molecular dynamics simulations (3 x 2500 frames) of rhodopsin with retinal (PDBid: 1GZM) were analysed and the backbone root-mean-square fluctuation (RMSF) was depicted on each residue with increasing values from white to red (the RMSF scale was truncated at 1.8 Å for clarity).
Extended Data Fig. 6
Extended Data Fig. 6. Conformation of retinal after 1, 10 and 100 ps of rhodopsin photoactivation using TR-SFX, and Schiff base surroundings.
(a-f) Retinal conformational changes until 100 ps. a) The superimposition of the retinal TR-SFX models in the dark (red model) and 1 to 100 ps photoactivation time delays highlights the main differences: the cis-to-trans isomerization at C11-C12 and the concomitant rotation of the C20-methyl around C13. Beside a slight tilt of the β-ionone ring, another difference between 1 (yellow model), 10 (light blue) and 100 (green) ps-structures is a slight relaxation of the polyene chain towards planarity. b) Original electron density map around the retinal in the rhodopsin dark state obtained by SFX (2Fo-Fc map contoured at 2.5 rmsd) and the resulting refined model in red. c) Extrapolated electron density map around the retinal of 1 ps-photoactivated rhodopsin obtained by TR-SFX (2Fext-Fc map contoured at 1.9 rmsd) and the resulting refined model in yellow. d) Extrapolated electron density map around the retinal of 10ps-photoactivated rhodopsin obtained by TR-SFX (2Fext-Fc map contoured at 0.9 rmsd) and the resulting refined model in blue. e) Extrapolated electron density map around the retinal of 100 ps-photoactivated rhodopsin obtained by TR-SFX (2Fext-Fc map contoured at 1.9 rmsd) and the resulting refined model in green. f) Structure of rhodopsin after 1ps photoactivation (yellow model) obtained by TR-SFX (this study) compared to a cryo-trapped bathorhodopsin state (green model) and the dark state (red model). (g-h) Schiff base-counterion E113 and neighbouring water hydrogen bond network after 1 picosecond of photoactivation. Panel g: influence of the C11-C12 isomerization on the Schiff base conformation and distance to the counterion E113. The two models of rhodopsin are superimposed on the Cɑ atoms of the protein. Retinal after 1 ps of photoactivation (yellow (with orange K296(7.43))) is showing an all-trans conformation and the C15 of the C14-C15-NZ plane at the SB displays a slight kick towards the extracellular space compared to the structure of the dark state (red). The counterion E113(3.28) moves accordingly, in the same direction of about 0.2-0.3 Å. Panel h: of the two water molecules W03 and W04 which form a bridge between the counterion E113(3.28) and M86(2.53) (and also contacting A117(3.32), F91(2.58) and F116(3.31), not shown), only W04 has gained order. The two rhodopsin molecules models (dark in red; 1 ps in yellow) are contoured with their respective electron density maps, in blue (2Fo-Fc contoured at 1.3 rmsd) and in orange (2Fextrapolated-Fc contoured at 1.3 rmsd). By Δt = 100 ps we observe a reset of the occupancy, which is similar to that of the dark state structure.
Extended Data Fig. 7
Extended Data Fig. 7. Interactions of retinal with its binding pocket at 0, 1, 10 and 100 ps of photoactivation and comparison with microbial rhodopsins.
LIGPLOT view of retinal interactions within the rhodopsin binding site (upper four panels) (set distance < 3.6 Å) at different time-delays of photoactivation, dark state, 1, 10 and 100 ps-photoactivated states. The amino acids and dashed lines of interatomic interactions labelled in orange are the site of major changes, showing new interactions, e.g. with water W01 or losing contact with C187(ECL2). Retinal binding pocket of non-homologous rhodopsins (lower four panels) (PDBid codes shown in bold) from mammalian (the rhodopsin GPCR from Bos taurus (this study) (PDBid=7ZBE)) and prokaryotes (bacteriorhodopsin proton pump from Halobacterium salinarum (PDBid=6G7H); KR2 sodium pump from Krokinobacter eikastus (PDBid=6TK7) and the NmHR chloride pump from Nonlabens marinus (PDBid=7O8F)). The third transmembrane helix (“TM3” in GPCRs and “helix C” in prokaryotes) has been described as a main interaction site for retinal, often carrying the stabilizing counterion, like E113 in rhodopsin. Projected on the dark state structure of these four rhodopsins, some important structural rearrangements upon retinal isomerization (cis-to-trans for mammalian rhodopsin, trans-to-cis for prokaryotic rhodopsins), observed in TR-SFX studies in the picosecond range, are indicated with a red arrow. The disruption of these important interactions weakens the stabilization of the retinal chromophore by TM3/helix C.

Comment in

References

    1. Hofmann KP, et al. A G protein-coupled receptor at work: the rhodopsin model. Trends Biochem. Sci. 2009;34:540–552. doi: 10.1016/j.tibs.2009.07.005. - DOI - PubMed
    1. Schoenlein RW, Peteanu LA, Mathies RA, Shank CV. The first step in vision: femtosecond isomerization of rhodopsin. Science. 1991;254:412–415. doi: 10.1126/science.1925597. - DOI - PubMed
    1. Branden G, Neutze R. Advances and challenges in time-resolved macromolecular crystallography. Science. 2021;373:eaba0954. doi: 10.1126/science.aba0954. - DOI - PubMed
    1. Sakmar TP, Franke RR, Khorana HG. Glutamic acid-113 serves as the retinylidene Schiff base counterion in bovine rhodopsin. Proc. Natl Acad. Sci. USA. 1989;86:8309–8313. doi: 10.1073/pnas.86.21.8309. - DOI - PMC - PubMed
    1. Palczewski K, et al. Crystal structure of rhodopsin: a G protein-coupled receptor. Science. 2000;289:739–745. doi: 10.1126/science.289.5480.739. - DOI - PubMed

Publication types

MeSH terms