. 2023 May;10(14):e2206812.
doi: 10.1002/advs.202206812. Epub 2023 Mar 22.

Profiling of Circulating Tumor Cells for Screening of Selective Inhibitors of Tumor-Initiating Stem-Like Cells

Affiliations

Profiling of Circulating Tumor Cells for Screening of Selective Inhibitors of Tumor-Initiating Stem-Like Cells

Chia-Lin Chen et al. Adv Sci (Weinh). 2023 May.

Retraction in

Abstract

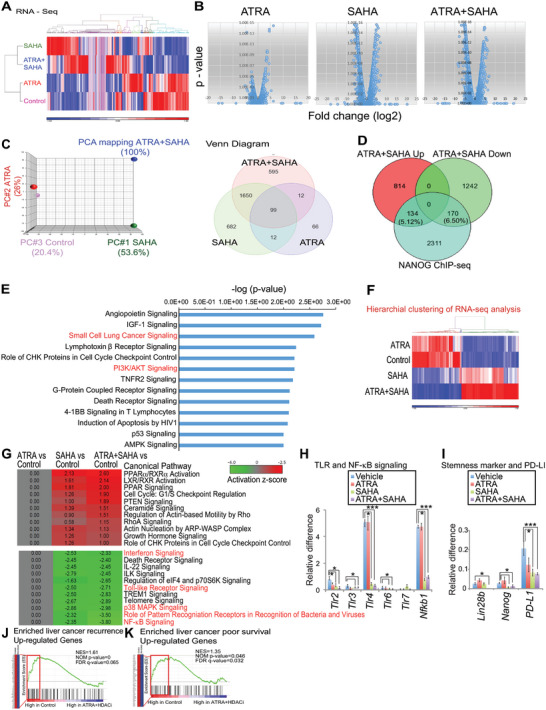
A critical barrier to effective cancer therapy is the improvement of drug selectivity, toxicity, and reduced recurrence of tumors expanded from tumor-initiating stem-like cells (TICs). The aim is to identify circulating tumor cell (CTC)-biomarkers and to identify an effective combination of TIC-specific, repurposed federal drug administration (FDA)-approved drugs. Three different types of high-throughput screens targeting the TIC population are employed: these include a CD133 (+) cell viability screen, a NANOG expression screen, and a drug combination screen. When combined in a refined secondary screening approach that targets Nanog expression with the same FDA-approved drug library, histone deacetylase (HDAC) inhibitor(s) combined with all-trans retinoic acid (ATRA) demonstrate the highest efficacy for inhibition of TIC growth in vitro and in vivo. Addition of immune checkpoint inhibitor further decreases recurrence and extends PDX mouse survival. RNA-seq analysis of TICs reveals that combined drug treatment reduces many Toll-like receptors (TLR) and stemness genes through repression of the lncRNA MIR22HG. This downregulation induces PTEN and TET2, leading to loss of the self-renewal property of TICs. Thus, CTC biomarker analysis would predict the prognosis and therapy response to this drug combination. In general, biomarker-guided stratification of HCC patients and TIC-targeted therapy should eradicate TICs to extend HCC patient survival.

Keywords: alcohol; hepatocellular carcinoma (HCC); tumor-initiating stem-like cells (TIC).


Conflict of interest statement

The authors declare no conflict of interest.

Figures

Figure 1
Figure 1
TIC‐selective inhibitor combination HDACi+ATRA treatment eradicates HCC in vitro. A) Schematic diagram of drug screenings. To find the most effective inhibitors of TICs, we conducted three different drug screenings, CD133 cell viability screening (Figure 1B–E), Nanog‐GFP reporter cell screening (Figure 1F) and drug combination screening (Figure 1G). B) For CD133 cell viability screening, human HCC cell line, freshly passaged Huh7 was sorted into two populations, CD133 (+) and (‐) cells. Huh7 cells consistently have 50–60% CD133 (+) cells (B, right inset panel). C) For CD133 cell viability screening, most compounds tested showed similar effects on CD133 (+) and CD133 (‐) cells (R 2 = 0.8), while two compounds (red dots) showed specific growth inhibition effects on CD133 (+) but not CD133 (‐) cells. One drug is all‐trans retinoic acid (ATRA) and the other is the second‐generation derivative of retinoic acid, acitretin D) (n = 3, *p < 0.05). Note: SAHA alone did not specifically reduce viability, but ATRA combined with SAHA selectively killed CD133(+) cells. D) Measure of cell viability for CD133 (+) and CD133 (‐) after ATRA or acitretin treatment. Drug concentration: 10 µg mL‐1) (n = 3, * p < 0.05). E, left)‐For Nanog promoter‐GFP reporter screening, we established a reporter cell line by transducing lentiviral Nanog‐GFP reporter in TICs. After antibiotic selection, the reporter cells were sorted into high (top 20%) and low (bottom 20%) GFP expression. (Right panel) The sorted GFPhigh population has higher levels of Nanog mRNA when compared to that of low population, judged by RT‐qPCR (n = 3, *p < 0.05). E, Right) Z‐score distribution of drug library candidates (not specified). Candidates selected for repression of Nanog had a z‐score < ‐1.0. F) Combination of ATRA with SAHA identified by NANOG expression screening showed the dramatic killing effect in all three human HCC cell lines (Huh7, HepG2, and Hep3B cells). G, Left) Combination treatment inhibited the self‐renewal ability of TICs. We performed anchorage independent colony formation assay. The drug treatment combination reduced spheroid size and number (Right) and significantly reduced colony number. Right) Numbers of colonies per well after drug treatment are shown. H) The drug combination of ATRA and HDAC inhibitor (HDACi: SAHA) showed growth inhibition effect in various HCC cells, such as Huh7, Hep3B, HepG2, human TICs, and mouse TICs. The normal adult stem cells (mouse mesenchymal stem cells) were less sensitive to this drug treatment. Combination of ATRA with SAHA identified by NANOG expression screening showed the dramatic killing effect in all four HCC cells. n = 3, * p < 0.05). I) General HDAC drug inhibition of tumor growth when coadministered with ATRA. Validation of other HDAC inhibitor effects on TIC self‐renewal ability by using colony formation assays, indicating that this was not a SAHA‐specific effect, but generalizable to other HDACi.
Figure 2
Figure 2
Genome‐wide transcriptome analysis identifies downregulation of stemness, TLR and NF‐κB signaling in drug treated TICs. A) To comprehensively illustrate the regulatory networks affected by drug treatment, we performed RNA sequencing of TICs treated singly with ATRA or SAHA or in combination. The gene expression heat map is shown. B) Gene expression profiles are shown. C) (Left) Principal component analysis (PCA) of RNA sequencing data shows that the gene expression pattern of ATRA treatment only (red) is relatively similar to control (purple). Moreover, the gene expression pattern of SAHA (HDACi) treatment only (green) or combination treatment (blue) is quite different from the control group. (Right) Differential gene expression in the three treatment groups presented as a Venn diagram. This shows that there are unique sets of genes in the drug combination groups, which are particular interest for further study (Fig. 2F).  D) The Venn diagram shows that ATRA+SAHA combination affected 12% of Nanog target genes (134 + 170 genes) that are highly associated with regulation of cell cycle and cell survival pathways of TICs. E) Gene ontology (GEO) analysis refers specifically to the 134 + 170 NANOG‐target genes (identified by NANOG CHIP‐seq) that were altered by ATRA + HDACi. The GEO analysis was done with ingenuity pathway analyses (IPA). F) Heat map of differential gene expression patterns showing unique sets of genes activated in response to individual drug treatments and dual drug combination. G) GSEA analysis and the gene network(s) subject to regulation by drug combination treatment showed that the drug combination treatment down‐regulated the Toll‐like receptors, the NF‐κB and p38/MAPK pathways. H–I) Individual drugs or their combination inhibit TLRs pathways and stemness. Data from genome‐wide transcriptome analysis of drug treated TICs. Quantitative RT‐PCR analyses confirmed that TLR2, 3, 4 and 6 were significantly downregulated by HDAC inhibitor treatment. The gene expression of ATRA+HDACi‐treated TICs. HDACi or HDACi+ATRA treatment reduced stemness. J) GSEA analysis showed that tumor recurrence‐associated gene set was highly enriched in the control group, but not in the combination treatment group. This result indicates the combination treatment suppressed the recrudescence‐associated gene set. GSEA of recurrent patient data correlated with changes observed in ATRA‐SAHA treated human HCC cell line. These data are for mice. K) GSEA analysis shows that the genes associated with poor survival were highly enriched in the control group, but not in the combination group. These data indicated the drug combination treatment correlated with increased survival rate.
Figure 3
Figure 3
Biomarker‐guided chemotherapy with immunotherapy eradicates tumors, reduced recurrence and predicts mouse survival. A, Top) Experimental procedures and survival rates of xenotransplanted HCC mice (PDX). Single and ATRA + SAHA combination drug treatments are indicated with corresponding survival (left), tumor mass (middle), and alternative combination treatment of ATRA + romidepsin (right). Mice were orthotopically implanted with HCC and were maintained for 240 d. Moribund mice were euthanized as per institutional guidelines. (Far right) Representative liver images are shown. ATRA+HDACi treatment reduced tumor development. B) Survival rates of xenotransplanted HCC mice (PDX). Summary of in vivo tumor treatments with ATRA+SAHA and ATRA+romidepsin. Four patient tumors (randomly selected) in each of the three groups (HCV, alcohol, neither—effect) were included. Total of 20‐32 PDX mice were used for each group. C) Schematic of patient‐derived xenograft (PDX) mouse treatments by use of huCD34‐NSG‐SGM3 mice. Animals were treated with ATRA+HDACi (Romidepsin) and α‐PD‐L1 (D) Tumor volumes of tumor‐bearing mice that were subcutaneously injected with TICs. A total of 20‐32 humanized NSG‐SGM3 mice were used for each group. E) Schematic representation of the procedures for RT‐qPCR analyses of CTCs from HCC patient blood. Humanized mice engrafted with tumors enabled in vivo investigation of the interactions between the human immune system and human HCC. Biomarker‐guided personalized medicine approaches were verified in PDX mouse by use of CTC‐mRNA biomarker profiling. F) RT‐qPCR scoring of stemness signature genes in human CTC enriched from HCC patient blood. Genes used for scoring were based on prior published studies.[ 12 , 13 , 14 ] G) Survival comparison of xenotransplanted HCC mice (PDX). Humanized mice engrafted with tumors enabled in vivo investigation of the interactions between the human immune system and human HCC. Five different sourced PDX tumors were implanted into five different NSG‐SGM3 mice and used for this experiment (n = 5 PDX × 5 patients = 25 PDX mice/group). RT‐qPCR scoring of stemness signature genes in human CTCs enriched from HCC patient blood. Mice were orthotopically implanted with HCC with low‐stemness signature (Bottom) and high stemness signature (Top) as indicated and were maintained for 88 d. Moribund mice were euthanized as per institutional guidelines. H) Tumor mass was reduced by sorafenib or regorafenib, but larger portions were still maintained, indicating that standard care therapy sorafenib treatment did not effectively reduce tumor sizes. I) PDX mouse survival implanted with HCCs from patients with (Top) high‐stemness‐CTC and low‐stemness‐CTC (Bottom). ATRA+HDACi significantly improved PDX mouse survival rate. J) Immunostaining images of tumors after treatment. CD3+ cells were visualized in PDX tissue sections that were collected from PDX mice after drug treatments. CD14 staining serves as specificity control staining. K) Immunoblot evidence from the PDX tumors of increases in PTEN / TET2 / P‐FOXO that recapitulated in vitro data. L) HDACi+ATRA treatment with anti‐PD‐L1 therapy eradicated HCC and further extended PDX mouse survival. Percent survival of PDX‐SGM3 PDX mice. Total of 20‐32 PDX mice were used for each group.
Figure 4
Figure 4
HDAC inhibitor monitored for ATRA‐mediated differentiation signal reduces ncRNA miR22hg and deactivates their depressors for PTEN and TET2. A) RNA‐seq histogram reads showed that miR‐22 and miR‐22 host gene (miR22hg) were down‐regulated by the combination drug treatment (bottom row). MIR22HG promoter region is on right side of graphs. B) Silencing of human miR22hg significantly reduced TIC growth (n = 3, *p < 0.05). C) Silencing of human miR22hg significantly reduced Nanog expression (n = 3, *p < 0.05). D) Silencing of human miR22hg significantly reduced the number of spheroids (n = 3, *p < 0.05). E) Silencing of human miR22hg significantly reduced the number of colonies appearing in soft agar assay (n = 4, ***p < 0.001). Lower panel‐colony counts for scrambled and sh‐miR‐22hg treatments. F) Silencing by sh‐miR22hg rendered TICs more susceptible to conventional chemotherapy drugs (sorafenib or rapamycin) (n = 3, * P < 0.05). G) (Top) GSEA analysis showed that miR‐22 target gene set was highly enriched in the control group, but not the drug combination group (ATRA+SAHA: orange bars). GSEA analysis showed that the upregulated gene set in miR‐22 target gene was reduced in ATRA+SAHA treatment group. (Bottom) GSEA analysis showed that the up‐regulated gene set in response to Rapamycin was similar to genes upregulated by ATRA+SAHA. We compared this to genes with higher mRNA expression in ATRA + SAHA group. H) Drug combination induced expression of both Tet2 mRNA (Top) and protein level (Bottom) (n = 3, *p < 0.05). I) (Top left) miR‐22 target sites of human and mouse TET2 and complementarity to miR‐22. (Bottom left) Drug combination treatment activated the TET2 3’UTR luciferase reporter in TICs (n = 3, *p < 0.05). (Right) Relative reporter (luciferase) levels in response to drug treatment in the presence and absence of sh‐miR22hg or sh‐scrambled. (Right) Introduction of mutation in miR22‐binding site or miR22hg silencing reduced ATRA+SAHA‐mediated TET2B induction judged by TET2B luciferase reporter assays.
Figure 5
Figure 5
HDAC inhibitor with differentiation signal induced the PTEN pathway in CD133 (+) cells that highly express NANOG and miR‐22. A) (Left top) miR‐22 similarity of 5’UTR regions of mouse Pten and human PTEN. (Right) Drug combination treatment activated the PTEN 3’UTR luciferase reporter in Huh7 cells (n = 3, ***p < 0.001). B) CRISPR/Cas9‐mediated knockout of PTEN and restoration of PTEN wild type (non‐template CRISPR‐treated control) and mutant (PTEN.C124S: phosphatase active site mutant) were confirmed by immunoblots. C) PTEN inhibits MIR22HG mediated self‐renewal of TICs via its phosphatase domain. D) Effect of MIR22HG silencing on PTEN and TET2 in was confirmed by immunoblot analyses. E) Spheroid production assay. Silencing PTEN and TET2 restored self‐renewal ability of TICs transduced with shRNA targeting MIR22HG. F) Cell viability assay. Silencing PTEN rescued ATRA+SAHA‐mediated killing of TICs transduced with shRNA against MIR22HG. G) (Left) Overexpression of PTEN and/or TET2 in TICs was confirmed by Western blot analyses. (Right) Overexpression of PTEN and TET2 in TICs with MIR22HG overexpression restored killing activity of TICs in response to ATRA + HDAC inhibitor treatment. H) CD133 (+) and PTEN expression. In contrast to CD133 (‐) cells, CD133 (+) cells expressed less PTEN. However, the drug combination treatment induced PTEN, p15, p21 and ALBUMIN expression (n = 3, *p < 0.05, **p < 0.01, ***p < 0.001). I) Western blot data showing that the drug combination induced PTEN expression, leading to suppression of AKT phosphorylation and induction of FOXO1/3/4. Inset shows logic of this experiment. J) Schematic of FOXO activation by the drug combination treatment induced cyclin‐dependent kinase inhibitors, p15INK4b, p19INK4d, p21Cip1 and p27Kip1, leading to suppression of cyclins (Cyclin E and Cyclin D1) and cyclin‐dependent kinases (CDK2). Inset‐wWestern blot of various cell cycle proteins. K) Activation of FOXO induced by drug combination activated the BIM apoptosis pathway. Inset‐Western blot shows drug treatment increased BIM expression best with drug combination.
Figure 6
Figure 6
HDAC inhibitor with differentiation signal induces TET2 and reprograms DNA methylation of NANOG promoter in tumor‐initiating stem‐like cells. Al, Left) Dual drug combination downregulated OCT4 and the upstream regulator of p53, SIRT1. In contrast, the drug combination induced p53, TET2 and DNMT3A. (right) Dot blots of 5‐hmC and TET levels in TICs and primary hepatocytes. B) Immunofluorescence detection of NANOG, TET2, P53 and DNMT3A in cells in the presence or absence of ATRA and/or SAHA drug treatments, as indicated. C) Quantitation of fluorescent signals for NANOG, p53, TET2 and DNMT2A from immunofluorescent images. D) Drug combination altered DNA methylation of Nanog promoter in human HCC cell line. Bisulfite sequencing of the Nanog promoter in TICs in the presence or absence of ATRA and/or HDACi treatment. Under basal conditions, the p53‐binding site of the Nanog promoter was hypermethylated; however, the OCT4 binding site was hypomethylated. Drug combination treatment reduced the methylation of the p53 binding site of Nanog, but increased the methylation of OCT4 binding site of Nanog (* p < 0.05). E) ChIP‐qPCR showed TET2 and p53 recruitment to the Nanog promoter, but DNMT3A was displaced from the Nanog promoter by drug combination treatment. By comparison, DNMT3A was recruited to the OCT4 binding site but TET2 and p53 were absent from the Nanog promoter after drug combination treatment (n = 3, * p < 0.05). F) Human HCC showed lower levels of TET2 expression and reduced levels of 5hmC. (Inset) quantitation of immunoreactivity of non‐tumor and tumor cells for TET2 in response to drug treatments. G) Hypothetical models for biomarker‐guided combination therapy targeting of TICs: Presence of stemness markers in patient blood‐derived CTCs is predictive for effective tumor reduction in response to the proposed ATRA+HCACi therapy. Schematic representation of the procedures for CTC mRNA profiling from HCC patient blood. Combined drug treatment down‐regulates miR‐22, leading to activation of PTEN‐FOXO apoptosis pathway and TET‐mediated demethylation of p53‐binding sites within the Nanog promoter. Specifically, TET2 is recruited to p53‐binding sites of the Nanog promoter while DNMT3A is recruited for methylation of the OCT4 binding site within the Nanog promoter. Antagonism of factor binding by DNA methylation leads to repression of Nanog.

References

    1. Zhou B.‐B. S., Zhang H., Damelin M., Geles K. G., Grindley J. C., Dirks P. B., Nat. Rev. Drug Discovery 2009, 8, 806. - PubMed
    1. Chen C.‐L., Uthaya Kumar D. B., Punj V., Xu J., Sher L., Tahara S. M., Hess S., Machida K., Cell Metab. 2016, 23, 206. - PMC - PubMed
    1. Suetsugu A., Nagaki M., Aoki H., Motohashi T., Kunisada T., Moriwaki H., Biochem. Biophys. Res. Commun. 2006, 351, 820. - PubMed
    1. Ma S., Lee T. K., Zheng B.‐J., Chan K. W., Guan X.‐Y., Oncogene 2008, 27, 1749. - PubMed
    1. Finn R. S., Qin S., Ikeda M., Galle P. R., Ducreux M., Kim T.‐Y., Kudo M., Breder V., Merle P., Kaseb A. O., Li D., Verret W., Xu D.‐Z., Hernandez S., Liu J., Huang C., Mulla S., Wang Y., Lim H. Y, Zhu A. X., Cheng A.‐L., N. Engl. J. Med. 2020, 382, 1894. - PubMed

Publication types