. 2023 Mar 22;11(1):49.
doi: 10.1186/s40478-023-01543-8.

Localized microglia dysregulation impairs central nervous system myelination in development

Affiliations

Localized microglia dysregulation impairs central nervous system myelination in development

Rebecca K Holloway et al. Acta Neuropathol Commun. .

Abstract

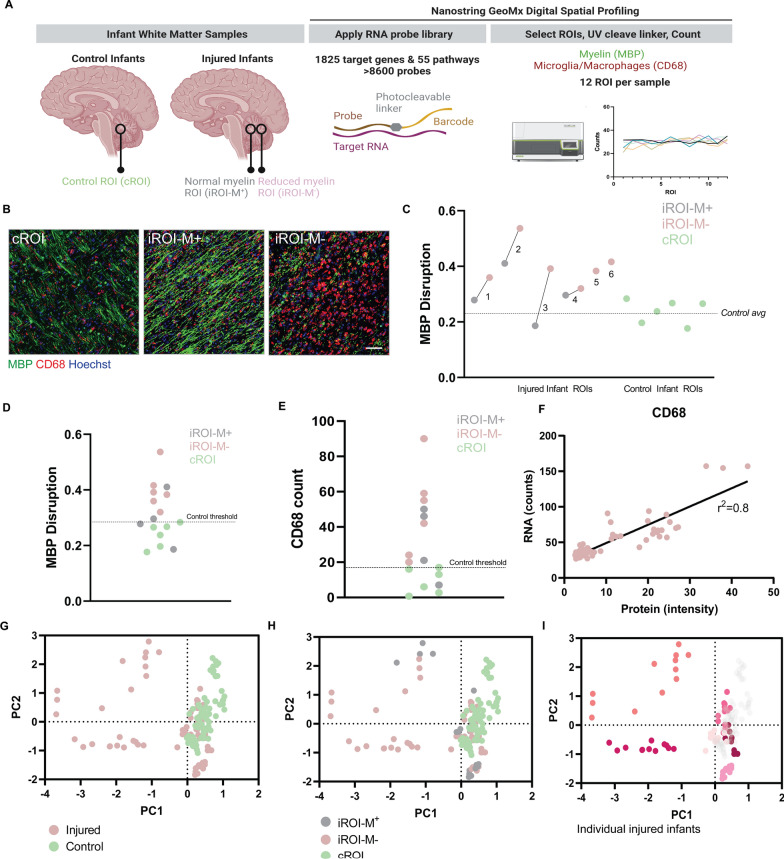
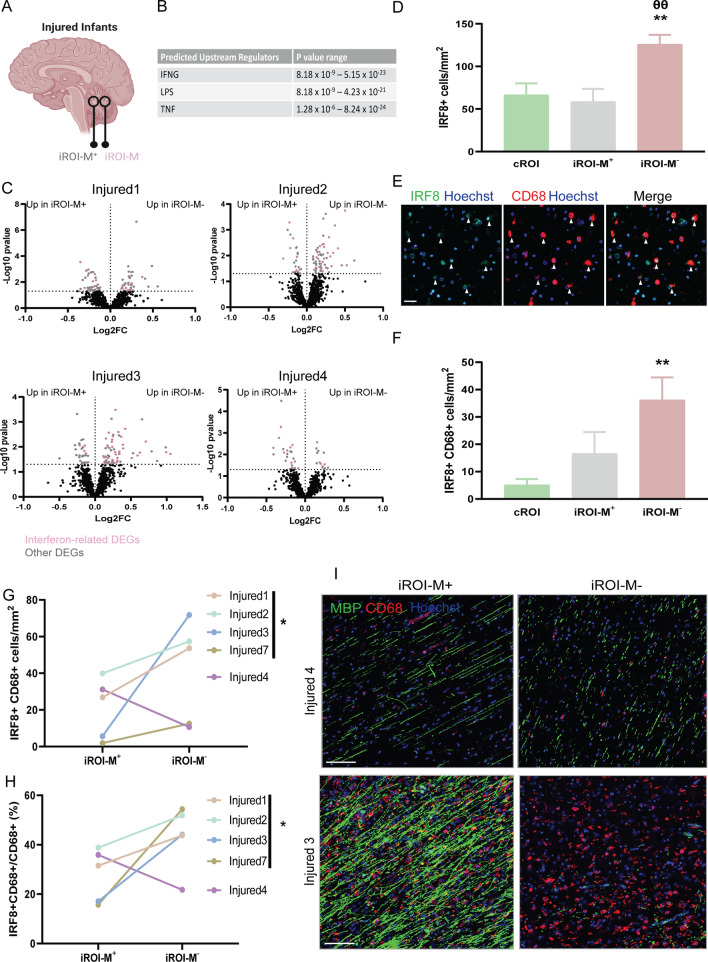
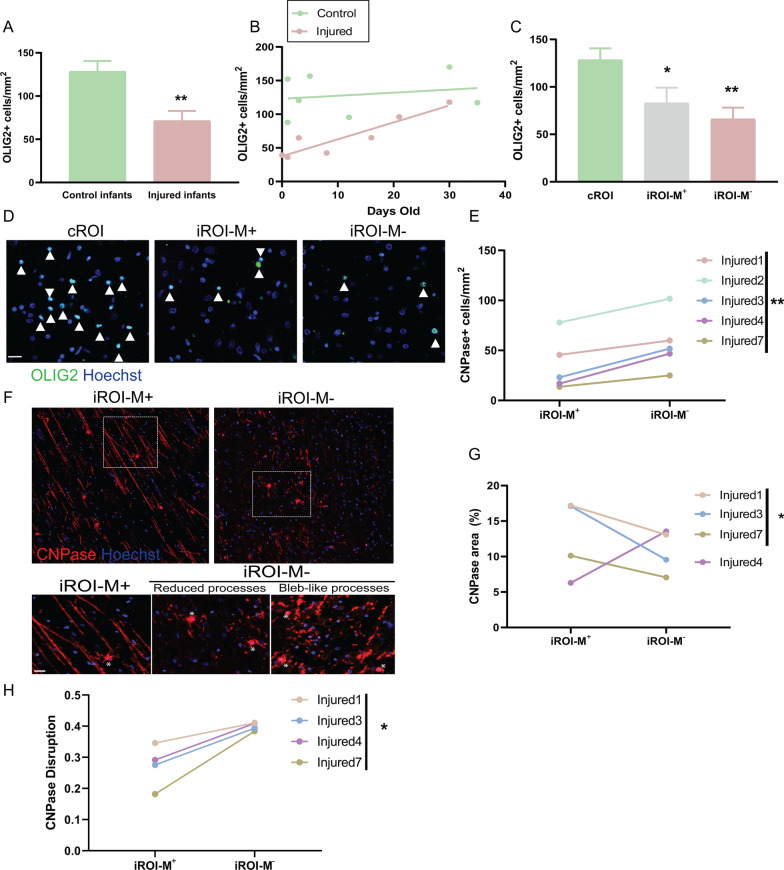
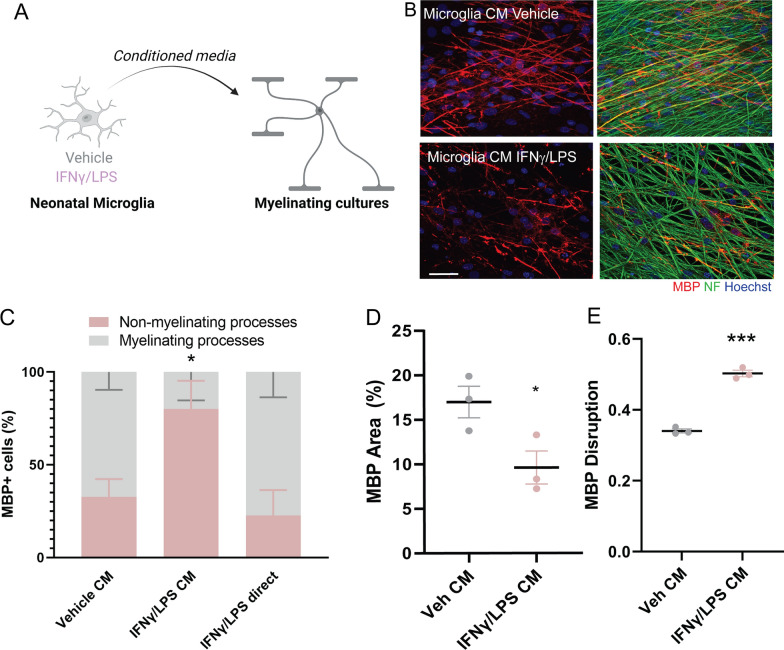
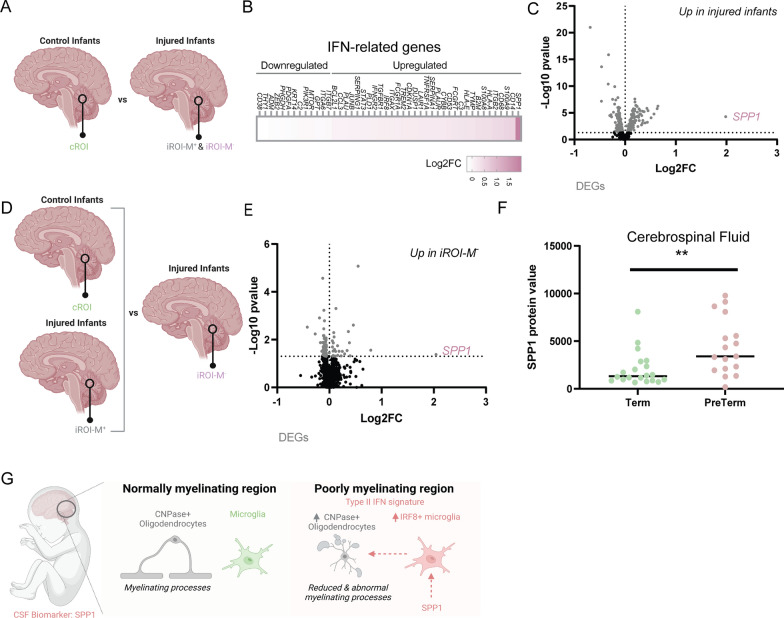
Myelination of neuronal axons is a critical aspect of central nervous system development and function. However, the fundamental cellular and molecular mechanisms influencing human developmental myelination and its failure are not fully understood. Here, we used digital spatial transcriptomics of a rare bank of human developing white matter to uncover that a localized dysregulated innate immune response is associated with impeded myelination. We identified that poorly myelinating areas have a distinct signature of Type II interferon signalling in microglia/macrophages, relative to adjacent myelinating areas. This is associated with a surprising increase in mature oligodendrocytes, which fail to form myelin processes appropriately. We functionally link these findings by showing that conditioned media from interferon-stimulated microglia is sufficient to dysregulate myelin process formation by oligodendrocytes in culture. We identify the Type II interferon inducer, Osteopontin (SPP1), as being upregulated in poorly myelinating brains, indicating a potential biomarker. Our results reveal the importance of microglia-mature oligodendrocyte interaction and interferon signaling in regulating myelination of the developing human brain.

Keywords: Microglia; Myelin; Neuroinflammation; Oligodendrocyte; White matter.


Conflict of interest statement

LY, KT, and YL are employees of Nanostring, Inc.

Figures

Fig. 1
Fig. 1
Digital spatial transcriptomic profiling of human developmental white matter. A Diagram of experimental approach. Regions of interest (ROI) were assessed in infant brain white matter samples (cerebellum), with control ROI (cROI) in control infants compared to ROI in injured infants (iROI) which were normally myelinating (iROI-M+) or showed reduced myelination (iROI-M). A probe library targeting 1825 genes in 55 pathways was applied to the tissue, and 12 ROIs were selected per sample based on levels of myelin basic protein (MBP; green) and microglia/macrophages (CD68; red), counterstained with Hoechst (cyan). Probes were cleaved with UV light and RNA counts performed per ROI. B Example ROIs from cROI, iROI-M+, and iROI-M stained for MBP (green) and CD68 (red) and counterstained for Hoechst (blue). Scale bar, 65 µm. C MBP Disruption as measured by average MBP Sphericity per infant in injured iROI-M+ (grey), iROI-M (pink) and cROI (green). D MBP Disruption as measured by average MBP Sphericity in all infant ROIs, with highest level in control indicated as threshold (dotted line). E Average CD68 count in all infant ROIs, with highest level in control indicated as threshold (dotted line). F CD68 RNA counts versus CD68 protein intensity measurements in respective injured samples. N = 6 infants, n = 71 ROI. Goodness of fit, r2 = 0.8. Slope is significantly non-zero, P < 0.0001. G Principal component analysis (PCA) plot of ROI from control infants (cROI; green) and injured infants (iROI; pink). H PCA plot of cROI (green), iROI-M+(grey), and iROI-M (pink). I PCA plot of all ROI showing individual injured cases in distinct colours
Fig. 2
Fig. 2
Type II interferon pathway engagement in microglia/macrophages in poorly myelinating regions of developing white matter. A Diagram of approach comparing iROI-M+ and iROI-M from respective samples. B Ingenuity Pathway Analysis (IPA) of genes differentially expressed between iROI-M+ and iROI-M indicated predicted upstream regulators IFNG, LPS, and TNF, which are part of the Type II interferon response. C Volcano plots of iROI-M+ and iROI-M in injured infants, with non-interferon-related differentially expressed genes in grey, and interferon-related differentially expressed genes in pink. D IRF8 + cells per mm2 in cROI (n = 7 infants), iROI-M+ (n = 5 infants) and iROI-M (n = 8 infants). Unpaired 2-tailed Student’s t-test, **P = 0.0046 for iROI-M versus cROI, θθ P = 0.0037 for iROI-M versus iROI-M+. E Representative images of IRF8 (green) and CD68 (red) double positive cells in injured regions (arrowheads), counterstained for Hoechst (blue). Scale bar, 20 µm. F Mean IRF8 + CD68 + cells/mm2 in cROI (n = 7 in fants), iROI-M+ (n = 5 infants) and iROI-M (n = 8 infants). Unpaired 2-tailed Student’s t-test, **P = 0.0046 for iROI-M versus cROI. G Mean IRF8 + CD68 + cells per mm2 in iROI-M+ versus iROI-M. Paired 2-tailed Student’s t-test, *P = 0.0409, n = 4 infants. H Percentage of CD68 + cells which are IRF8 + in iROI-M+ versus iROI-M. Paired 2-tailed Student’s t-test, *P = 0.0363, n = 4 infants. I Representative images of myelin (MBP; green) and microglia/macrophages (CD68; red) in infant with good myelination in iROI-M (infant 4) versus infant with poor myelination, counterstained for Hoechst (blue) in iROI-M (infant 3). Scale bar, 100 µm
Fig. 3
Fig. 3
Oligodendrocyte lineage responses in poorly myelinating developing white matter. A Mean oligodendrocyte lineage cell (OLIG2 +) number per mm2 in control (n = 7 infants) and injured (n = 8 infants) cases. Unpaired 2-tailed Student’s t-test, **P = 0.0044. B OLIG2 + cells per mm2 in control (green) and injured (pink) infants versus age (days old), in infants born at term. N = 7 infants per group. C OLIG2 + cells per mm2 in cROI (n = 7 infants), iROI-M+ (n = 5 infants), versus iROI-M (n = 8 infants). Unpaired 2-tailed Student’s t-test, **P = 0.0028 for cROI versus iROI-M, *P = 0.0423 for cROI versus iROI-M+. D Representative images of OLIG2 + cells (green) in cROI, iROI-M+, and iROI-M, indicated by arrowheads. Nuclei counterstained with Hoechst (blue). Scale bar, 20 µm. E Mean CNPase + cells per mm2 in iROI-M+ versus iROI-M. Paired 2-tailed Student’s t-test, **P = 0.0046. n = 5 infants. F Representative images of CNPase + cells (red) in iROI-M+ and in iROI-M, showing reduced and bleb-like processes in the latter. Nuclei counterstained with Hoechst (blue). Cell bodies indicated by asterisks. Scale bar, 20 µm. G Percentage of CNPase + area in iROI-M+ versus iROI-M in term infants (excluding pre-term Infant 2). Paired 2-tailed Student’s t-test, *P = 0.0478, n = 3 infants. H CNPase Disruption as measured by sphericity in iROI-M+ versus iROI-M in term infants. Paired 2-tailed Student’s t-test, *P = 0.0215, n = 4 infants
Fig. 4
Fig. 4
Interferon-responsive microglia functionally impede myelination by mature oligodendrocytes. A Diagram of treatment of neonatal microglia cultures with IFNγ and LPS, or vehicle control, and application of conditioned media to myelinating cultures of oligodendrocytes and neurons. B Representative images of cultures exposed to conditioned media (CM) from vehicle (PBS)-treated microglia or IFNγ and LPS-treated microglia, with myelin indicated by MBP (red), axons indicated by NF (green), and nuclei counterstained with Hoechst (blue). Scale bar, 25 µm. C Percentage of oligodendrocytes (MBP +) which have myelinating processes (grey) versus non-myelinating processes (pink) following treatment with CM from vehicle-treated or IFNγ/LPS-treated microglia, or with IFNγ/LPS directly applied to myelinating cultures. Unpaired 2-tailed Student’s t-test, *P = 0.0428 for non-myelinating processes, and *P = 0.0428 for myelinating processes, for IFNγ/LPS CM versus Veh CM. N = 3 biologically independent repeats. D Percentage of MBP area in myelinating cultures exposed to vehicle (Veh) or IFNγ/LPS-treated microglia CM. Unpaired 2-tailed Student’s t-test, *P = 0.0455. N = 3 biologically independent repeats. E MBP Disruption as measured by sphericity in myelinating cultures exposed to Veh or or IFNγ/LPS treated microglia CM. Unpaired 2-tailed Student’s t-test, ***P = 0.0001. N = 3 biologically independent repeats
Fig. 5
Fig. 5
Osteopontin as a biomarker for poor myelination in developing white matter. A Diagram of comparison between control infant iROI (cROI) and injured infant ROI (iROI-M+ and iROI-M). B Heatmap of IFN-associated DEGs in injured versus control infants, indicated as Log2FC. C Volcano plot of DEGs in injured versus control infants indicated in grey. Osteopontin (SPP1) is indicated in pink (P = 0.0005). N = 6 control infants and 6 injured infants. D Diagram of comparison between normally myelinating areas (control infant cROI and injured infant iROI-M+) versus poorly myelinating areas (injured infant iROI-M). E Volcano plot of differentially expressed genes in iROI-M versus cROI/iROI-M+, indicated in grey. Osteopontin (SPP1) is indicated in pink (P = 0.04213). N = 6 control infants and 6 injured infants. F Levels of SPP1 protein in cerebrospinal fluid of term controls and infants at high risk of brain white matter damage (preterm). Mann–Whitney test, **P = 0.0031, n = 20 term infants and 17 preterm infants. G Graphical abstract: Compared to normally myelinating regions of infant brain, poorly myelinating regions have a Type II interferon signature associated with increased interferon-responsive microglia (IRF8 +), increased CNPase + oligodendrocytes which produce less myelin and abnormal myelin, and increased interferon-inducer SPP1—also detectable in cerebrospinal fluid of infants at high risk of brain injury

References

    1. Albertsson AM, Zhang X, Leavenworth J, Bi D, Nair S, Qiao L, Hagberg H, Mallard C, Cantor H, Wang X. The effect of osteopontin and osteopontin-derived peptides on preterm brain injury. J Neuroinflamm. 2014;11:197. doi: 10.1186/s12974-014-0197-0. - DOI - PMC - PubMed
    1. Bacmeister CM, Barr HJ, McClain CR, Thornton MA, Nettles D, Welle CG, Hughes EG. Motor learning promotes remyelination via new and surviving oligodendrocytes. Nat Neurosci. 2020;23:819–831. doi: 10.1038/s41593-020-0637-3. - DOI - PMC - PubMed
    1. Beck KD, Powell-Braxton L, Widmer HR, Valverde J, Hefti F. Igf1 gene disruption results in reduced brain size, CN hypomyelination, and loss of hippocampal granule and striatal parvalbumin-containing neurons. Neuron. 1995;14:717–730. doi: 10.1016/0896-6273(95)90216-3. - DOI - PubMed
    1. Boardman JP, Ireland G, Sullivan G, Pataky R, Fleiss B, Gressens P, Miron V. The cerebrospinal fluid inflammatory response to preterm birth. Front Physiol. 2018;9:1299. doi: 10.3389/fphys.2018.01299. - DOI - PMC - PubMed
    1. Buser JR, Maire J, Riddle A, Gong X, Nguyen T, Nelson K, Luo NL, Ren J, Struve J, Sherman LS, et al. Arrested preoligodendrocyte maturation contributes to myelination failure in premature infants. Ann Neurol. 2012;71:93–109. doi: 10.1002/ana.22627. - DOI - PMC - PubMed

Publication types