. 2023 Jun;56(6):e13401.
doi: 10.1111/cpr.13401. Epub 2023 Mar 22.

Progression of irradiated mesenchymal stromal cells from early to late senescence: Changes in SASP composition and anti-tumour properties

Affiliations

Progression of irradiated mesenchymal stromal cells from early to late senescence: Changes in SASP composition and anti-tumour properties

Nicola Alessio et al. Cell Prolif. 2023 Jun.

Abstract

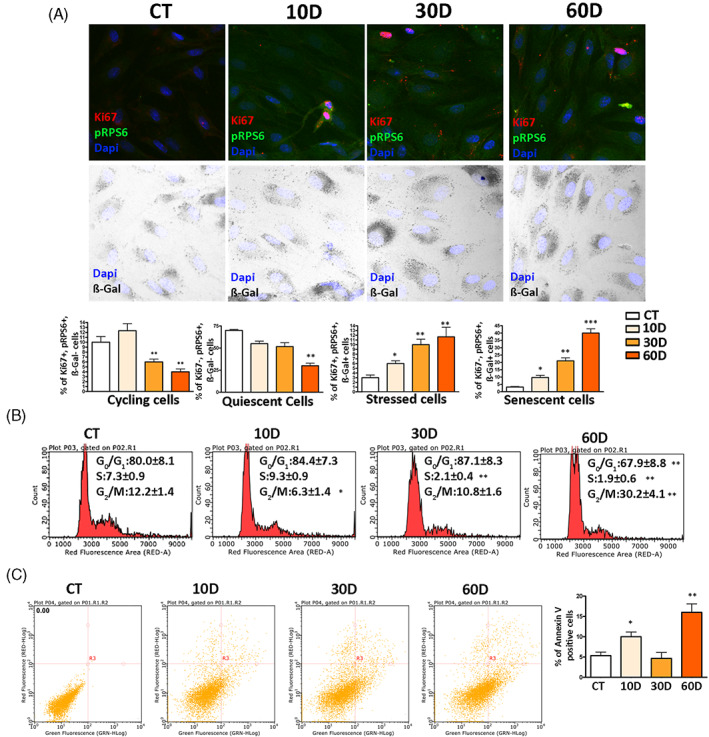
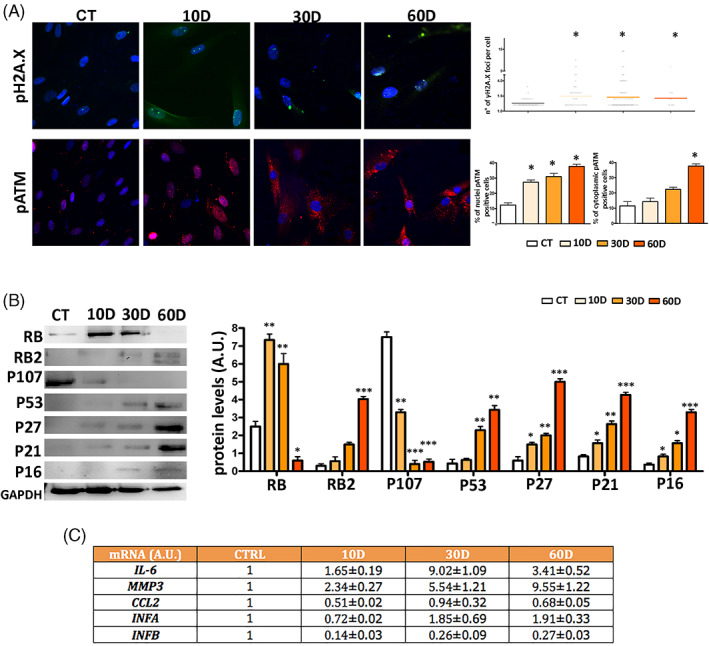
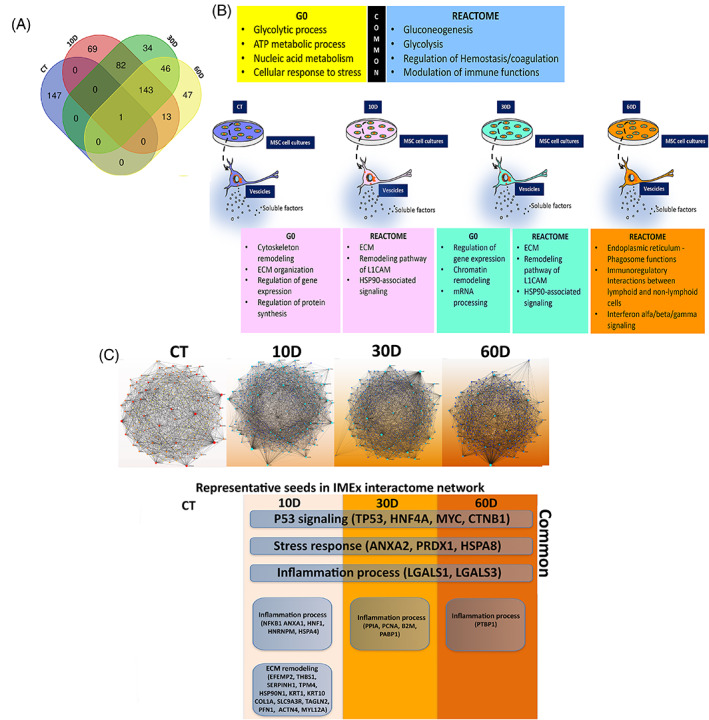
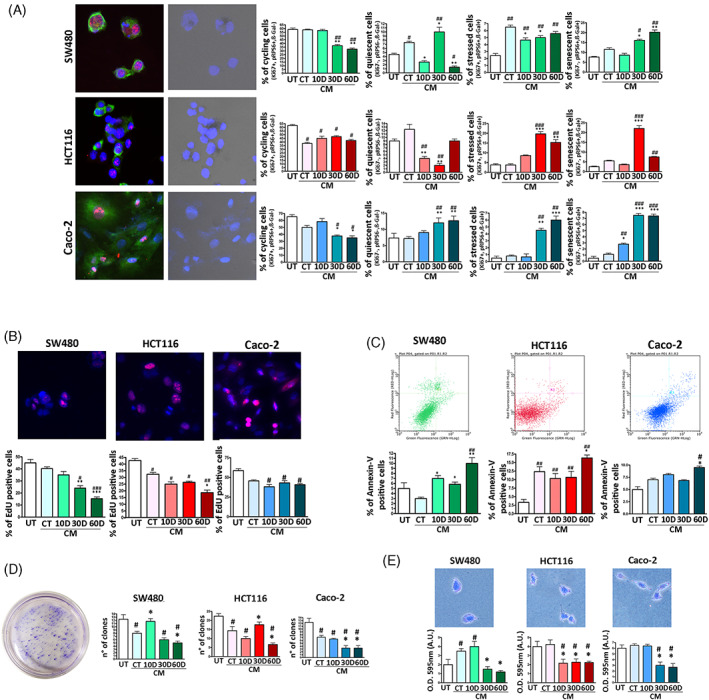
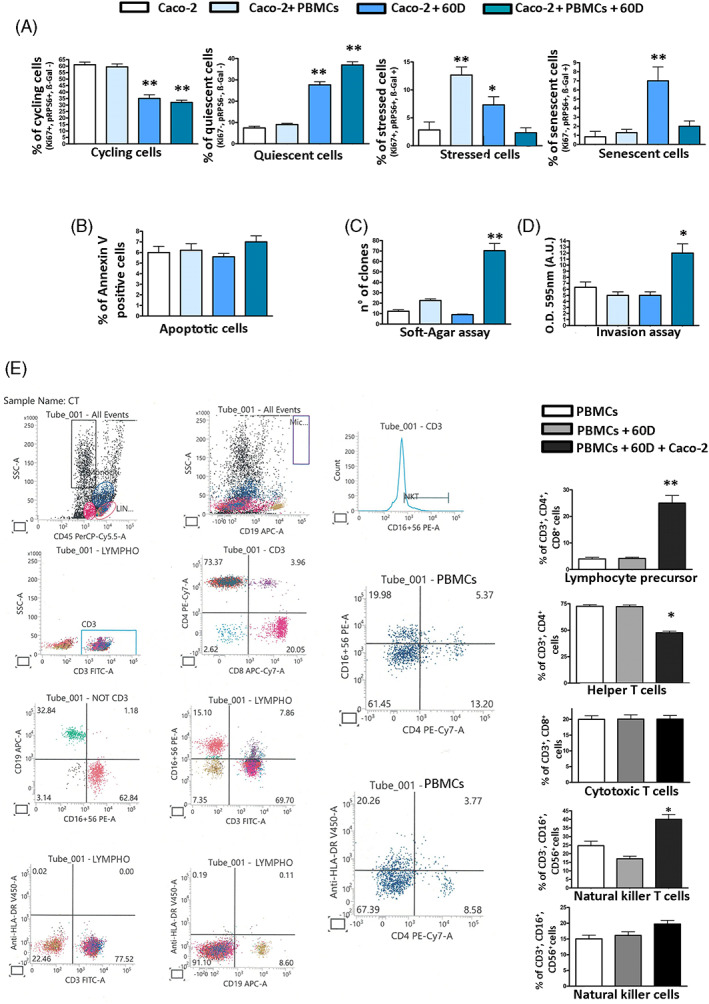
Genotoxic injuries converge on senescence-executive program that promotes production of a senescence-specific secretome (SASP). The study of SASP is particularly intriguing, since through it a senescence process, triggered in a few cells, can spread to many other cells and produce either beneficial or negative consequences for health. We analysed the SASP of quiescent mesenchymal stromal cells (MSCs) following stress induced premature senescence (SIPS) by ionizing radiation exposure. We performed a proteome analysis of SASP content obtained from early and late senescent cells. The bioinformatics studies evidenced that early and late SASPs, besides some common ontologies and signalling pathways, contain specific factors. In spite of these differences, we evidenced that SASPs can block in vitro proliferation of cancer cells and promote senescence/apoptosis. It is possible to imagine that SASP always contains core components that have an anti-tumour activity, the progression from early to late senescence enriches the SASP of factors that may promote SASP tumorigenic activity only by interacting and instructing cells of the immune system. Our results on Caco-2 cancer cells incubated with late SASP in presence of peripheral white blood cells strongly support this hypothesis. We evidenced that quiescent MSCs following SIPS produced SASP that, while progressively changed its composition, preserved the capacity to block cancer growth by inducing senescence and/or apoptosis only in an autonomous manner.


Conflict of interest statement

The authors declare no competing interests.

Figures

FIGURE 1
FIGURE 1
Biological parameters of MSCs following x‐ray exposure. Panel A: representative images of cells stained to identify nuclei (DAPI), pRPS6, Ki67 and to determine β‐gal activity. The graphs show the percentage of cycling, quiescent, stressed and senescent cells. In each graph, the * indicates the statistical difference between CT, chosen as the reference, and the other time points. Data are shown with standard deviation (SD), n = 3 (*p < 0.05, **p < 0.01, ***p < 0.001). We used Leica CTR500 microscope equipped with a DCF3000G digital monochrome camera. The β‐gal activity was recorded as a grey‐stain with this setting. This experimental approach was used to identify in the same cell, a marker emitting a signal in the visible light (β‐gal) together with others expressing fluorescent signals. Panel B: Cell‐cycle profiles of samples collected at different time points following x‐ray treatment. The * indicates the statistical difference between CT, chosen as the reference, and the other time points. Data are shown with standard deviation (SD), n = 3 (*p < 0.05, **p < 0.01). Panel C: Flow cytometry chart of annexin V assay. The percentage of apoptotic cells is indicated in the associated right histogram. Data are shown with standard deviation (SD), n = 3 (*p < 0.05 and **p < 0.01 indicate statistical significance between the control and treated samples).
FIGURE 2
FIGURE 2
DNA damage/repair analysis and senescence‐associated signalling pathways. Panel A: Representative images of cells stained with anti‐pH2A.X (green) or pATM (red) are shown. Cell nuclei were stained with DAPI. Upper right: the graph shows the degree of pH2A.X foci per cell (n = 3 ± SD; *p < 0.05). The lower right graphs show the percentage of pATM positive cells. The protein is localized either within the nucleus or into cytoplasm (n = 3 ± SD; *p < 0.05). Panel B: A representative western blot analysis of RB/P105, RB2/P130, P107, P53, P27/KIP1, P21/CIP1, P16/INK4A and GAPDH (loading control) is shown. The right histogram reports the densitometric analysis of western blot bands. Panel C: The table reports the mRNA expression level of the indicated genes. The mRNA levels were normalized to GAPDH mRNA expression, which was selected as an internal control. For every mRNA, the change in the expression level is compared with control culture (CTRL), whose expression was fixed as 1. The symbols ***p < 0.001, **p < 0.01 and *p < 0.05 indicate statistical significance between the control and irradiated samples.
FIGURE 3
FIGURE 3
Gene Ontology and REACTOME analysis. Panel A: Venn diagram to identify common and specific SASP components among the different experimental conditions. Panel B: main GO and REACTOME outcomes. The SASP contained both factors, which were common among control and irradiated samples (see upper boxes), and proteins that were specifically present in a given sample (see lower boxes). Our analysis was carried out on whole secretomes containing soluble factors and molecules encapsulated within extracellular vesicles. Panel C: Network analysis. The top pictures show Minimum IMEx Interactome Networks with reduced complexity obtained by considering only seeds and their connecting nodes. The bottom images show representative seeds (node degree >20 and betweenness >200). Common: indicates seeds that are present in all irradiated samples (10D, 30D, 60D).
FIGURE 4
FIGURE 4
Biological parameters of cancer cells incubated with SASP. Panel A: SW480, HCT116 and Caco‐2 cells were incubated with different MSC secretomes as reported in methods. The histograms show the percentage of cycling, quiescent, stressed and senescent cells following secretome treatment. Representative images of cancer cells stained with DAPI (blue), pRPS6 (green) and Ki67 (red) are reported on the far left. In addition, the same images were analysed under a light microscope to determine β‐gal activity (black dots). Panel B: The histograms show the percentage of EdU positive cells in the different experimental conditions. Representative images of EdU (red) and DAPI (blue) staining are reported. Panel C: The histograms show the percentage of apoptotic cells as detected by flow cytometry Annexin V assay. Representative plots of apoptosis analysis are reported. Panel D: The histograms show the number of clones obtained in colony formation assay and the migration capacity of cancer cells, which was determined by crystal violet cell staining. An example of CFU assay is depicted. Panel E: The graphs show the results of invasion/migration assay performed on, SW480, HCT116 and Caco‐2 cancer cells. The migrated cells were stained with crystal violet and a quantitative evaluation of migration capacity was performed by measuring the optical density (O.D.) of the crystal violet stain at 595 nm. UT are the untreated cancer cells. The CT, 10D, 30D and 60D acronyms indicate cancer cultures incubated with conditioned media (CM) obtained from non‐irradiated (CT) and irradiated MSCs. For all the assays, the symbols ***p < 0.001, **p < 0.01 and *p < 0.05 indicate statistical significance between the CT, chosen as reference, and 10D, 30D, 60D. The symbols ###p < 0.001, ##p < 0.01 and #p < 0.05 indicate statistical significance between the UT, chosen as reference, and the other samples.
FIGURE 5
FIGURE 5
Effects of SASP and PBMCs on Caco‐2 cell biology. Panel A: Caco‐2 cells were incubated with 60D SASP and/or PBMCs as reported in methods. The histograms show the percentage of cycling, quiescent, stressed and senescent cells following this treatment. Panel B, C, D: Apoptosis, soft agar colony formation, and cell migration were evaluated on Caco‐2 cells treated as indicated in panel A. Panel E: representative plots of flow cytometry analysis carried on naïve PBMCs or on those incubated with SASP and Caco‐2 cells. For all the assays, the symbols **p < 0.01 and *p < 0.05 indicate statistical significance between the control and irradiated samples.

References

    1. Marthandan S, Priebe S, Hemmerich P, Klement K, Diekmann S. Long‐term quiescent fibroblast cells transit into senescence. PLoS One. 2014;9(12):e115597. - PMC - PubMed
    1. Tumpel S, Rudolph KL. Quiescence: good and bad of stem cell aging. Trends Cell Biol. 2019;29(8):672‐685. - PubMed
    1. Campisi J. Aging, cellular senescence, and cancer. Annu Rev Physiol. 2013;75:685‐705. - PMC - PubMed
    1. Roger L, Tomas F, Gire V. Mechanisms and regulation of cellular senescence. Int J Mol Sci. 2021;22(23):13173. - PMC - PubMed
    1. Herranz N, Gil J. Mechanisms and functions of cellular senescence. J Clin Invest. 2018;128(4):1238‐1246. - PMC - PubMed