. 2023 Jan 16:2:144-158.
doi: 10.1038/s44161-022-00206-6.

TP53- mediated clonal hematopoiesis confers increased risk for incident atherosclerotic disease

Affiliations

TP53- mediated clonal hematopoiesis confers increased risk for incident atherosclerotic disease

Seyedeh M Zekavat et al. Nat Cardiovasc Res. .

Abstract

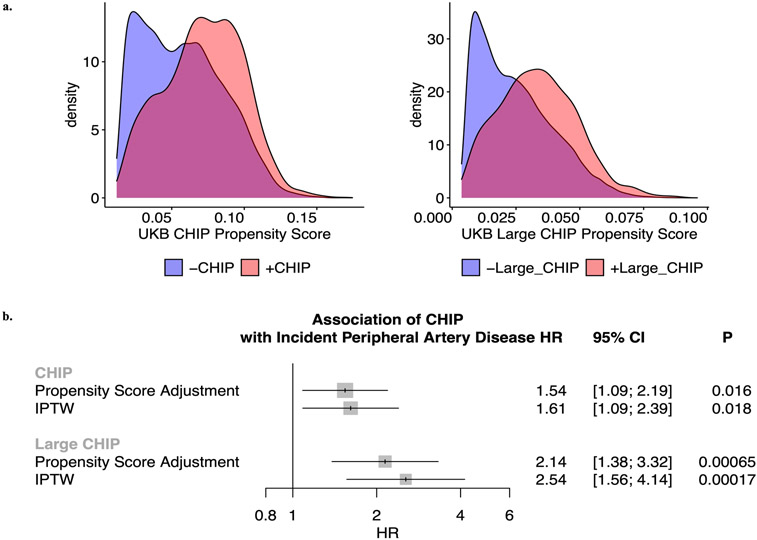
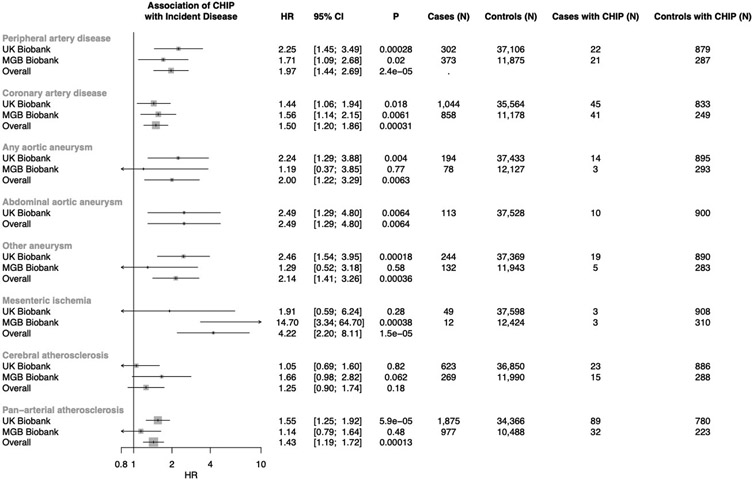
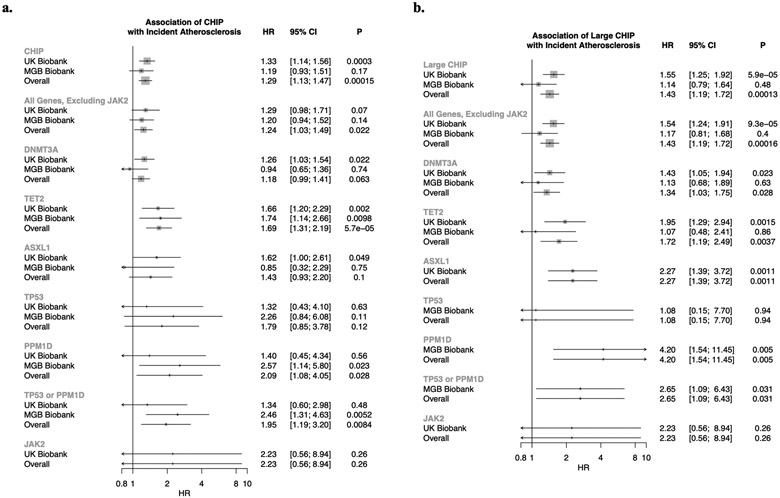
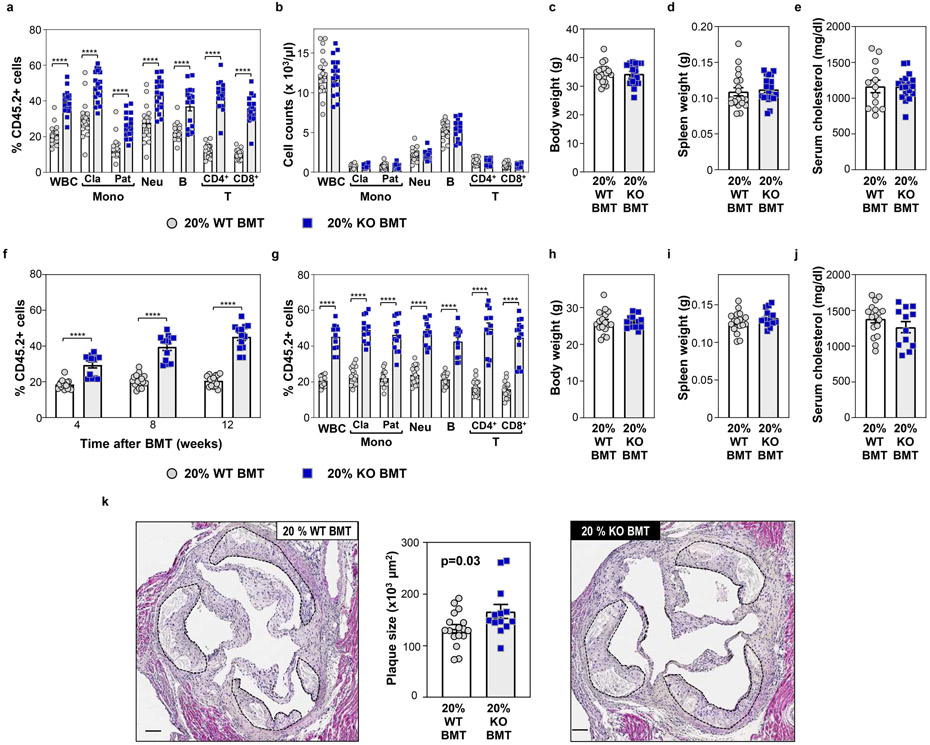
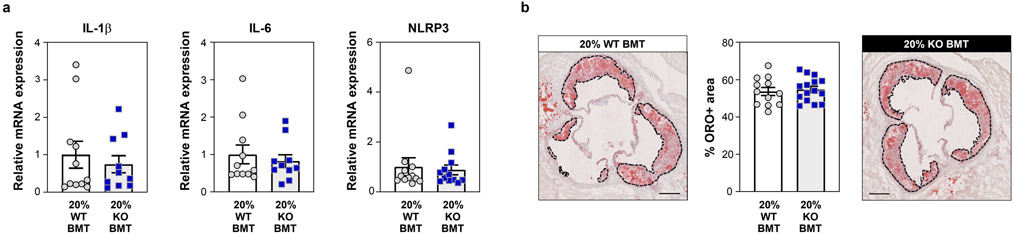
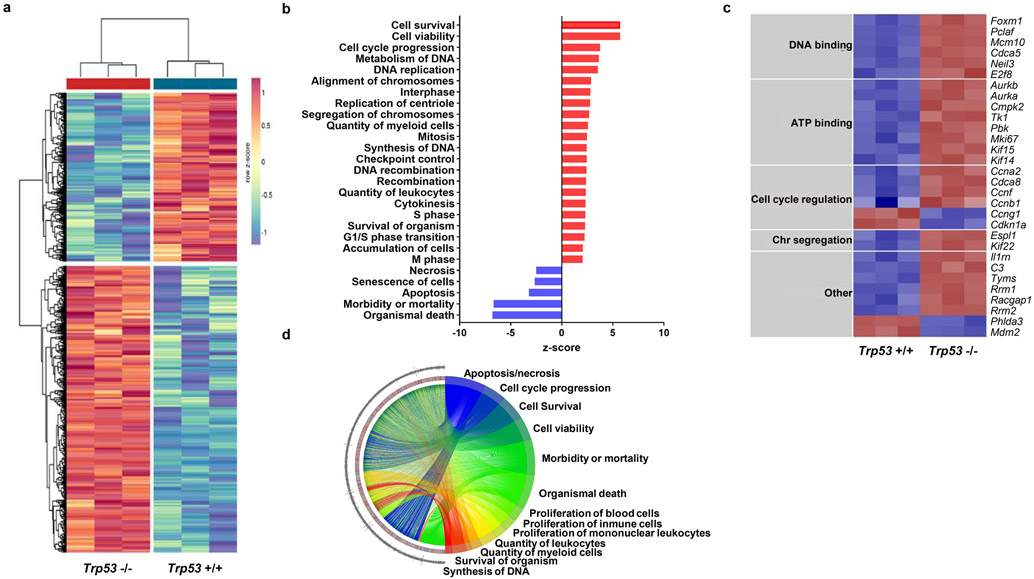
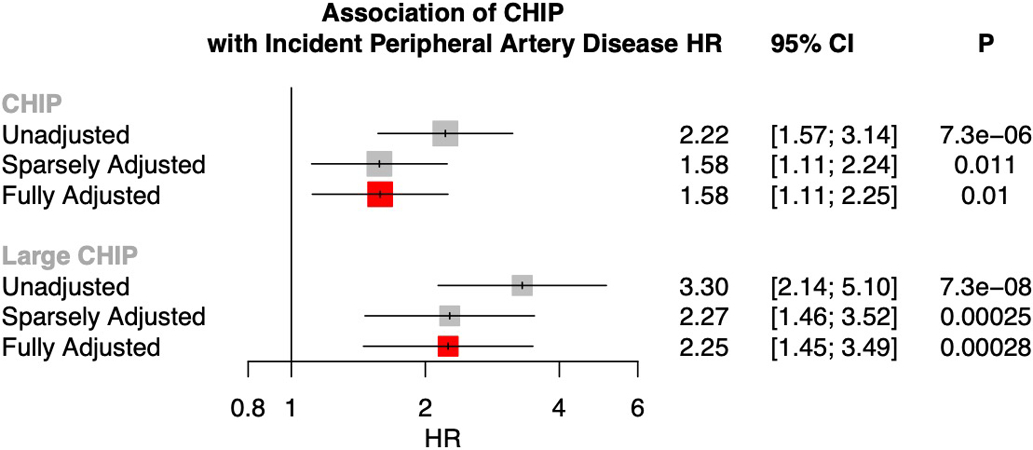
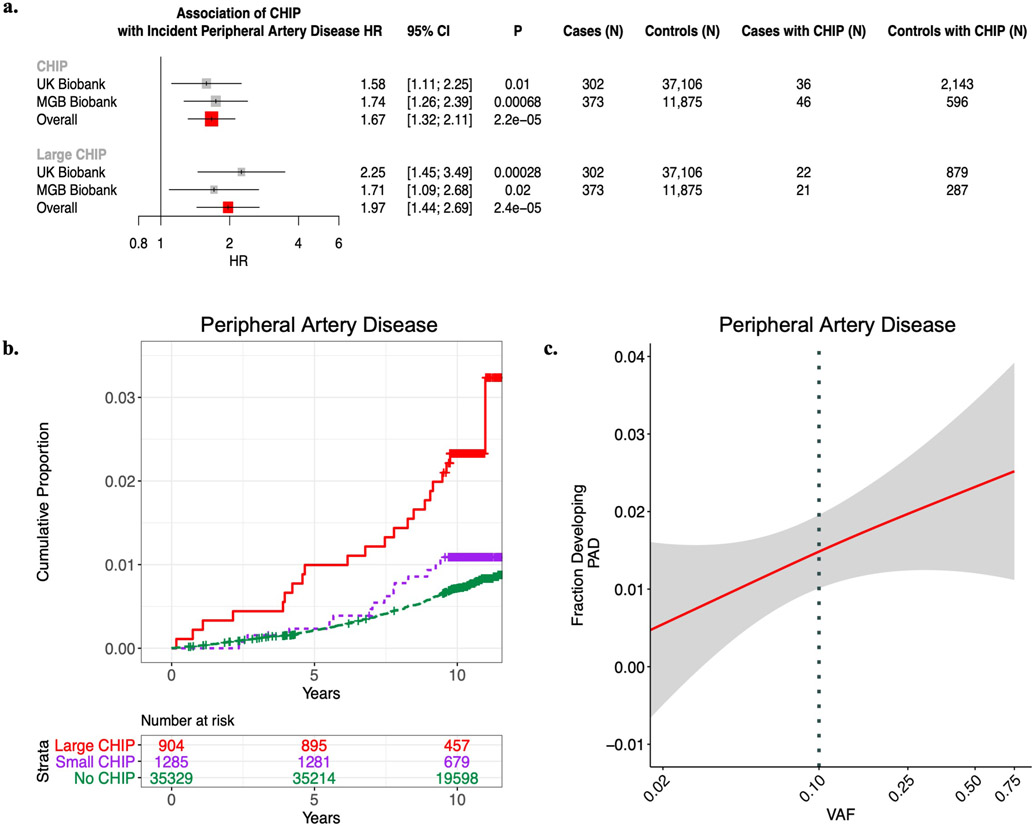
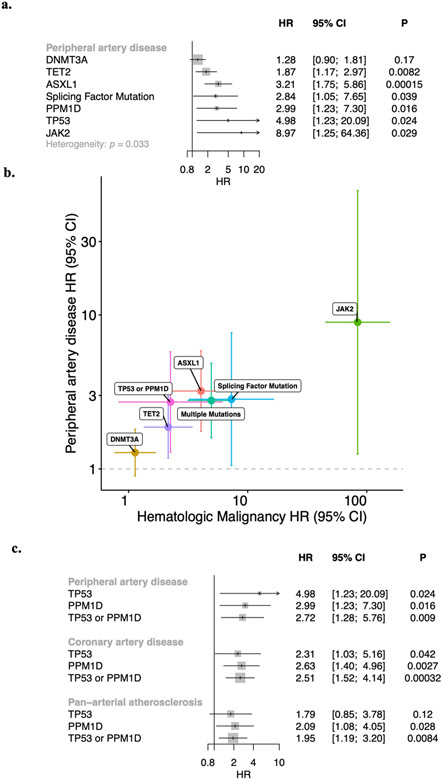
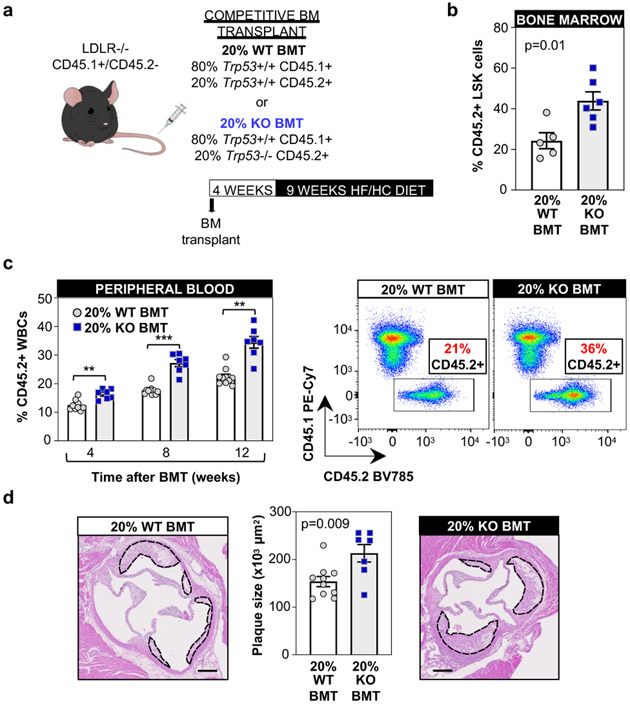
Somatic mutations in blood indicative of clonal hematopoiesis of indeterminate potential (CHIP) are associated with an increased risk of hematologic malignancy, coronary artery disease, and all-cause mortality. Here we analyze the relation between CHIP status and incident peripheral artery disease (PAD) and atherosclerosis, using whole-exome sequencing and clinical data from the UK Biobank and Mass General Brigham Biobank. CHIP associated with incident PAD and atherosclerotic disease across multiple beds, with increased risk among individuals with CHIP driven by mutation in DNA Damage Repair (DDR) genes such as TP53 and PPM1D. To model the effects of DDR-induced CHIP on atherosclerosis, we used a competitive bone marrow transplantation strategy, and generated atherosclerosis-prone Ldlr-/- chimeric mice carrying 20% p53-deficient hematopoietic cells. The chimeric mice were analyzed 13-weeks post-grafting and showed increased aortic plaque size and accumulation of macrophages within the plaque, driven by increased proliferation of p53-deficient plaque macrophages. In summary, our findings highlight the role of CHIP as a broad driver of atherosclerosis across the entire arterial system beyond the coronary arteries, and provide genetic and experimental support for a direct causal contribution of TP53-mutant CHIP to atherosclerosis.

Keywords: atherosclerosis; clonal hematopoiesis; sequencing; somatic.


Figures

Extended Data Figure 1.
Extended Data Figure 1.. Association of CHIP with blood counts among individuals without prevalent hematologic malignancy in the UK Biobank (n=37,657).
Blood counts were acquired at time of blood draw for whole exome sequencing. a) Association of CHIP and Large CHIP with normalized blood counts (SD). Associations are adjusted for age, age2, sex, smoking status, and the first ten principal components of genetic ancestry. b) Association of CHIP variant allele frequency (VAF) with blood counts (in units of 10^9 cells/L). The gray horizontal dotted lines reflect average counts across non-CHIP carriers. The vertical black dotted line reflects the cutoff VAF for Large CHIP (VAF>0.1). Error bands reflect the standard error of a generalized additive model with integrated smoothness fit to the data. CHIP = clonal hematopoiesis of indeterminate potential; VAF = variant allele fraction
Extended Data Figure 2.
Extended Data Figure 2.. Association of CHIP (a) and VAF (b) with incident hematologic malignancy among individuals without prevalent hematological malignancy in the UK Biobank (n=37,657).
Associations are adjusted for age, age2, sex, smoking status, Townsend deprivation index, and the first ten principal components of genetic ancestry. (a) Error bars are centered at the HR and show the 95% CI for estimates. (b) Error bands reflect the standard error of a generalized binomial additive model with integrated smoothness fit to the data. CHIP = clonal hematopoiesis of indeterminate potential; VAF = variant allele fraction
Extended Data Figure 3.
Extended Data Figure 3.. Epidemiological causal inference analysis for CHIP on incident peripheral artery disease in the UK Biobank.
a) Propensity scores by CHIP and Large CHIP status in the UKB (n=37,657). b) Propensity score adjustment and stabilized inverse probability treatment weighting (IPTW) for the CHIP and Large CHIP association with incident PAD in the UKB. Error bars are centered at the HR and show the 95% CI for estimates. CHIP = clonal hematopoiesis of indeterminate potential; VAF = variant allele fraction; PAD = peripheral artery disease
Extended Data Figure 4.
Extended Data Figure 4.. Association of Large CHIP (VAF>10%) with incident pan-arterial atherosclerosis, combined across peripheral artery disease, coronary artery disease, aneurysms, chronic and acute mesenteric ischemia, cerebral atherosclerosis, and renal artery stenosis.
Error bars are centered at the HR and show the 95% CI for estimates. CHIP = clonal hematopoiesis of indeterminate potential; VAF = variant allele fraction
Extended Data Figure 5.
Extended Data Figure 5.. Association of a) CHIP and b) Large CHIP genes with incident pan-arterial atherosclerosis, combined across peripheral artery disease, coronary artery disease, aneurysms, chronic and acute mesenteric ischemia, cerebral atherosclerosis, and renal artery stenosis.
Error bars are centered at the HR and show the 95% CI for estimates. CHIP = clonal hematopoiesis of indeterminate potential; VAF = variant allele fraction
Extended Data Figure 6.
Extended Data Figure 6.. Effects of experimental p53-deficient CHIP on atherosclerosis development in Ldlr−/− mice.
a-e) 20% KO-BMT male mice (n=19 mice) and 20% WT-BMT controls (n=20 mice) were fed a high-fat/high-cholesterol (HF/HC) diet for 9 weeks, starting 4 weeks after BMT. a) Percentage of CD45.2+ cells in different white blood cell (WBC) lineages in peripheral blood, evaluated by flow cytometry. Two-tailed unpaired t-tests were used for statistical analysis (mean±SEM, ****p<0.0001). b) Absolute counts of main WBC sub-populations in peripheral blood, evaluated by flow cytometry (mean±SEM). c) Body weight (mean±SEM). d) Spleen weight (mean±SEM). e) Total cholesterol level in serum, evaluated by enzymatic methods (mean±SEM). f-k) 20% KO-BMT female mice and 20% WT-BMT controls were fed a high-fat/high-cholesterol (HF/HC) diet for 9 weeks, starting 4 weeks after BMT. f) Percentage of CD45.2+ cells in white blood cells at different timepoints, evaluated by flow cytometry. A two-way ANOVA with Sidak’s multiple comparison test was used for statistical analysis (mean±SEM,****p<0.0001). g) Percentage of CD45.2+ cells in different WBC lineages in peripheral blood after 9 weeks on HF/HC diet (13 weeks post-BMT), evaluated by flow cytometry. Two-tailed unpaired t-tests were used for statistical analysis (mean±SEM, n=16 20% WT-BMT mice, n=13 20% KO-BMT mice, ****p<0.0001). h) Body weight (mean±SEM, n=17 20% WT-BMT mice, n=13 20% KO-BMT mice). i) Spleen weight (mean±SEM, n=17 20% WT-BMT mice, n=13 20% KO-BMT mice). j) Total cholesterol level in serum, evaluated by enzymatic methods (mean±SEM, n=17 20% WT-BMT mice, n=12 20% KO-BMT mice) k) Aortic root plaque size. A two-tailed unpaired t-test was used for statistical analysis (mean±SEM, n=17 20% WT-BMT mice, n=13 20% KO-BMT mice). Representative images of hematoxylin and eosin-stained sections are shown; atherosclerotic plaques are delineated by dashed lines. Scale bars, 100 μm.
Extended Data Figure 7.
Extended Data Figure 7.. No effect of p53-deficient CHIP on plaque lipid content or aortic expression of the proinflammatory cytokines IL-1b and IL-6 or the NLRP3 inflammasome.
a) Aortic arch samples were obtained from HF/HC-fed 20% KO-BMT male mice and 20% WT-BMT controls, and gene expression was analyzed by qPCR (mean±SEM, n=11 20% WT-BMT mice, n=10 20% KO-BMT mice). b) 20% KO-BMT male mice and 20% WT-BMT controls were fed a high-fat/high-cholesterol (HF/HC) diet for 9 weeks. Plaque lipid content was analyzed through Oil Red O (ORO) staining of cryostat sections (mean±SEM, n=12 20% WT-BMT mice, n=15 20% KO-BMT mice). Representative images of ORO-stained sections are shown; atherosclerotic plaques are delineated by dashed lines. Scale bars, 200 μm.
Extended Data Figure 8.
Extended Data Figure 8.. Increased cell proliferation in conditions of p53-deficient CHIP.
a) 20% KO-BMT female mice and 20% WT-BMT controls were fed a high-fat/high-cholesterol (HF/HC) diet for 9 weeks, starting 4 weeks after BMT. Plaque cell proliferation was estimated based on immunohistochemical staining of the Ki-67 proliferation marker (mean±SEM, n=17 20% WT-BMT mice, n=14 20% KO-BMT mice). A two-tailed unpaired t-test was used for statistical analysis. Representative images of Ki-67-stained sections are shown; color deconvolution was applied to show separately the staining of hematoxylin (nuclei) and Ki-67. Atherosclerotic plaques are delineated by dashed lines. Scale bars, 50 μm. b) Cell cycle phase distribution of cultured Trp53−/− and +/+ bone marrow-derived macrophages proliferating asynchronously in the presence of 100 ng/ml MCSF, evaluated by propidium iodide staining of cellular DNA content and flow cytometry (mean±SEM, n=6 Trp53+/+ mice, n=6 Trp53−/− mice). A two-way ANOVA with Sidak’s multiple comparison test was used for statistical analysis. c) Analysis of the proliferation of cultured Trp53−/− and +/+ bone marrow-derived macrophages through immunostaining of BrdU incorporation into the DNA. Quiescent G0-synchronized macrophages were treated with MCSF to induce proliferation (mean±SEM, n=3 Trp53+/+ mice, n=3 Trp53−/− mice). A two-tailed unpaired t-test was used for statistical analysis. A representative experiment is shown; three separate experiments were conducted. Scale bars, 100 μm.
Extended Data Figure 9.
Extended Data Figure 9.. Transcriptomic profiling of MCSF-stimulated p53-deficient macrophages.
An 18h-treatment with MCSF was used to induce cell cycle entry and progression in quiescent G0-synchronized Trp53−/− (KO) and +/+ (WT) murine macrophages in culture (n=3 per genotype). mRNA sequencing was used for transcriptomic profiling. a) Heatmap of differentially expressed genes with fold change (FC)≥1.5. b) Functional categories enriched in the set of genes differentially expressed between Trp53−/− and +/+ macrophages, based on Ingenuity Pathway Analysis (cancer-related pathways are not shown). c) Heatmap of the most upregulated genes within selected functional categories that are enriched in genes differentially expressed in Trp53−/− macrophages with fold change≥1.5. d) GoPlot of selected functional categories (right hand-side) and the logFC values of the most differentially expressed genes included in these categories (left hand-side).
Extended Data Fig. 10.
Extended Data Fig. 10.. Association of CHIP and Large CHIP (variant allele fraction>10%) with PAD in the UKB (N=37,657)
under 1) unadjusted, 2) sparsely adjusted, and 3) fully adjusted models, where sparsely adjusted refers to the following covariates: age, age2, sex, smoking status, Townsend deprivation index, and the first ten principal components of genetic ancestry, and the fully adjusted model additionally includes normalized BMI, prevalent hypertension, hyperlipidemia, and type 2 diabetes as covariates. Given the minimal difference between the sparsely adjusted and fully adjusted model, the sparsely adjusted model was moved forward for use in analysis. Error bars are centered at the HR and show the 95% CI for estimates.
Figure 1.
Figure 1.. CHIP and incident PAD risk.
a) Association of CHIP and large CHIP (VAF>10%) carrier state with incident PAD events in the UK Biobank (UKB) (N=37,657) and Mass General Brigham Biobank (MGBB) (N=12,465). Results were combined using an inverse-variance weighted fixed effects meta-analysis. Error bars are centered at the HR and show the 95% CI for estimates. b) Cumulative proportion of individuals developing PAD stratified by CHIP VAF clone size category in the UK Biobank (N=37,657). c) Fraction of individuals developing incident PAD by CHIP VAF in the UK Biobank. The dotted vertical line at VAF of 0.10 represents the cut-off for the definition of a large CHIP clone. Error bands reflect the standard error of a generalized binomial additive model with integrated smoothness fit to the data. CHIP = clonal hematopoiesis of indeterminate potential; VAF = variant allele fraction; PAD = peripheral artery disease
Figure 2.
Figure 2.. CHIP and incident pan-arterial atherosclerosis risk.
a) Association of CHIP with 9 total incident atherosclerotic diseases separately and combined in a ‘Pan-arterial atherosclerosis’ phenotype in the UKB, MGBB, and meta-analyzed across both studies (“Overall”). Error bars are centered at the HR and show the 95% CI for estimates. b) Cumulative risk of incident atherosclerosis across the composite ‘pan-arterial atherosclerosis’ phenotype stratified by no CHIP, small CHIP (VAF<10%), and large CHIP (VAF≥10%) carrier state in the UK Biobank (N=37,657). c) Association of CHIP VAF with fraction of individuals developing pan-arterial atherosclerosis in the UK Biobank (N=37,657). Error bands reflect the standard error of a generalized binomial additive model with integrated smoothness fit to the data. CHIP = clonal hematopoiesis of indeterminate potential; VAF = variant allele fraction; PAD = peripheral artery disease
Figure 3:
Figure 3:. Gene-specific association of CHIP with incident peripheral artery disease (PAD).
a) CHIP-PAD association analyses stratified by putative CHIP driver gene. Results following meta-analysis across the UKB and MGBB (N=50,122) are shown. Error bars are centered at the HR and show the 95% CI for estimates. b) Gene-specific comparison of HR and 95% CI for hematologic malignancy (x-axis) and PAD (y-axis) in the UKB (N=37,657). Error bars are centered at the HR and show the 95% CI for estimates. c) Association of DDR CHIP (PPM1D or TP53) with incident peripheral artery disease, coronary artery disease, and pan-vascular atherosclerosis. Results across UK Biobank (N=37,657) and MGB Biobank (N=12,465) were combined using an inverse-variance weighted fixed effects meta-analysis. Error bars are centered at the HR and show the 95% CI for estimates. CHIP = clonal hematopoiesis of indeterminate potential; DDR = DNA-damage repair; VAF = variant allele fraction; PAD = peripheral artery disease
Figure 4.
Figure 4.. Accelerated atherosclerosis in a murine model of TP53 mutation-driven CHIP.
a) Summary of the competitive BMT approach and the timeline of these studies. 20% KO-BM male mice and 20% WT-BMT controls were fed a high-fat/high-cholesterol (HF/HC) diet for 9 weeks, starting 4 weeks after BMT. b) Percentage of CD45.2+ cells in the BM LSK population (Lin- Sca1+ cKit+ cells) after 9 weeks on HF/HC diet (13 weeks post-BMT), evaluated by flow cytometry (mean±SEM, n=5 20% WT-BMT mice, n=6 20% KO-BMT mice); a two-tailed unpaired t-test was used for statistical analysis. c) Percentage of CD45.2+ cell in the white blood cell population, evaluated by flow cytometry (mean±SEM, n=10 20% WT-BMT mice, n=7 20% KO-BMT mice); a two-way ANOVA with Sidak’s multiple comparison test was used for statistical analysis (** p<0.01; ***p<0.001). Representative CD45.1/CD45.2 dot plots are shown. d) Aortic root plaque size (mean±SEM, n=10 20% WT-BMT mice, n=7 20% KO-BMT mice; a two-tailed unpaired t-test was used for statistical analysis. Representative images of hematoxylin and eosin-stained sections are shown; atherosclerotic plaques are delineated by dashed lines. Scale bars, 100 μm.
Figure 5.
Figure 5.. Expansion of p53-deficient macrophages within atherosclerotic plaques.
a) Histological analysis of plaque composition in 20% KO-BMT female mice and 20% WT-BMT controls, quantified as absolute intimal content of macrophages (Mac2 antigen immunostaining), vascular smooth muscle cells (smooth muscle α-actin, SMA immunostaining), collagen (Masson’s trichrome staining) and necrotic core (collagen-free acellular regions); representative images are shown (mean±SEM, n=10 20% WT-BMT mice, n=8 20% KO-BMT mice). Two-tailed unpaired t-tests were used for statistical analysis. b) Percentage of CD45.2+ cells within the aortic macrophage population (CD3−, Ly6G−, CD11b+, F4/80High) and blood classical monocytes (CD3−, CD115High, Ly6G−, CD43Low, Ly6CHigh) of 20% KO-BMT mice and controls, evaluated by flow cytometry (mean±SEM, n=6 independent mice per BM genotype in classical monocyte analyses, n=3 pools of 2 aortic arches collected from independent mice in aortic macrophage analyses). A two-way ANOVA with Tukey’s multiple comparison test was used for statistical analysis Representative CD45.1/CD45.2 plots of aortic macrophages are shown. c) Immunofluorescent staining and confocal microscopy imaging of CD45.2+ cells (green) and CD68+ macrophages (red) in atherosclerotic plaques of 20% KO-BMT mice and 20% WT-BMT controls. DAPI-stained nuclei are shown in blue. Representative images are shown (sections from n=14 20% WT-BMT mice and n=12 20% KO-BMT mice from 2 independent experiments were examined). Yellow triangles indicate examples of CD45.2/CD68-doble positive cells. Atherosclerotic plaques are delineated by dashed lines. Scale bars, 50 μm.
Figure 6.
Figure 6.. Increased proliferation of p53-deficient macrophages.
a) Percentage of Ki-67+ proliferating cells within the aortic CD45.2+ macrophage population of 20% KO-BMT mice and controls evaluated by flow cytometry (mean±SEM, n=3 pools of 2 murine aortic arches per BM genotype) evaluated by flow cytometry; a two-tailed unpaired t-test was used for statistical analysis. Representative plots are shown. b) % of S-phase cells in cultures of Trp53−/− and +/+ murine BM-derived macrophages, evaluated by propidium iodide staining of cellular DNA content and flow cytometry. Treatment with MCSF was used to induce cell cycle entry and progression in quiescent G0-synchronized macrophages (mean±SEM, n=10 Trp53+/+ mice, n=9 Trp53−/− mice). A two-way repeated measures ANOVA with Sidak’s multiple comparisons test was used for statistical analysis. c, d) qPCR (c, n=7 mice) and Western Blot (d, n=5 mice) analyses of Trp53 expression in cultured primary macrophages after MCSF mitogenic stimulation. A representative blot is shown. (mean±SEM, *p<0.05; ****p<0.0001 vs baseline); a one-way repeated measures ANOVA with Tukey’s multiple comparison test was used for statistical analysis. e) Expression of cell cycle regulators Cdkn1a/p21Cip1 and Ccnb1/Cyclin B1 in cultured Trp53−/− and +/+ macrophages proliferating asynchronously (Async, mean±SEM, n=10 mice per genotype) or after MCSF stimulation (mean±SEM, n=7 Trp53+/+ mice, n=6 Trp53−/− mice). A two-tailed unpaired t-test (with Welch’s correction for Ccnb1 analysis) and a two-way repeated measures ANOVA with Sidak’s multiple comparison test, respectively, were used for statistical analysis (**p<0.01; ***p<0.001; ****p<0.0001).

Similar articles

Cited by

References

    1. Song P, et al. Global, regional, and national prevalence and risk factors for peripheral artery disease in 2015: an updated systematic review and analysis. Lancet Glob Health 7, e1020–e1030 (2019). - PubMed
    1. Conte MS, et al. Global vascular guidelines on the management of chronic limb-threatening ischemia. J Vasc Surg 69, 3S–125S.e140 (2019). - PMC - PubMed
    1. Jaiswal S, et al. Age-Related Clonal Hematopoiesis Associated with Adverse Outcomes. New England Journal of Medicine 371, 2488–2498 (2014). - PMC - PubMed
    1. Jaiswal S, et al. Clonal Hematopoiesis and Risk of Atherosclerotic Cardiovascular Disease. New England Journal of Medicine 377, 111–121 (2017). - PMC - PubMed
    1. Xie M, et al. Age-related mutations associated with clonal hematopoietic expansion and malignancies. Nature medicine 20, 1472–1478 (2014). - PMC - PubMed